City, University of London Institutional Repository
Citation
:
Lak, A., Nomoto, K., Keramati, M., Sakagami, M. and Kepec, A. (2017). Midbrain Dopamine Neurons Signal Belief in Choice Accuracy during a Perceptual Decision. Current Biology, 27(6), pp. 821-832. doi: 10.1016/j.cub.2017.02.026This is the accepted version of the paper.
This version of the publication may differ from the final published
version.
Permanent repository link:
http://openaccess.city.ac.uk/21165/Link to published version
:
http://dx.doi.org/10.1016/j.cub.2017.02.026Copyright and reuse:
City Research Online aims to make research
outputs of City, University of London available to a wider audience.
Copyright and Moral Rights remain with the author(s) and/or copyright
holders. URLs from City Research Online may be freely distributed and
linked to.
City Research Online: http://openaccess.city.ac.uk/ publications@city.ac.uk
1
Midbrain dopamine neurons signal belief in choice
accuracy during a perceptual decision
Authors: Armin Lak1,2, Kensaku Nomoto3,4, Mehdi Keramati5, Masamichi Sakagami3 & Adam Kepecs1,6*
Affiliations:
1Cold Spring Harbor Laboratory, Cold Spring Harbor, New York, 11724, United States.
2UCL Institute of Ophthalmology, University College London, London EC1V 9EL, United
Kingdom.
3Brain Science Institute, Tamagawa University, Machida, Tokyo, 194-8610, Japan.
4Champalimaud Neuroscience Programme, Champalimaud Centre for the Unknown, Av. de
Brasilia, 1400-038 Lisbon, Portugal.
5Gatsby Computational Neuroscience Unit, University College London, London W1T 4JG,
United Kingdom.
6Lead contact
2 Summary
Central to the organization of behavior is the ability to predict the values of outcomes to guide choices. The accuracy of such predictions is honed by a teaching signal that indicates how incorrect a prediction was (‘reward prediction error’, RPE). In several reinforcement learning contexts such as Pavlovian conditioning and decisions guided by reward history, this RPE signal is provided by midbrain dopamine neurons. In many situations, however, the stimuli predictive of outcomes are perceptually ambiguous. Perceptual uncertainty is known to influences choices, but it has been unclear whether or how dopamine neurons factor it into their teaching signal. To cope with uncertainty, we extended a reinforcement learning model with a belief state about the perceptually ambiguous stimulus; this model generates an estimate of the probability of choice correctness, termed decision confidence. We show that dopamine responses in monkeys performing a perceptually ambiguous decision task comply with the model’s predictions. Consequently, dopamine responses did not simply reflect a stimulus’ average expected reward value, but were predictive of the trial-to-trial fluctuations in perceptual
accuracy. These confidence-dependent dopamine responses emerged prior to
3 Introduction
In the struggle of life animals survive by following a simple dictum: win big and win often [1]. Finding bigger wins (e.g. more food reward) and more likely wins is particularly challenging when these are not available in their nearby environment. In these situations a process of trial and error is required to selectively reinforce the most successful actions. Inspired by the study of animal behavior, a machine learning approach called reinforcement learning provides a rigorous framework to understand how to select winning behaviors. The key to reinforcement learning is adjusting the expected reward values associated with each behavior based on the
outcomes of one’s actions. These adjustments to reward values are based on the discrepancy between the received and predicted value, referred to as the reward prediction error [2]. There is a great deal understood about the neural mechanisms underlying reinforcement learning and it is well established that midbrain dopamine neurons broadcast reward prediction error signals [3-6]. Here we address whether dopamine neurons provide appropriate prediction error signals when there is ambiguity in the cues that predict rewards.
Computing reward prediction error, by definition, requires predicting the value of impending outcomes. Such value prediction relies on different sources of information and correspondingly distinct processes as dictated by the behavioral context. In one context, distinct, unambiguous cues that predict different reward outcomes are used to guide decisions. Because there is no uncertainty in identifying the cues, the accuracy of outcome predictions is limited instead by potentially complex, probabilistic reward payoff contingencies. Thus the expected value of each decision can be estimated based on the experienced outcomes associated with the cues. These estimates can be produced by classic reinforcement learning algorithms [2]. In the context of ambiguous stimuli requiring perceptual decisions, animals face an additional challenge, because reward history alone can only provide an inaccurate estimate of upcoming outcome value. Rather, estimating the value of the choice requires an evaluation of the immediate percept and the decision process to compute the probability that the choice will be correct [7-9]. Thus, reward history-guided and perceptual decisions, despite having fundamental similarities, differ in the computations required for reward prediction and hence prediction error estimation.
temporally-4
extended responses during the perceptual choice and that they can reflect subjective sensory experiences, rather than physical stimulus intensity [24, 25].
To understand dopamine neuron responses in perceptual decision making, we constructed a reinforcement learning model that incorporated a belief state to infer the trial-by-trial probability of choice correctness, reflecting the confidence in the decision. We compared dopamine neuronal responses recorded during a visual decision task to predictions of our model. These analyses enable us to show that dopamine prediction errors can reflect decision confidence in addition to reward magnitude and these signals emerge even before the behavioral manifestation of choice.
Results
Previously, Nomoto and colleagues studied midbrain dopamine neurons in a perceptual decision task [24]. Here we reexamined these neuronal responses in an attempt to identify signatures of prediction errors based on the value of a perceptual decision that requires an on-line estimate of the probability of choice correctness. The behavioral task and monkeys’ performance have been described previously [24] and explained in the Supplemental Experimental Procedures. Briefly, two Japanese macaques performed a two-alternative forced-choice reaction time task (Figure 1A, see Figure S1A). In each trial, monkeys were presented with a random dot motion visual stimulus and were trained to move their gaze to one of two targets based on the direction of motion and receive juice reward for their correct choices. Choice difficulty was adjusted by varying the coherence of dots pseudo-randomly from trial to trial. Across blocks of varying lengths, one motion direction was associated with a large reward magnitude while the other one was associated with a small reward. Animals could categorize easy (high coherence) stimuli almost perfectly but were challenged with more difficult (low coherence) stimuli (Figure S1B). Moreover, due to the asymmetric reward schedule, when presented with low coherence stimuli, animals showed bias toward the direction associated with the larger reward (Figure S1B, C).
A reinforcement learning model incorporating perceptual uncertainty
5
maker faces an additional obstacle beyond stimulus-reward association, the need to make an estimate of the true state of the environment based on the current perceptual experience. This estimate is referred to as the ‘belief state’ [29, 30], and can be used to infer the probability that the choice will turn out to be correct, i.e. decision confidence. POMDP-based TDRL incorporates this belief into the computation of state values from which a choice can be made and a prediction error can be generated.
Having received a motion stimulus, 𝑠𝑚, the model represents a noisy estimate of it, sampled from a normal distribution with constant variance and mean given by the true stimulus, 𝑆̂𝑚~𝒩(𝑠𝑚, 𝜎2). In a Bayesian framework, a subject’s belief about the stimulus is not limited to a single estimated value but comprises a belief distribution over all possible values of 𝑠𝑚, given by 𝑝(𝑠𝑚|𝑆̂𝑚). Assuming that the subject’s prior is that stimuli are uniformly delivered, the belief state distribution will also be Gaussian with the same variance as the sensory noise distribution, and mean given by 𝑆̂𝑚, 𝑠̂𝑚: 𝑝(𝑠𝑚|𝑆̂𝑚) = 𝒩(𝑆̂𝑚, 𝜎2) (Figure 1A). The model also stores the values of taking a left (L) or right (R) action, given each possible state 𝑠𝑚: 𝑄(𝑠𝑚, 𝐿) and 𝑄(𝑠𝑚, 𝑅), respectively. On each trial, the value of left and right choices are computed as the expected values of these Q-values, given the belief state 𝑠̂𝑚 = 𝑝(𝑠𝑚|𝑆̂𝑚). That is:
𝑄𝑠̂𝑚(𝐿) = 〈𝑄(𝑠𝑚, 𝐿)〉𝑠̂𝑚 and 𝑄𝑠̂𝑚(𝑅) = 〈𝑄(𝑠𝑚, 𝑅)〉𝑠̂𝑚 , where 〈. 〉𝑝 denotes the expectation operator. Thus Q-values integrate both past rewards as well as the currently computed belief. The choice is computed by comparing 𝑄𝑠̂𝑚(𝐿) and
𝑄𝑠̂𝑚(𝑅). When the rewards for correct choices are equal across sides, then the only factor contributing to the choice is the current sensory signal. However, when rewards are unequal then choices are biased toward the larger value side in proportion to their relative size. The reward expectation associated with the choice (i.e. decision value) is given by 𝑄𝑠̂𝑚(𝑐ℎ𝑜𝑖𝑐𝑒). Upon receiving the outcome (small, large or no reward) the model computes the prediction error, 𝛿𝑚, the difference between the received reward size and the decision value, which incorporates both past rewards and the subjective belief about the accuracy of the current choice. This prediction error is then used to update 𝑄(𝑠𝑚, 𝐿) and 𝑄(𝑠𝑚, 𝑅), which are used to make decisions in subsequent trials. Therefore, by employing a belief state, the POMPD-based TDRL model can represent the trial-by-trial probability that the choice will turn out to be correct. Therefore, our main model introduces a case in which reward predictions (and hence prediction errors) are computed based on the same state inference process used by the decision making system.
6
have access to the perceptual uncertainty underlying the choice process.
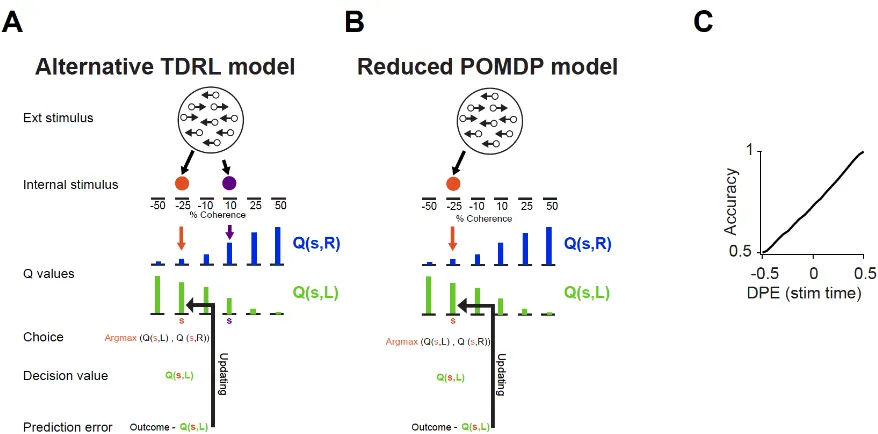
We refer to the prediction errors of the first model as decision value prediction errors (DPE), because these incorporate information about the current decision process. This is in contrast to prediction errors produced by the alternative model, which we refer to as the Markov Decision Process MDP prediction error (MDP-PE) that does not have direct access to the sensory evidence underling choice computation.
To test the novel features of prediction errors in our belief state-dependent TDRL model, we wanted to isolate the contribution of the belief computation by first considering only large-reward trials (i.e. trials in which the model chose the side with the large reward). Following training, the model with the belief state produces three task-related prediction error responses (Figure 1B, top panel). First, there is a prediction error evoked by the fixation cue, the earliest predictor of a potential reward. This signal is uniform across all trial types and is proportional to the average value of a trial. Second, the model generates another prediction error when the stimulus is presented. This signal encodes the difference between the value of the current decision and the average value of a trial (indicated by the fixation cue) and can thus take on positive or negatives values. Finally, the model generates a prediction error at the moment of feedback signaling the deviation between the actual and the predicted outcome, i.e. the decision value at the stimulus time. The alternative TDRL model also generates three task-related prediction errors (Figure 1B, bottom panel). Similar to the TDRL model with the belief state, prediction errors evoked by the fixation cue are uniform across trials. However, the prediction errors to stimuli and feedback are different from those generated by the alternative model in several ways (Figure 1B, cf. Figure 1C-E with Figure 1F-H).
First, prediction errors generated by TDRL model with the belief state are distinct for correct and error outcomes (Figure 1C, D). At the time of the stimulus and outcome, prediction errors of the model with belief state reflect both stimulus difficulty as well as the upcoming outcome, thus qualitatively differing from those generated by the alternative model, which only reflect stimulus difficulty (Figure 1F, G). Second, the magnitude of prediction error at the time of the stimulus is predictive of decision accuracy (Figure 1E and H, see Figure S2C); decisions in trials with high prediction errors have greater accuracy for the same stimulus difficulty (Figure 1E), in sharp contrast with the alternative model (Figure 1H).
7
can be formalized as 𝑝(𝑐𝑜𝑟𝑟𝑒𝑐𝑡|𝑐ℎ𝑜𝑖𝑐𝑒, 𝑝𝑒𝑟𝑐𝑒𝑝𝑡), where percept, the internal representation of the stimulus, is specified by the belief state. In our model, this quantity can be determined by computing the probability that the correct action corresponding to different stimulus states is the same as the chosen action (see Experimental Procedure). When computed for different stimulus difficulties and plotted separately for correct and incorrect trials, the pattern of computed
𝑝(𝑐𝑜𝑟𝑟𝑒𝑐𝑡|𝑐ℎ𝑜𝑖𝑐𝑒, 𝑝𝑒𝑟𝑐𝑒𝑝𝑡)closely resembled the prediction error pattern of our belief-based TDRL model (Figure 2A, cf. Figure 1C-D). This indicates that the prediction errors generated by the model with a belief state are mathematically equivalent to decision confidence. Note that keeping track of the entire belief distribution, while important for optimal behavior in non-stationary environments, is not necessary for our behavioral task. Because of the stationarity typical of laboratory decision tasks, a reduced version of our model that uses the mean of the belief state to assign a single state to the motion stimulus, without keeping track of the full distribution could also account for our data (see Figure S2B and Experimental Procedure). In summary, when the model incorporates information about the current decision process, after learning, it contains the knowledge about the relationship between quality of internal evidence and the expected outcome of the decision, in other words, decision confidence.
The signature predictions of the TDRL model with the belief state (Figure 1C) can be intuitively understood using a signal detection theory inspired approach to decision confidence. Here, confidence reflects the distance between the internal representation of the stimulus (percept), and decision boundary, 𝑏, or more precisely confidence is a calibrated function of this distance, 𝑐 = 𝑓𝑐|𝑝𝑒𝑟𝑐𝑒𝑝𝑡 − 𝑏|, as shown previously [32]. Figure 2B illustrates how the stimulus and boundary configurations that could lead to a given choice offer an intuition behind model predictions. For correct choices, distance between stimulus distribution and the boundary increases as the stimulus becomes easier. For error choices, which happen when a stimulus is perceived to be on the wrong side of the boundary, the distance between stimulus sample and boundary tends to be smaller for easy stimuli because the overlapping region of the stimulus distribution is smaller. Thus, although errors are less frequent for easy stimuli, when they occur, the distance from the stimulus sample to the boundary is small, and hence confidence is low.
Responses of dopamine neurons reflect decision confidence
8
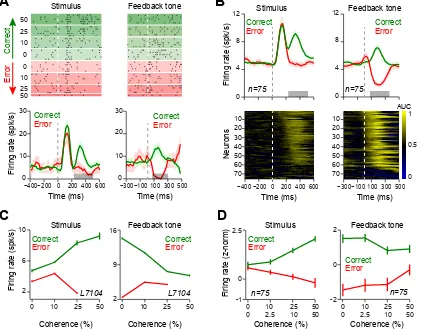
stimulus and feedback tone (see Figure S3A-C for responses to the fixation cue), and separated based on the trial outcome. After stimulus onset, the early responses (until ~200 ms) were uniform, and only later components (~200-500ms) reflected stimulus coherence [24]. These later responses increased with stimulus coherence for correct choices (Linear regression on single neurons, 67/75 positive and 5/75 negative slope, P < 0.01, 3/75 not significant) and decreased for error choices (Linear regression on single neurons: 33/75 with negative and 5/75 positive slope, P
< 0.01, 37/75 not significant), consistent with the DPEs of the model with belief state (cf. Figure 1C with Figure 3C and D). Note that analyzing dopamine responses using a longer temporal window (60-600 ms after the stimulus onset) displayed very similar response patterns (Figure S3D). Responses to the feedback tone also showed graded sensitivity to both the stimulus coherence and the animal’s choice similar to the DPE signals (cf. Figure 1D with Figure 3C and D; Linear regression on single neurons for correct trials: 53/75 with positive, 8/75 with negative slope, P < 0.01, 14/75 not significant; Linear regression on single neurons for error trials: 27/75 with negative, 14/75 with positive slope, P < 0.01, 34/75 not significant). To further quantify when this choice outcome-selectivity (difference between correct and error trials) arose in individual neurons, we used receiver operating characteristic (ROC) analysis and computed area under ROC curve (AUC) in sliding time windows (Experimental Procedures). Figure 3B shows that the majority of neurons showed outcome-selective responses to the stimulus and feedback (61/75 and 66/75 neurons, for responses to the stimulus and feedback tone, respectively, permutation test on sliding ROCs, P < 0.001). These results suggest that during perceptual decisions, dopamine responses do not simply reflect the average value of the perceptually ambiguous stimulus but are also predictive of the trial-to-trial fluctuations in decision outcome.
Confidence-dependent dopamine responses arise prior to observed choice
We next considered the time course of choice outcome-selectivity in relation to saccade initiation, which is the earliest observable measure of choice commitment (Figure 4A and B). We found that the difference in dopamine responses between correct and error choices emerged considerably before action initiation (Figure 4A, Mann-Whitney U test on responses during 300 ms before saccade onset: 33/75 neurons with larger pre-saccadic activity for correct compared to error trials, P < 0.05; sliding ROC analysis with permutation test: 45/75 neurons extending up to 300 ms before the saccade onset, P < 0.001). Thus, outcome-selective dopamine responses begin even before the behavioral manifestation of choice commitment.
9
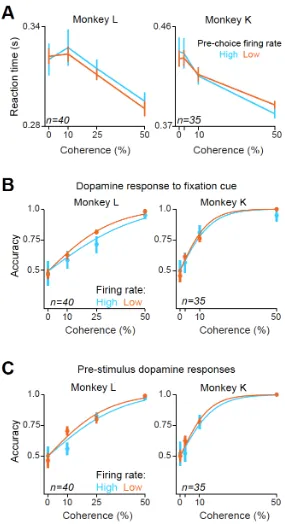
predictive property of responses should go beyond what can be inferred from stimulus difficulty alone, such that trials with larger prediction errors should have increased accuracy for the same stimulus difficulty (Figure 1E). To test this, we separated trials based on the rate of the pre-choice dopamine activity (below versus above 75 percentile) and found that monkeys’ psychometric slopes were significantly greater when dopamine activity was high (Figure 4D, Mann-Whitney U test on session-by-session slopes of the psychometric functions: Monkey L: p = 1.99 X 10⁻⁶, Monkey K: p = 0.002; Mann-Whitney U test on individual data points, p < 0.05 in both monkeys). We next considered the possibility that this difference in performance is due to different durations of sensory evidence integration. There was no difference in reaction times for a given stimulus difficulty for high and low pre-choice dopamine activity (Figure S4A, p > 0.1; Mann-Whitney U test) and the difference in psychometric slopes (Figure 4D) held even when we only considered high or low reaction times (median split, p < 0.01 in both monkeys). These analyses exclude the possibility that dopamine firing simply indexes reaction times and thus the accuracy differences observed are a direct consequence of differential sensory evidence integration. In contrast to this choice-predictive phasic dopamine activity, separating trials based on the pre-stimulus tonic activity or phasic activity to the fixation cue did not reveal correlations with perceptual accuracy (P > 0.1 in both monkeys, Mann-Whitney U test, Figure S4B-C). Theoretical accounts as well as pharmacological studies in humans suggested that the tonic levels of dopamine correlate with factors such as average reward rate that reflect response vigor ([33, 34], but see [35] for pre-trial dopamine action potentials). In our data the tonic firing of dopamine neurons before trial initiation does not correlate with decision accuracy.
Dopamine responses integrate decision confidence and reward size
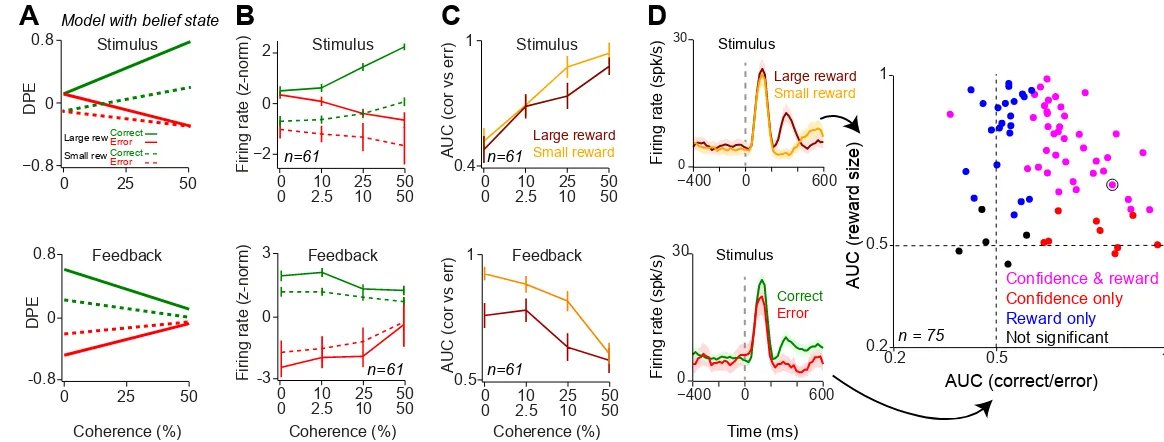
Until now, we focused on the large-reward side trials to isolate the contribution of the perceptual decision process to prediction error signals. Next, we investigated how the neuronal representation of decision confidence interacts with reward size. Therefore, we evaluated our model predictions after including both small- and large-reward trials (Experimental Procedures), and similarly, examined neuronal responses in all trials irrespective of the reward size. DPEs computed by the TDRL model with the belief state jointly reflected confidence estimates and expected reward size (Figure 5A). When rewards associated with left and right choices differ,
10
saccade direction (i.e. towards the side associated with small or large reward) and trial outcome (error or correct). The population neuronal responses were modulated by both decision confidence and reward size, resembling the DPE predictions (cf. Figure 5A and B) and showed marked differences from the prediction of a conventional TDRL model (Figure S5).
Next we sought to isolate the effect of decision confidence on dopamine responses irrespective of reward size. Therefore, we quantified the differences in responses between correct and errors trials by computing the area under the ROC curve (AUC). Confidence encoding predicts that the difference between cue-driven correct and error response increases with increasing stimulus coherence (Figure 5A), and hence the AUC measure should capture this trend [32]. Indeed, at the time of stimulus, AUC measures for both small and large reward conditions showed a significant positive relation with stimulus coherence (Figure 5C; linear regression of population AUC onto stimulus coherence: P < 0.001 for both small and large reward conditions). Similarly, at the time of feedback, AUCs for both reward conditions showed a significant inverse relation with stimulus coherence (Linear regression of population AUC onto stimulus coherence: P < 0.001 for both small and large reward conditions). Thus, for both small and large reward conditions, dopamine responses showed stronger outcome sensitivity (larger AUC) as stimulus coherence increased.
Finally, we examined the extent to which stimulus-driven responses reflected both decision confidence and reward size for each neuron. To quantify confidence and reward encoding independently, we compared the difference between responses for correct vs. error trials and for large vs. small reward trials using ROC analysis (Figure 5D, left panels). The majority of neurons encoded both decision confidence as well as upcoming reward size with similar strength (Figure 5D, right panel, ROC analysis with permutation test in 39/75 neurons, P < 0.01), while a fraction of neurons reflected only one variable reliably (9/75 outcome selective only, 22/75 reward size selective only, ROC analysis with permutation test, P < 0.01; for the sake of comparison a fixed time window, 220-500 ms, was used after the stimulus although the time course of encoding across neurons is variable, Figure 3B, 4B). Interestingly, neurons which only showed outcome selectively (9/75 neurons) did so while monkeys showed clear behavioral sensitivity to reward size manipulation in these sessions (P < 0.01, Mann-Whitney U test on estimated psychometric bias). Together, these analyses indicate that dopamine neurons compute prediction errors by taking into account both the expected reward size as well as the subjective belief about the correctness of a perceptual choice.
Discussion
11
role of the belief state is to represent the uncertainty arising from a perceptually ambiguous stimulus and enables a prediction about the probability that the stimulus categorization will be correct. In our decision task, this state inference process is equivalent to a computation of statistical decision confidence [9], as our analyses revealed (Figure 2a). In fact, the distinctive signatures of our belief-state-dependent TDRL model (Figure 1C-E, see Figure S2C), that are qualitatively different from a TDRL without belief-state (Figure 1F-H), are precisely those that have been used to identify decision confidence in the orbitofrontal and pulvinar neuronal responses as well as rodent and human confidence-reporting behavior [8, 32, 36, 37]. These similarities support the hypothesis that dopamine prediction error signals incorporate estimates of decision confidence during perceptual decision making. We emphasize that in our task monkeys were not trained to report their decision confidence, thus our results do not imply a neuronal correlate of confidence reporting behavior but rather reveal the neuronal representation of a signal that is consistent with the computation of decision confidence. In other words, we use the term confidence in a statistical sense, i.e. the probability that a choice is correct given the evidence [9, 31], and show that an RL model that reflects this computation accounts for dopamine responses under perceptual uncertainty.
Dopaminergic integration of decision confidence and reward value signals
Our perceptual decision task with an asymmetric reward schedule allowed us to dissociate two information sources for computing expected rewards and prediction errors: trial-by-trial estimates of reward probability and the history-dependent estimates of reward size. Thus, while our findings are fully consistent with the notion that dopamine responses reflect reward expectation, they reveal how reward expectations are formed based on uncertain sensory evidence. From this standpoint, our results agree with previous findings that dopamine responses integrate across all relevant reward dimensions to encode the subjective expected value of future rewards [21].
12
responses in relation to the computations underlying confidence and demonstrate that dopamine neurons perform confidence estimation simultaneously with reward size-dependent prediction error signaling. We suggest that dopamine responses in the vibrotactile detection task [25] can also be explained by our computational framework incorporating belief states, given that correct detection responses increase with increasing confidence in the sensory percept [38].
In another related study, Matsumoto and Takada [39] explored dopamine neuronal responses in a delayed match-to-sample visual search task and suggested that they reflected the monkey’s subjective judgment of success. Examining these neuronal responses in light of a model that estimates confidence in visual search success might reveal signatures of confidence coding in that study as well.
A unified framework for understanding dopamine in perceptual and reward history-guided tasks
From a computational perspective, it is straightforward to see that computing decision confidence is necessary for estimating the trial-by-trial value of a perceptual decision, which can be combined with reinforcement-based expected reward value for computing prediction errors. Therefore, our results are a natural extension of the well-established framework according to which dopamine neurons carry reward prediction signals. Reward prediction errors have been mostly studied in reward history-guided tasks where past outcomes are sufficient to compute the value of upcoming reward [3-6, 12, 14-16, 18-22]. Our findings thus provide an instance of a computational framework in which both reward history-guided and perceptual choices can be studied. Consistent with predictions of this framework, dopamine prediction errors reflected both past rewards as well as immediate belief about the outcome of sensory categorization, supporting the view that these neurons access a wider range of computations than previously thought [15, 16, 39, 40]. From this perspective, these results can serve as a bridge between reward history-guided and perceptually-guided decision making, which while both integral components of decisions in natural settings, have been mostly studied in isolation (but see [41-44]).
13
a full belief state for several reasons. Optimal processing in the face of perceptual uncertainty requires that sensory stimuli should be probabilistically represented. By representing the stimulus as a distribution, POMDPs offer the normative framework to cope with such uncertainty. This comes at the cost of only one additional variable, the belief state, but no additional parameters. As a consequence, this framework can be broadly applied. For instance, beliefs might have a non-Gaussian distribution, when Bayesian inference is used and the belief state is influenced by not only the external stimulus, but also by the statistics of the environment as reflected the Bayesian prior.
A previous modeling study suggested a neuronal network implementation of POMDP framework, focusing primarily on the computational reasons behind the extended time course of dopamine, as well as prediction errors in perceptual decision tasks of the type described here [30]. The model we developed is based on fundamentally similar ideas from machine learning for introducing perceptual ambiguity into the RL framework. Our approach was to generate several diagnostic predictions of the model, those that contrast it with a TDRL without a belief state, and test them against the activity of dopamine neurons. This approach enabled us to demonstrate that the main computational requirement necessary to account for dopamine responses under perceptual uncertainty is decision confidence. Statistical confidence explains the relation between the dopamine prediction errors, stimulus coherence and animal’s choice (Figure 3). This analysis also provides evidence against the interpretation that the difference in dopamine activity in correct/error trials reflects an attentional process, rather than decision confidence, because trials with different dopamine responses lead to different slopes of the psychometric function but comparable lapse rates (Figure 4). Finally, our model identifies the contribution of both reward size and confidence in shaping dopamine responses (Figure 5). As mentioned, the diagnostic predictions of our model do not depend on the specific way confidence is computed: confidence estimates based on the belief state of a POMDP or explicit confidence signals generated using frameworks such as evidence accumulation [7] or attractor models [45], when incorporated into a RL model, would yield similar predictions (Figure 2). Confidence models based on evidence accumulation have proven useful for explaining how neuronal responses in parietal cortex evolve over time to represent decision confidence [7]. In our implementation, we assumed that confidence estimation occurs as a discrete processing step, which appears consistent with the transient nature of dopamine responses observed here. Nevertheless it will be interesting to evaluate models where confidence estimation unfolds across time [7].
Implications for decision making
14
15 Experimental Procedures
Animal care and surgical procedures were in accordance with the U.S. National Institutes of Health Guide for the Care and Use of Laboratory Animals and with Tamagawa University guidelines for the use and care of laboratory animals in research.
Temporal difference reinforcement learning models
We used two variants of the temporal difference reinforcement learning (TDRL) model to simulate dopamine neuronal activity: a TDRL model incorporating a belief state that deals with the uncertainty it faces when performing the perceptual decision making and a TDRL model that did not have access to this belief state (‘alternative TDRL’). The basic features of the model implementation that were common among the model variants are described in the Supplemental Experimental Procedure.
We simulated the sequence of behavioral events in each trial as states, 𝑠. For our task, these states are ‘initial, ‘fixation cue’, ‘motion stimulus’, ‘feedback and ‘end’, denoted as 𝑠𝑖, 𝑠𝑓𝑐, 𝑠𝑚, 𝑠𝑓𝑏, 𝑠𝑒. In each state, the agent performs an action, 𝑎, observes an outcome and transits to the next state.
TDRL model with the belief state
Here we use a partially observable Markov decision processes (POMDP) formalism to deal with the uncertainty inherent in the random dot stimulus. Apart from ‘motion stimulus’ state, all other states are defined as fully observable and thus the same as in the previous section.
For the case of ‘motion stimulus’ state, due to the noisy nature of the stimulus, the agent has an imperfect knowledge about the true underlying state and represents it in a probabilistic manner. Motion stimuli ranged from -50% to 50% (50% of dots moving to left and right, respectively). We used a discrete form of these stimuli (21 different levels of motion coherence), i.e. -50%, -45% …, 0, …, 45%, 50%, corresponding to motion stimulus states 𝑠𝑚. We assume that due to the uncertainty inherent in the random dot stimulus, in each trial, subject does not directly observe
𝑠𝑚 but an internal noisy estimate of it which, in each trial, is sampled from a normal distribution with constant variance 𝜎2 around the true stimulus; that is 𝑆̂𝑚~𝒩(𝑠𝑚, 𝜎2). A subject’s belief about the stimulus comprises a belief distribution over all possible values of 𝑠𝑚; this distribution can be denoted by 𝑝(𝑠𝑚|𝑆̂𝑚). In our implementation, we discretized this belief distribution 𝑠̂𝑚: 𝑝(𝑠𝑚|𝑆̂𝑚) = 𝒩(𝑆̂𝑚, 𝜎2) and truncated it to values between – 50% and 50%.
16
Under this setting, given a belief 𝑝(𝑠𝑚|𝑆̂𝑚), the net value of actions L and R are computable as the expected values of 𝑄(𝑠𝑚, 𝐿) and 𝑄(𝑠𝑚, 𝑅) under the belief state, 𝑠̂𝑚: 𝑝(𝑠𝑚|𝑆̂𝑚):
𝑄𝑠̂𝑚(𝐿) = 〈𝑄(𝑠𝑚, 𝐿)〉𝑠̂𝑚 = ∑ 𝑝(𝑠𝑚|𝑆̂𝑚). 𝑄(𝑠𝑚, 𝐿) 𝑠𝑚∈{−50%,..,50%}
𝑄𝑠̂𝑚(𝑅) = 〈𝑄(𝑠𝑚, 𝑅)〉𝑠̂𝑚 = ∑ 𝑝(𝑠𝑚|𝑆̂𝑚). 𝑄(𝑠𝑚, 𝑅) 𝑠𝑚∈{−50%,..,50%}
Eq. 1
For action selection, we assume that the animal just chooses the action that has the highest value. That is 𝑎 = argmax
𝐴 𝑄𝑠̂𝑚(𝐴).
Upon observing the stimulus and selecting a choice, the prediction error is computed as:
𝛿𝑚 = 𝑄𝑠̂𝑚(𝑎) − 𝑉𝑓𝑐 Eq. 2
where 𝑉𝑓𝑐 is the expected value of reward during fixation cue presentation:
𝑉𝑓𝑐 =𝑄𝑠̂𝑚(𝐿) + 𝑄𝑠̂𝑚(𝑅) 2
Eq. 3
When the agent occupies the fixation cue state, the belief 𝑝(𝑠𝑚|𝑆̂𝑚) is a uniform distribution.
After performing action 𝑎 and receiving the reward feedback 𝑅, the prediction error is
𝛿𝑓𝑏 = 𝑅 − 𝑄𝑠̂𝑚(𝑎) Eq. 4
Based on this prediction error the Q-value of action 𝑎 will be updated as:
𝑄(𝑠𝑚, 𝑎) ← 𝑄(𝑠𝑚, 𝑎) + 𝛼. 𝛿𝑓𝑏. 𝑝(𝑠𝑚|𝑆̂𝑚), ∀𝑠𝑚 ∈ {−0.50%, . . ,0.50%}; Eq. 5
where 𝛼 is the learning rate.
Following learning, the prediction errors at different states of the task exhibit the patterns plotted in Figure 1B-E.
Model prediction errors and decision confidence
We now show by simulation that, in the context of our task, the probability that the choice turns out to be correct given the sensory evidence, i.e. the decision confidence, is qualitatively equivalent to prediction error at the motion stimulus state,
𝛿𝑚.
17
basis of 𝑝(𝑠𝑚|𝑆̂𝑚) is the same as the choice that would have been made on the basis of 𝑠𝑚. In other words, if the choice that would have been made on the basis of 𝑠𝑚 (i.e., by comparing 𝑄(𝑠𝑚, 𝑅) and 𝑄(𝑠𝑚, 𝐿)) was the same as 𝑎, that choice is considered correct, and otherwise incorrect:
𝑐𝑜𝑟𝑟𝑒𝑐𝑡(𝑎, 𝑝(𝑠𝑚|𝑆̂𝑚), 𝑠𝑚) = {1
𝑖𝑓 [ 𝑎 = 𝑅 𝑎𝑛𝑑 𝑄(𝑠𝑚, 𝑅) > 𝑄(𝑠𝑚, 𝐿) ] 𝑜𝑟 [ 𝑎 = 𝐿 𝑎𝑛𝑑 𝑄(𝑠𝑚, 𝑅) < 𝑄(𝑠𝑚, 𝐿) ]
0 𝑜. 𝑤.
Eq. 6
Having defined choice correctness for each possible 𝑠𝑚, we define confidence as the expected value of choice correctness, under the belief distribution 𝑠̂𝑚: 𝑝(𝑠𝑚|𝑆̂𝑚):
𝑝 (𝑐𝑜𝑟𝑟𝑒𝑐𝑡|𝑎, 𝑝(𝑠𝑚|𝑆̂𝑚)) = 〈𝑐𝑜𝑟𝑟𝑒𝑐𝑡(𝑎, 𝑝(𝑠𝑚|𝑆̂𝑚), 𝑠𝑚)〉𝑠̂𝑚 Eq. 7
where 〈. 〉𝑝 is the expectation operator under the distribution p. In other words:
𝑝 (𝑐𝑜𝑟𝑟𝑒𝑐𝑡|𝑎, 𝑝(𝑠𝑚|𝑆̂𝑚)) = ∑ 𝑝(𝑠𝑚|𝑆̂𝑚). 𝑐𝑜𝑟𝑟𝑒𝑐𝑡(𝑎, 𝑝(𝑠𝑚|𝑆̂𝑚), 𝑠𝑚) 𝑠𝑚∈{−50%,..,50%}
Eq. 8
Simulation of this equation indicates that, in our TDRL model with the belief state prediction errors reflect the probability that the choice will turn out to be correct, and thus implicitly reflect decision confidence (Figure 2A).
Note that tracking the full belief distribution, as normatively prescribed for efficient choice in more complex tasks requiring Bayesian updating, is not essential for our behavioral task. A reduced version of our POMDP model that uses the mean of the belief state to assign a single state, 𝑆̂𝑚, to the motion stimulus and arrive at a choice by comparing 𝑄(𝑆̂𝑚, 𝐿) and 𝑄(𝑆̂𝑚, 𝑅) (𝑎 = argmax
𝐴 𝑄(𝐴)) results in prediction error patterns similar to those of our full POMDP model (see Figure S2B).
To isolate the effect of decision confidence on model prediction errors, in Figure 1, we illustrate predictions of the model only in trials for which the agent choses the large reward side. To investigate the effect of decision confidence and reward size, in Figure 5, we illustrate the predictions of the model in all trials, independent of the reward size.
The alternative model
The alternative model introduces a case in which the dopamine system does not have direct access to the sensory evidence used for the decision process. In this model, the decision making system assign one state, 𝑆̂𝑚, to the motion stimulus and makes the choice by comparing 𝑄(𝑆̂𝑚, 𝐿) and 𝑄(𝑆̂𝑚, 𝑅) (𝑎 = argmax
18
of 𝑄(𝑆̂𝑚′, 𝐿) and 𝑄(𝑆̂𝑚′, 𝑅) for prediction error computation at the motion stimulus and feedback states (Figure S2A). As such, in this model, the state inference and choice computation are identical to the reduced POMDP (Figure S2B) but the model reflects the situation that the dopamine system does not have access to the sensory evidence used for choice.
Figure 1, illustrates predictions of the alternative model only in large-reward trials and Figure S5 illustrates the predictions of the model in all trials, independent of the reward size.
Analysis of the neuronal data
We analyzed only the trials in which the monkey made directional choices and thus we excluded trials in which the monkey broke fixation before the onset of the random dot motion stimuli. For analyses shown in Figure 3 and 4, we only included trials in which animals made a saccade towards large-reward side. This enabled us to isolate the neuronal representation of decision confidence independent of reward size. For analysis shown in Figure 5, we included all trials regardless of saccade direction, which allowed us to examine the effect of decision confidence and reward size on dopamine neuronal responses. Because testing predictions of our model requires both correct and error trials, in all our analysis, we included both types of trials.
All data analyses and modeling were performed using custom-made software coded with Matlab (MathWorks). Supplemental Experimental Procedure includes details of statistical analyses on neuronal responses.
Author Contributions
K.N. and M.S. designed and performed the experiment. A.L. and A.K. analyzed the data. A.L. and A.K. conceptualized the findings. A.L., M.K and A.K. constructed the models. A.L. and A.K. wrote the manuscript with comments from other authors.
Acknowledgements
19 References
1. Poole, S. (2016). 'Winning, winning, winning': the genius of The Donald’s Trumpspeak. The Guardian. Mar 4,
2. Sutton, R.S., and Barto, A.G. (1998). Reinforcement Learning: An Introduction, (MIT press).
3. Schultz, W., Dayan, P., and Montague, P.R. (1997). A neural substrate of prediction and reward. Science 275, 1593-1599.
4. Bayer, H.M., and Glimcher, P.W. (2005). Midbrain Dopamine Neurons Encode a Quantitative Reward Prediction Error Signal. Neuron 47, 129-141.
5. Nakahara, H., Itoh, H., Kawagoe, R., Takikawa, Y., and Hikosaka, O. (2004). Dopamine Neurons Can Represent Context-Dependent Prediction Error. Neuron 41, 269-280.
6. Cohen, J.Y., Haesler, S., Vong, L., Lowell, B.B., and Uchida, N. (2012). Neuron-type-specific signals for reward and punishment in the ventral tegmental area. Nature 482, 85-88.
7. Kiani, R., and Shadlen, M.N. (2009). Representation of Confidence Associated with a Decision by Neurons in the Parietal Cortex. Science 324, 759-764.
8. Kepecs, A., Uchida, N., Zariwala, H.A., and Mainen, Z.F. (2008). Neural correlates, computation and behavioural impact of decision confidence. Nature 455, 227-231. 9. Hangya, B., Sanders, J.I., and Kepecs, A. (2016). A Mathematical Framework for
Statistical Decision Confidence. Neural Comput 28, 1840-1858.
10. Schultz, W. (1998). Predictive reward signal of dopamine neurons. J Neurophysiol 80, 1-27.
11. Bromberg-Martin, E.S., Matsumoto, M., and Hikosaka, O. (2010). Dopamine in Motivational Control: Rewarding, Aversive, and Alerting. Neuron 68, 815-834.
12. Tobler, P.N., Fiorillo, C.D., and Schultz, W. (2005). Adaptive Coding of Reward Value by Dopamine Neurons. Science 307, 1642-1645.
13. Daw, N.D., and Doya, K. (2006). The computational neurobiology of learning and reward. Curr Opin Neurobiol 16, 199-204.
14. Morris, G., Nevet, A., Arkadir, D., Vaadia, E., and Bergman, H. (2006). Midbrain dopamine neurons encode decisions for future action. Nat Neurosci 9, 1057-1063. 15. Bromberg-Martin, E.S., Matsumoto, M., Hong, S., and Hikosaka, O. (2010). A
Pallidus-Habenula-Dopamine Pathway Signals Inferred Stimulus Values. J Neurophysiol 104, 1068-1076.
16. Takahashi, Y.K., Roesch, M.R., Wilson, R.C., Toreson, K., O'Donnell, P., Niv, Y., and Schoenbaum, G. (2011). Expectancy-related changes in firing of dopamine neurons depend on orbitofrontal cortex. Nat Neurosci 14, 1590-1597.
17. Lee, D., Seo, H., and Jung, M.W. (2012). Neural Basis of Reinforcement Learning and Decision Making. Annu Rev Neurosci 35, 287-308.
18. Bouret, S., Ravel, S., and Richmond, B.J. (2012). Complementary neural correlates of motivation in dopaminergic and noradrenergic neurons of monkeys. Front Behav Neurosci 6, 40.
19. Fiorillo, C.D. (2013). Two dimensions of value: dopamine neurons represent reward but not aversiveness. Science 341, 546-549.
20. Steinberg, E.E., Keiflin, R., Boivin, J.R., Witten, I.B., Deisseroth, K., and Janak, P.H. (2013). A causal link between prediction errors, dopamine neurons and learning. Nat Neurosci 16, 966–973.
21. Lak, A., Stauffer, W.R., and Schultz, W. (2014). Dopamine prediction error responses integrate subjective value from different reward dimensions. Proc Natl Acad Sci U S A 111, 2343-2348.
22. Stauffer, W.R., Lak, A., and Schultz, W. (2014). Dopamine reward prediction error responses reflect marginal utility. Curr Biol 24, 2491-2500.
20
24. Nomoto, K., Schultz, W., Watanabe, T., and Sakagami, M. (2010). Temporally Extended Dopamine Responses to Perceptually Demanding Reward-Predictive Stimuli. J Neurosci 30, 10692-10702.
25. de Lafuente, V., and Romo, R. (2011). Dopamine neurons code subjective sensory experience and uncertainty of perceptual decisions. Proc Natl Acad Sci U S A 108, 19767-19771.
26. Montague, P.R., Dayan, P., and Sejnowski, T.J. (1996). A framework for mesencephalic dopamine systems based on predictive Hebbian learning. J Neurosci 16, 1936-1947.
27. Kakade, S., and Dayan, P. (2002). Dopamine: generalization and bonuses. Neural Netw 15, 549-559.
28. Daw, N.D., Courville, A.C., and Touretzky, D.S. (2006). Representation and timing in theories of the dopamine system. Neural Comput 18, 1637-1677.
29. Dayan, P., and Daw, N.D. (2008). Decision theory, reinforcement learning, and the brain. Cogn Affect Behav Neurosci 8, 429-453.
30. Rao, R.P.N. (2010). Decision Making Under Uncertainty: A Neural Model Based on Partially Observable Markov Decision Processes. Front Comput Neurosci 4, 146. 31. Pouget, A., Drugowitsch, J., and Kepecs, A. (2016). Confidence and certainty:
distinct probabilistic quantities for different goals. Nat Neurosci 19, 366-374.
32. Lak, A., Costa, G.M., Romberg, E., Mainen, Z.F., Koulakov, A., and Kepecs, A. (2014). Orbitofrontal cortex is required for optimal waiting based on decision confidence. Neuron 84, 190-201.
33. Niv, Y., Daw, N.D., Joel, D., and Dayan, P. (2007). Tonic dopamine: opportunity costs and the control of response vigor. Psychopharmacology (Berl) 191, 507-520. 34. Beierholm, U., Guitart-Masip, M., Economides, M., Chowdhury, R., Duzel, E., Dolan,
R., and Dayan, P. (2013). Dopamine modulates reward-related vigor. Neuropsychopharmacology 38, 1495-1503.
35. Cohen, J.Y., Amoroso, M.W., and Uchida, N. (2015). Serotonergic neurons signal reward and punishment on multiple timescales. Elife 4, e06346.
36. Komura, Y., Nikkuni, A., Hirashima, N., Uetake, T., and Miyamoto, A. (2013). Responses of pulvinar neurons reflect a subject's confidence in visual categorization. Nat Neurosci 16, 749-755.
37. Sanders, J.I., Hangya, B., and Kepecs, A. (2016). Signatures of a Statistical Computation in the Human Sense of Confidence. Neuron 90, 499-506.
38. Hangya, B., Ranade, S.P., Lorenc, M., and Kepecs, A. (2015). Central Cholinergic Neurons Are Rapidly Recruited by Reinforcement Feedback. Cell 162, 1155-1168. 39. Matsumoto, M., and Takada, M. (2013). Distinct representations of cognitive and
motivational signals in midbrain dopamine neurons. Neuron 79, 1011-1024.
40. Sadacca, B.F., Jones, J.L., and Schoenbaum, G. (2016). Midbrain dopamine neurons compute inferred and cached value prediction errors in a common framework. Elife 5, e13665.
41. Whiteley, L., and Sahani, M. (2008). Implicit knowledge of visual uncertainty guides decisions with asymmetric outcomes. J Vis 8, 2 1-15.
42. Teichert, T., and Ferrera, V.P. (2010). Suboptimal integration of reward magnitude and prior reward likelihood in categorical decisions by monkeys. Front Neurosci 4, 186.
43. Rorie, A.E., Gao, J., McClelland, J.L., and Newsome, W.T. (2010). Integration of sensory and reward information during perceptual decision-making in lateral intraparietal cortex (LIP) of the macaque monkey. Plos One 5, e9308.
44. Summerfield, C., and Tsetsos, K. (2012). Building Bridges between Perceptual and Economic Decision-Making: Neural and Computational Mechanisms. Front Neurosci 6, 70.
21
46. Ding, L., and Gold, J.I. (2013). The basal ganglia's contributions to perceptual decision making. Neuron 79, 640-649.
47. Ding, L., and Gold, J.I. (2010). Caudate Encodes Multiple Computations for Perceptual Decisions. J Neurosci 30, 15747-15759.
48. Lewis, D.A., Melchitzky, D.S., Sesack, S.R., Whitehead, R.E., Auh, S., and Sampson, A. (2001). Dopamine transporter immunoreactivity in monkey cerebral cortex: regional, laminar, and ultrastructural localization. J Comp Neurol 432, 119-136.
49. Lloyd, K., and Dayan, P. (2015). Tamping Ramping: Algorithmic, Implementational, and Computational Explanations of Phasic Dopamine Signals in the Accumbens. PLoS Comput Biol 11, e1004622.
22 Figure Legends
Figure 1. Predictions of a temporal difference learning model that incorporates a belief state
(A) Schematic of a TDRL model incorporating a belief state for performing the random dot motion discrimination task (see Experimental Procedures and Figure S1). Having observed a noisy readout of the motion stimulus 𝑆̂𝑚, the model forms a belief, denoted by 𝑠̂𝑚: 𝑝(𝑠𝑚|𝑆̂𝑚), representing the probability distribution over all motion stimulus states, 𝑠𝑚 (red bars, for simplicity only six states are shown in the panel). The model also stores the values of taking a left or right action, given each possible state 𝑄(𝑠𝑚, 𝐿) and 𝑄(𝑠𝑚, 𝑅), respectively. On each trial, the value of left and right decisions are computed: 𝑄𝑠̂𝑚(𝐿) = 〈𝑄(𝑠̂𝑚, 𝐿)〉𝑠̂𝑚 and 𝑄𝑠̂𝑚(𝑅) = 〈𝑄(𝑠̂𝑚, 𝑅)〉𝑠̂𝑚 . The choice is made by comparing 𝑄𝑠̂𝑚(𝐿) and 𝑄𝑠̂𝑚(𝑅). The reward expectation associated with the choice (i.e. decision value) is 𝑄𝑠̂𝑚(𝑐ℎ𝑜𝑖𝑐𝑒). Upon receiving the outcome (small, large or no reward) the model computes the prediction error, 𝛿𝑚, the difference between the received reward size and the decision value. This prediction error, together with the belief state, is then used to update 𝑄(𝑠𝑚, 𝐿) and 𝑄(𝑠𝑚, 𝑅), which are used in the subsequent trials.
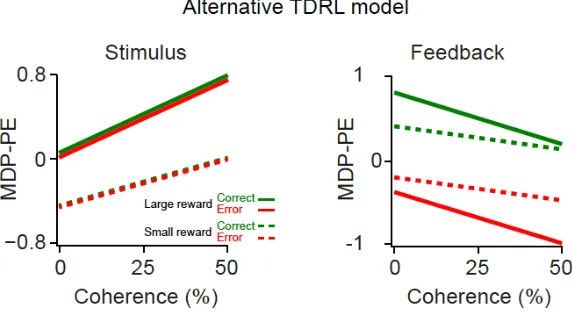
(B) Schematic of prediction error function of the TDRL model with belief state (top) and the alternative TDRL model (bottom), as a function of stimulus difficulty and decision outcomes (i.e. correct or error). DPE refers to decision value prediction errors for the model with a belief state, while MDP-PE stands for Markov Decision Process prediction error of the model without belief state. Unlike the model without the belief state, prediction errors at the time of stimulus in the model with the belief state reflect the decision outcome. Note that since some stimuli predict below average reward rates, the resulting prediction errors at the motion stimulus state can be negative.
(C-E) Properties of the TDRL model with belief state. The plots are from a model run with asymmetric reward sizes and in order to isolate the effect of belief on the model behavior, only trials with a choice toward the large-reward side are shown. Note that decision values depend on both belief and the reward size, hence for large-reward choices, DPEs take on slight positive values even for stimuli with close to zero coherence. See Figure S2 for additional predictions of this model.
(C) DPEs at the time of stimulus show dependency on both stimulus coherence and decision outcome. These prediction errors reflect subjective belief about the choice correctness.
23
(E) The model’s psychometric curves plotted separately for high and low DPEs at the time of stimulus (above and below 75th percentile, respectively). Trials with larger DPEs for the same stimulus coherence predict increased choice accuracy.
(F-H) as in (C-E) for a TDRL model without belief state. Note that both TDRL model with belief state and the alternative TDRL model have qualitatively similar predictions when only correct trials are taken into account. Thus, for comparing the two models, it is essential to include both correct and error trials. See Figure S2 for schematic of this model. See also Figures S1 and S2.
Figure 2. Prediction errors of the TDRL model with belief state reflect decision confidence
(A) The pattern of estimated decision confidence. The simulation of 𝑝(𝑐𝑜𝑟𝑟𝑒𝑐𝑡 | 𝑐ℎ𝑜𝑖𝑐𝑒, 𝑝𝑒𝑟𝑐𝑒𝑝𝑡) in this model shown as a function of stimulus coherence separately for correct and error choices (see Experimental Procedure). Note the similarity of these patterns with prediction errors in the belief-state TDRL model (cf. the panel with Figure 1C).
(B) Signal detection theory-inspired intuition illustrating the model’s predictions. For the same external stimulus, the distance between a percept s and the decision boundary b differs across trials (compare s1 and s2 for the difficult stimulus example and s3 and s4 for the easy stimulus example) leading to different confidence estimates (distance between the percept s, and the boundary b), as shown in the middle panel.
Figure 3. Dopamine responses reflect both stimulus difficulty and choice
(A) Top panels: Raster plots of an example dopamine neuron aligned to stimulus onset and feedback tone onset, which indicated the trial outcome (correct or error). For error trials of low stimulus coherence and all correct trials, only a fraction of trials (randomly selected) is shown. Bottom panels: pre-stimulus time histograms (PSTHs) of the example neuron aligned to different task events. In the PSTHs, trials with different stimulus difficulties were collapsed. Horizontal gray bars indicate temporal windows used for analyses in (C). For illustration purposes, in all figures, we treat stimuli of equal coherence together, regardless of motion direction. To isolate the effect of decision confidence on neuronal responses, only trials in which the monkey made a saccade to the large-reward side were included in all panels of this figure. See Figure S3 for neuronal responses to the fixation cue. Unless otherwise stated, in all figures error bars are s.e.m. across trials or neurons (for single neuron examples and population, respectively).
24
used for analyses in (D). Bottom panels: Running area under ROC curve (AUC) for each neuron aligned to different events (see Experimental Procedures). The AUCs significantly larger than 0.5 indicate larger dopamine responses in correct trial compared to the error trials. For illustration, AUCs in each panel are sorted based on the time of the first of three consecutive significant analysis time steps (P < 0.001).
(C) The average responses of the example dopamine neuron at the time of stimulus and feedback tone. These neuronal responses resembled the DPE of the TDRL model shown in Figure 1C and D.
(D) The population dopamine responses at the time of stimulus and feedback tone. These neuronal responses resembled the DPE of the TDRL model shown in Figure 1c and d and differed markedly from prediction errors of the alternative TDRL model shown in Figure 1F and G. See also Figure S3.
Figure 4. Dopamine activity predicts choice accuracy prior to behavioral response
(A) PSTH of an example neuron and the entire neuronal population aligned to saccade onset (i.e. the time in which the animal gaze left the central fixation). In the PSTHs, trials with different stimulus difficulties were collapsed. Horizontal gray bars indicate temporal windows used for analyses in B-D. Only choices towards the large-reward size were included in all panels of this figure.
(B) Left: Area under ROC curve (AUC) for the example neuron measured from pre-saccade dopamine responses (during 250 ms prior to pre-saccade initiation). At each stimulus coherence neuronal responses in correct and error trials were used to compute AUC. Right: running AUC for all neurons aligned to the saccade onset. For this analysis, trials from all tested coherence levels were collapsed and running AUC for each neuron was measured by comparing neuronal responses in each time bin of correct and error trials.
(C) Choice accuracy as a function of dopamine pre-saccade responses (measured for each neuron from responses during 300 ms before saccade initiation).
(D) Animals’ psychometric curves separated based on the pre-saccade dopamine responses (below and above 75th percentile, respectively). See also Figure S4.
Figure 5. Dopamine responses reflect both decision confidence and reward size.
25
(B) Population dopamine responses at the time of stimulus and feedback tone separated based on the reward size condition (small/large reward) as well as decision outcome (error/correct). Unlike Figure 3 and 4, all trials (irrespective of reward size condition) were included in all panels of this figure.
(C) Average AUCs of dopamine responses to stimulus and feedback tone for different reward conditions. The AUC of each individual neuron at each stimulus coherence level was measured by comparing neuronal responses in correct and error trials and were then averaged across neurons. For both small and large reward conditions neuronal AUCs increased at the time of stimulus (left) and decreased at the feedback time (right), as a function of stimulus coherence. These results remained statistically significant even when responses of all recorded cells are taken into account (Linear regression of population AUCs onto stimulus coherence; stimulus time: P = 0.03 and P = 0.000006, reward time: P = 0.04 and P = 0.007 for small and large reward conditions, respectively).
(D) Left: PSTHs of example dopamine neuron (same neuron shown in Figure 3) separated based on the upcoming reward size (i.e. reward size associated with the saccade direction, top panel) or based on the upcoming outcome (correct/error, bottom panel). These responses were used to measure area under ROC curve shown on the right. Right: scatter plot of AUCs measured for each neuron quantifying reward size coding and decision confidence coding for each individual neuron. For each neuron, the statistical significance was estimated using permutation test (see Experimental Procedures). Circled point indicates the example neuron shown on the left panels. See also Figure S5.
Supplemental Information
agent
environment
-50 -25 -10 10 25 50
p(state)
Stimulus belief state
% Coherence
Decision value
Prediction error
= Outcome - Decision valueChoice
><
Q(s,L)
Q(s,R)
Q (R)
Q (L)
p(s) p(s)Q (choice)
p(s)R
L
Correct
Error
Outcome
X
action
-50 -25 -10 10 25 50
% Coherence
0 25 50
−0.8 0 0.8 Coherence (%) DPE
C
Correct ErrorD
0 25 50
-0.8 0 0.8
Coherence (%)
DPE
0 25 50
−0.8 0 0.8 Coherence (%) MDP-PE Stimulus Correct Error
E
0 25 50
-1 0 1 Coherence (%) MDP-PE Feedback
Alternative TDRL
TDRL with belief state
F
G
H
0 25 50
0.5 1
Coherence (%) Accuracy High MDP-PE
Low MDP-PE Stimulus
Stimulus Feedback
0 25 50
0.5 1
Coherence (%) Accuracy High DPE
[image:27.595.57.557.62.403.2]b
b s
Difficult
stimulus stimulusEasy
0 100
Coherence (%)
Confidence
1
s2
4:6 1:9
b
b s3
s4
0 50
0.5 1
Coherence (%)
P(correct | choice,
percept)
A
Correct
Error
[image:28.595.145.534.54.198.2]B
Correct Error 0 25 10 50 0 10 25 50
0 10 25 50
Firing rate (spk/s)
Correct
Error
Stimulus
Coherence (%)
10
0 10 25 50
Feedback tone
16
2
−400−200 0 200400600
0 10 20 30
Firing rate (spk/s)
Correct
Error
Time (ms)
−300−100100 300 500
0 10 20 30 Correct Error Time (ms)
Stimulus Feedback tone
2 6 9
A
C
Coherence (%) Correct Error Time (ms) 10 20 30 40 50 60 70−400 −200 0 200 400600
1 0.5 0 0 4 8 12
Firing rate (spk/s)
B
n=75 Correct Error n=75 Correct ErrorStimulus Feedback tone
AUC
Neurons
−300−100100 300 500
Time (ms) 0 4 8 12 10 20 30 40 50 60 70 L7104 L7104
0 10 25 50
0
0 2.5 10 50
Stimulus
-1 2.5
Firing rate (z-norm)
D
Coherence (%) n=75 Correct Error Feedback tone0 10 25 50
0 2.5 10 50
[image:29.600.75.497.47.378.2]0.4 0.6 0.8 1.0 1.0 0.3 0.4 0.6 0.8 1.0 0.6 1.0 0.2 Monkey K Monkey L 0.5 1.0
0 10 50
0.5 1.0
0 10 25 50
Coherence (%)
Monkey K Monkey L
Normalized pre-choice rate Normalized pre-choice rate
Accuracy Accuracy
C
D
Coherence (%) 0.75 0.75 0 4 8 12 n=75 Correct Error Saccade Time (ms)−600−400−2000 200 400
0.65 10 20 30 40 50 60 70 0.95 0.5 0 0.4 0.6 0.8 1.0
0 10 25 50
Coherence (%) 0 4 8 12 Correct Error Saccade Time (ms)
−600−400−200 0 200 400
AUC
Outcome selectivity (AUC)
Neurons
Firing rate (spk/s)
A
B
Time (ms)−600−400−2000 200 400
K4201
K4201 n=40 n=35
n=40 n=35
[image:30.600.55.520.47.283.2]Pre-choice firing rate High Low
0 25 50 −0.8 0 0.8 DPE Correct Error
0 25 50
-0.8
0
0.8
Coherence (%)
DPE
Model with belief state
Stimulus Feedback Large rew Correct Error −2 0 2
Firing rate (z-norm)
-3 0 3 Coherence (%) Stimulus Feedback
Firing rate (z-norm)
0 10 25 50 0 2.5 10 50
0 10 25 50 0 2.5 10 50
n=61
n=61
A
B
0.4
1 Stimulus
0 10 25 50 0 2.5 10 50
n=61
C
0.5
1
Coherence (%)
AUC (cor vs err)
Feedback
0 10 25 50 0 2.5 10 50
n=61
−4000 0 600
30
Firing rate (spk/s)
Correct Error
Time (ms)
−4000 0 600
30
Firing rate (spk/s)
Large reward Small reward
Stimulus
Stimulus
AUC (reward size)
D
0.2 0.5 1
0.2 0.5
1
Confidence & reward
Confidence only Reward only Not significant AUC (correct/error) Large reward Small reward
n = 75
[image:31.600.3.585.49.270.2]Supplemental Figures
Figure S1. Monkeys’ decisions reflect both stimulus difficulty and reward magnitude (Related to Figure 1).
(A) Monkeys’ psychometric curves separated based on the response side to which the large reward magnitude was assigned. Animals could categorize easy random dot motion stimuli almost perfectly and were challenged with more difficult stimuli. Moreover, monkeys tended to respond in the direction associated with the large juice reward. Dots indicate data averaged across all testing sessions. Thick lines represent logistic fits to the data. Both animals showed significant bias towards the side with larger reward (p < 0.05, in both animals, permutation test). In all panels, error bars are s.e.m. across test sessions.
(B) Choice reaction time. The saccadic reaction times were z-normalized and separated based on motion coherence (its absolute value) and saccade direction (to the side associated with large or small reward). Monkeys showed faster reaction times when making saccade to the side associated with the larger reward (compare dashed lines with solid lines). Moreover, animals’ reaction times were modulated by stimulus difficulty and decision outcome (i.e. correct or error) in a manner consistent with predictions of the TDRL model with belief state.
Figure S2. Schematic of the alternative model and the reduced POMDP model and additional predictions of the main TDRL model (Related to Figure 1).
(A) In this model, the decision making system assign one state, 𝑆̂𝑚 (shown in orange), to the motion
stimulus and makes the choice by comparing 𝑄(𝑆̂𝑚, 𝐿) and 𝑄(𝑆̂𝑚, 𝑅) (𝑎 = argmax
𝐴 𝑄(𝐴)). Since the
dopamine system does not have direct access to the sensory evidence used for choice, it assigns another state, 𝑆̂𝑚′ (shown in purple), to the motion stimulus, which could be identical to different from the one used for choice,𝑆̂𝑚. The larger Q-value (𝑄(𝑆̂𝑚′, 𝐿)or𝑄(𝑆̂𝑚′, 𝑅)) is used for prediction error computation.
The dopamine prediction error patterns of this model are shown in Figure 1F-H.
(B) Schematic of the reduced POMDP model. This model does not include a full belief state but uses the mean of the belief state to assign a single state 𝑆̂𝑚 to the motion stimulus and perform choice by
comparing 𝑄(𝑆̂𝑚, 𝐿) and 𝑄(𝑆̂𝑚, 𝑅)(𝑎 = argmax
𝐴 𝑄(𝐴)). The prediction error patterns are similar to those
of our full POMDP model (see Figure 1C-E). Such a reduced model could achieve what the full POMDP achieves in one trial, over many of trials.
Figure S3. Dopamine responses to the fixation cue do not predict reaction times (Related to Figure 3).
(A) Dopamine population responses to the fixation cue. The black horizontal bar indicates the temporal window used for the analysis shown in (B) and (C).
(B) Dopamine responses to the fixation cue plotted as a function of z-scored fixation reaction time. In each panel of the figure, the line shows single linear regression on the population responses.
(C) Dopamine responses to the fixation spot as a function of z-scored choice reaction time.
Figure S4. Pre-choice dopamine responses do not predict reaction times and fixation or pre-stimulus dopamine responses do not predict choice accuracy (Related to Figure 4).
(A) Animals’ saccadic reaction times separated based on the pre-saccade dopamine responses (below and above 75th percentile, respectively).
(B) Choice accuracy as a function of dopamine responses to the fixation cue (below and above 75th percentile, respectively) computed separately for the two monkeys.
[image:35.595.153.438.80.606.2]