City, University of London Institutional Repository
Citation
:
Bernal, O.D., Seat, H.C., Zabit, U., Surre, F. & Bosch, T. (2016). Robust
Detection of Non-Regular Interferometric Fringes From a Self-Mixing Displacement Sensor
Using Bi-Wavelet Transform. IEEE Sensors Journal, 16(22), pp. 7903-7910. doi:
10.1109/JSEN.2016.2599702
This is the accepted version of the paper.
This version of the publication may differ from the final published
version.
Permanent repository link:
http://openaccess.city.ac.uk/17226/
Link to published version
:
http://dx.doi.org/10.1109/JSEN.2016.2599702
Copyright and reuse:
City Research Online aims to make research
outputs of City, University of London available to a wider audience.
Copyright and Moral Rights remain with the author(s) and/or copyright
holders. URLs from City Research Online may be freely distributed and
linked to.
City Research Online:
http://openaccess.city.ac.uk/
[email protected]
Robust Detection of Non Regular Interferometric
Fringes from a Self-Mixing Displacement Sensor
using Bi-Wavelet Transform
Olivier D. Bernal, Member, IEEE, Han Cheng Seat, Member, IEEE, Usman Zabit, Member, IEEE,
Fr´ed´eric Surre, Member, IEEE, and Thierry Bosch, Senior Member, IEEE
Abstract—An innovative signal processing method based on custom-made wavelet transform (WT) is presented for robust detection of fringes contained in the interferometric signal of Self-Mixing (SM) laser diode sensors. It enables the measurement of arbitrarily-shaped vibrations even in the corruptive presence of speckle. Our algorithm is based on the pattern recognition capability of bespoke WTs for detecting SM fringes. Once the fringes have been correctly detected, phase unwrapping methods can be applied to retrieve the complete instantaneous phase of the SM signals. Here, the novelty consists in using two distinct mother waveletsΨr(t) andΨd(t) specifically designed to distinguish SM
patterns as well as the displacement direction. The peaks, i.e. maxima modulus of WT, then allow the detection of the fringes.
Index Terms—Wavelet Transform, Self-Mixing interferometry, Speckle, Fringe Detection, Displacement Sensor
I. INTRODUCTION
S
ELF-MIXING or optical feedback interferometry has been regularly used for metrological applications during the last two decades as it enables a simple, compact, self-aligned, and low-cost sensor to be achieved [1], [2]. SM effect occurs in a laser when a fraction of the beam is backscattered by a target into the laser cavity to cause interference with the emitted beam, thus modifying the spectral properties of the laser [3], [4]. For displacement sensing, the modified optical output power (OOP) of the laser diodeP(t) can be processed, in a manner similar to classical interferometry, by applying the following two steps: fringe detection and phase unwrapping [5].There has been continuous interest to propose various phase unwrapping methods, principally under stable optical feedback coupling, providing varying degrees of measurement precision ranging from λ/8 to λ/40 [5]–[10]. However, such results can never be attained unless individual fringe detection is correctly carried out. Thus, the apparently simple task of fringe detection plays a fundamental role in the success of phase unwrapping methods. In fact, its correct execution cannot be guaranteed if stable optical feedback coupling is not ensured, a condition which becomes unavoidable for practical sensing applications.
O. Bernal, HC. Seat and T. Bosch are with the LAAS-CNRS, Universit´e de Toulouse, CNRS, INPT, Toulouse, France. e-mail: [email protected].
U. Zabit is with the Riphah International University, Islamabad, Pakistan. F. Surre is with the School of Mathematics, Computer Science and Engineering, City University London, United Kingdom
Manuscript received XXXXX, 2016; revised XXXX.
0 2500 5000 7500 10000
−4 −2 0 2 4
Amplitude (µm)
0 2500 5000 7500 10000
−1 0 1
0 2500 5000 7500 10000
−1 0 1
0 2500 5000 7500 10000
−1 0 1
0 2500 5000 7500 10000
−1 0 1
0 2500 5000 7500 10000
−1 0 1
SM amplitude [au]
Time [au]
(b)
(c)
(d)
(e)
[image:2.595.320.558.262.532.2](f) (a)
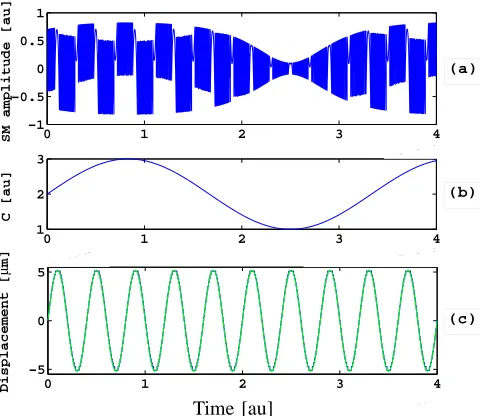
Fig. 1. Simulated SM signals obtained for a sinusoidal displacement (a) with
α= 4andλ=785 nm for differentCfactors: (b) 0.2, (c) 0.6, (d) 1, (e) 1.5, (f) 2.5; showing the effect ofCon the shape and amplitude of the fringes.
This difficulty resides in the complex nature of SM in-terferometric signals whose shape and amplitude [11], [12] are a function of the optical feedback coupling factor C as well as the laser diode (LD) linewidth enhancement factor
α [13]–[16]. Robust fringe detection for such a rich variety of SM signals is thus necessary for a practical SM sensor as significant variations in the target reflectivity Rt and the distance to the target D(t)cannot be avoided for real-world applications.
The strength of the C factor [14] has a determining role in SM interferometry and generally manifests itself as distinct operating regimes, of which three of the most significant are briefly summarized below [16]:
• 0.1 < C < 1: weak optical feedback regime with
asymmetric SM fringes devoid of discontinuities [17].
• 1 < C < 4.6 : moderate optical feedback regime with
• 4.6< C : strong optical feedback regime that ultimately
leads to a chaotic SM signal [12], [16], [18].
The effect ofCon the shape and amplitude of the SM signal fringes is highlighted in Fig. 1 through the SM behavioral model [12]. Subsequently, each SM regime would require spe-cific signal processing for accurate displacement retrieval [19]. Nonetheless, if the optical feedback regime could be controlled then the moderate feedback regime is generally preferred for displacement sensing as its supposedly straightforward signal shape [5], [11] leads to simplified signal processing [8]. However, such a regime cannot always be obtained and/or maintained, especially outside laboratory conditions.
Further, in the case of non-cooperative target surface and long displacement range, the occurrence of the speckle phe-nomenom can additionally affect the SM signals since speckle depends on the target surface roughness, the laser spot size as well as the laser wavelength λ [20], [21]. Consequently, speckle can not only induce SM signal amplitude fading but can also engender a change in the C factor (e.g. from weak to moderate or vice versa [21]).
Hence, robust SM fringe detection is essential for practical SM displacement sensing systems. In this regard, different methods have previously been proposed. Techniques based on envelope tracking and adaptive threshold scheme [21] were shown to improve the robustness of displacement reconstruc-tion but in some cases, fringes might not be detected. A Hilbert transform-based algorithm [22] was then proposed to extract the instantaneous SM phase. Nevertheless, it cannot inherently determine the target direction and sub-wavelength displacements could be wrongly interpreted. Wavelet Trans-from (WT) [23] was also shown to be an efficient way to analyze SM signals as non-stationary signals. However, such approaches were hitherto based on available mother wavelets. Consequently, differential and evolutionary algorithms [24] were necessary to detect the fringes, but at a cost of significant computational requirements. More recently, a method based on the Morlet complex wavelet has been proposed [25] to detect the fringes and changes in displacement direction as well as to remove parasitic noise more efficiently. However, this method has been developed for C values lower or close to 1. Further, even if such a method is more robust against speckle, the processing decision on the displacement direction could be misled by speckle and by the kind of displacement to be measured as it is indirectly inferred by the presence of dips in the generated envelope detection.
Thus, in this context, it will be shown in this paper that the robustness of fringe detection can be enhanced by the use of dedicated mother wavelets specifically defined for SM signals. It not only 1) improves fringe detection and 2) intrinsically determines displacement direction but also 3) greatly alleviates the computational requirements. The following sections are devoted to detailing the signal processing scheme, simulation and experimental results to demonstrate our method for an SM displacement sensor.
II. SIGNALPROCESSING
For a better understanding of the algorithms typically used to retrieve the target displacement from SM signals, the theory
D(t) Focusing
Lens
Laser Diode Photodiode
Laser Package
PZT
[image:3.595.323.552.107.220.2]P(t)
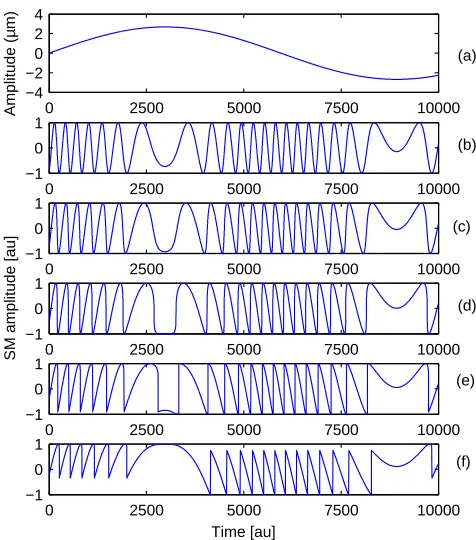
Fig. 2. Self-Mixing displacement sensor set-up with a piezoelectric transducer (PZT) used as a target
of SM interferometry is briefly detailed below [3], [26]. For the sake of clarity, the classical SM experimental setup is shown in Fig. 2.
A. SM Interferometry and Displacement Retrieval
LetD(t)represent the instantaneous distance between the LD driven by a constant injection current and a remote surface that back-scatters a small amount of optical power into the LD cavity.
When this optical feedback phenomenon occurs, the LD wavelength is no longer a constantλ0 but is slightly modified
to become a function of timeλF(t)varying with D(t). The wavelength fluctuations can be found by solving the phase equation [4]:
Φ0(t) = ΦF(t) +C sin [ΦF(t) + arctan (α)] (1) where ΦF and Φ0 represent two phase signals (subject to
feedback and under free running conditions, respectively) and are directly related to D(t). Then, as a function of the wavelengthsλF(t)andλ0:
ΦF(t) = 2π
D(t)
λF(t) 2
= 2πνF(t)τ(t)
Φ0(t) = 2π
D(t)
λ0 2
= 2πν0(t)τ(t) (2)
whereτ(t) = 2D(t)/cis the round-trip time andcthe speed of light. νF(t) andν0 represent the optical frequencies with
and without optical feedback, respectively.
The value of ΦF(t) can then be extracted from the OOP of the LDP(t)using:
P(t) =P0{1 +mcos [ΦF(t)]} (3) whereP0is the emitted LD power under the free running state
and m a modulation index [16]. Via ΦF(t),Φ0(t) can first
be retrieved using the nonlinear equation (1) followed by the vibration displacement as shown in [5].
0 0.2 0.4 0.6 0.8 1 −1
−0.5 0 0.5 1
A
m
p
li
tu
d
e
[n
o
rm
al
iz
ed
]
Time [normalized]
(a) Adapted WaveletΨr
0 0.2 0.4 0.6 0.8 1 −1
−0.5 0 0.5 1
A
m
p
li
tu
d
e
[n
o
rm
al
iz
ed
]
Time [normalized]
(b) Adapted WaveletΨd
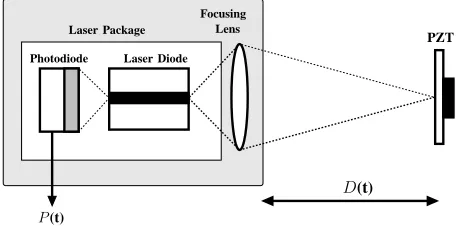
Fig. 3. Original Pattern based on SM rising (a) and decreasing (b) fringe obtained forC=1.5 andα=4 (solid blue line) and its Adapted WaveletsΨr
(a) andΨd(b) (dashed green line)
which ensures a displacement precision of λ/2. Subsequently, further processing (i.e. unwrapping of phase) can be employed to achieve more accurate measurements.
B. Wavelet transform and non-stationary signals
Contrary to Fourier Transform, WT can provide information on spectrum changes with respect to time [27]. Hence, WT are better suited to analyze non-stationary signals. The wavelet transform decomposes the signal into different scales with different levels of resolution by dilating a single function named the mother wavelet Ψ. The definition of the wavelet transform of a signalf(t)is as follows:
W f(s, t) =f(t)∗Ψs=
1
√
s Z ∞
−∞
f(u) Ψ
t−u
s
du (4)
where W f(s, t) is the wavelet transform coefficent, Ψ the mother wavelet and s the scale parameter which provides information regarding the signal frequency.
For the detection of singularities with WT, the technique based on the modulus maxima can be used [27]. Here, the singularities to be detected are the SM fringes. Various mother wavelets can be used to analyze SM signals such as the symlet and Daubechies wavelets. However, different results will be obtained depending on the mother wavelet used [23].
C. Proposed Bi-wavelet transform approach
Instead of detecting singularities, it is also possible to assess the similarity between a signal and a given pattern and hence to perform pattern recognition. Scalar products are often used to estimate the similarity between two signals [28]. Therefore, WT can also be used for pattern recognition as WT performs
0 0.05 0.1 0.15 0.2 0.25 0.3 0.35 0.4 0.45 0.5 0
2 4 6
Displacement [
µ
m]
0 0.05 0.1 0.15 0.2 0.25 0.3 0.35 0.4 0.45 0.5 −1
−0.5 0 0.5 1
SM Amplitude [au]
0 0.05 0.1 0.15 0.2 0.25 0.3 0.35 0.4 0.45 0.5 0
1 2 3 4
Max |
Ψr
|[au]
Time [s]
(a)
(b)
(c)
Fig. 4. Simulated SM signal (b) obtained for the displacement (blue solid line (a)) forC=1.5,α=4 andλ=785 nm. The modulus maxima coefficient obtained by theΨr WT of the SM signal (c) allows fringe counting and
displacement reconstruction with a precision ofλ/2 (red dashed line (a)).
scalar products of f(t) with √1sΨ t−su (see eq. (4)). In
addition, WT has efficient computational implementations and allows to estimate the correlation not only with the pattern itself but also with its scaled versions, as well as the time locations of possible maximum similarity (see eq. (4)) [29].
Consequently, in order to obtain more accurate information on the SM signal, we have designed dedicated mother wavelets which are bespoke for SM signals [29].
Since WT inherently computes the cross correlation along the scales between the mother wavelet and the input signal, so if the mother wavelet is defined to look like an SM fringe, then it can lead to better results as it will address more specific singularities. As a result, a typical SM signal’s rising fringe obtained for C=1.5 and α=4 (solid blue line in Fig. 3a) can be first used as the specific pattern. The α value has been chosen accordingly to the laser used in the experiments. Then, by using the MatlabR wavelet toolbox, this pattern can be transformed into an adapted waveletΨr (dashed green line in Fig. 3a). Once such a wavelet has been defined, SM fringes can be detected by applying theΨr WT (Fig. 4). Similar to [22], [25], an add-on routine should be then used to determine the displacement direction in order to reconstruct the displacement with a precision ofλ/2 (Fig. 4 (a)).
However, as SM fringes for weak and moderate regimes are not symmetric for to-and-fro motion of the target [11] (Fig. 1 and 4 (b)), it is thus of interest to define not just one but in fact two mother wavelets. The use of two distinct mother wavelets not only provides a better sensitivity in fringe detection but also greatly improves discrimination of the target movement direction in a intrinsic manner as will be shown later.
[image:4.595.99.233.112.356.2] [image:4.595.321.555.117.339.2]0 0.05 0.1 0.15 0.2 0.25 0.3 0.35 0.4 0.45 0.5 0
2 4 6
Displacement [
µ
m]
0 0.05 0.1 0.15 0.2 0.25 0.3 0.35 0.4 0.45 0.5 −1
−0.5 0 0.5 1
SM Amplitude [au]
0 0.05 0.1 0.15 0.2 0.25 0.3 0.35 0.4 0.45 0.5 0
1 2 3 4 5
Max [au]
Time [s]
(b) (a)
(c)
[image:5.595.332.536.79.375.2]env(Ψr) env(Ψd)
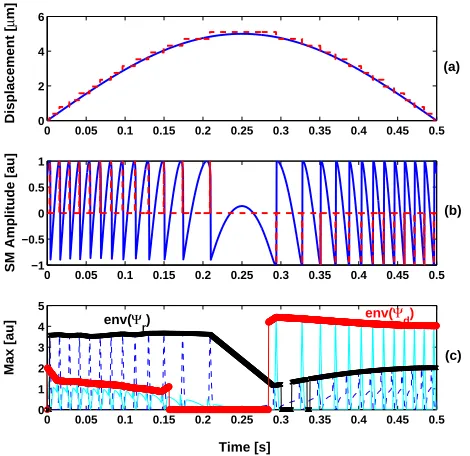
Fig. 5. Simulated SM signal (b) (blue solid line) obtained for the displacement (blue solid line (a)) forC=1.5,α=4 andλ=785 nm, and the detected fringes (red dashed line). The maxima coefficient are obtained by theΨr(blue dashed
line) andΨd(cyan solid line) wavelet transform of the SM signal (c). The
envelope for both maxima (black x line forΨrand red o line forΨd) allows
then fringe counting and displacement reconstruction with a precision ofλ/2 (red dashed line (a)).
decreasing SM fringe (see Fig. 3b). Note that the chosen fringe shapes are associated withC=1.5. This value has been chosen as our SM sensor autofocus system is designed to achieve SM signals with C close to 1.5 [8]. The functions
Ψr andΨd can be considered to be wavelets as such:
Z ∞
−∞
Ψr,d(t)dt = 0 (5)
Z ∞
−∞
|Ψr,d|2(t)dt < ∞ (6) As in [30], the maxima are selected by fixing a threshold based on the signal-to-noise ratio (SNR) of the signal mod-ulus. Finally, a separate tracking envelope of those maxima calculated for each mother wavelet is used to distinguish the maxima into corresponding rising or decreasing fringe patterns (Fig. 5). The proposed approach can be summarized by the schematic block diagram shown in Fig 6.
III. SIMULATION
Simulations are performed to evaluate the intrinsic perfor-mances of the proposed method in terms of:
• its ability to determine the displacement direction • its application range as a function ofC
• its robustness regarding additive noise
The following simulations are then performed with 32 scales for the wavelets for a 785 nm LD wavelength andα= 4.
A. Displacement Direction
The ability of the proposed bi-WT method to determine the displacement direction is based on the inherent asymmetry
SM signalf(t)
Ws,rf(s, t) Ws,df(s, t)
Max(Ws,rf(s, t)) Max(Ws,df(s, t))
>
Peak and Direction Detection Positive Positive
envelope envelope
Fig. 6. Schematic block diagram of the Peak detection method based on the Bi-wavelet transform
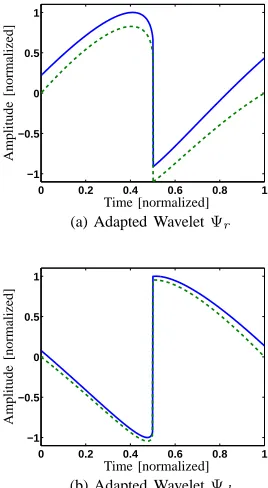
of the SM fringes: shape of the mother wavelet and sign of the discontinuity. In addition, the wavelet transform allows to analyze changes on different scales by dilations and contrac-tions through the scaling of the mother wavelet (eq. 4). As the instantaneous frequency of the SM signal fringes is directly related to both the amplitude and velocity of the displacement to be measured, a linear accelerated displacement has been used to assess the ability of the bi-WT approach to correctly determine the displacement direction. If the positive envelope obtained byΨr(Ψd) is greater thanΨd (Ψr), then the target is moving away from (toward) the laser. Figs. 7 and 8 show that the waveletsΨrandΨd can distinguish between a target displacement away and toward (with an increasing speed) from the interrogating LD respectively. Note also that as the velocity of the target increases, both envelopes seem to converge. This can be explained by a reduced number of samples per fringe (SPF) for high-velocity displacement. The minimum required has been determined to be 27 by simulations.
B. Determination of theC Range
[image:5.595.58.293.116.344.2]0 0.05 0.1 0.15 0.2 0.25 0.3 0
1 2 3 4
Displacement [mm]
0 0.05 0.1 0.15 0.2 0.25 0.3 0
1 2 3 4
env(max(WT
Ψ
)) [au]
Time [s] env(Ψr)
env(Ψ
d)
(a)
(b)
[image:6.595.57.293.119.340.2]200µm.s−1 20 mm.s−1
Fig. 7. Simulated target displacement (a) away from the laser at an increasing speed (from 200µm.s−1to 20 mm.s−1) forC=1.5,α=4 andλ=785 nm,
and (b) calculated envelope of the maximum coefficient usingΨr(red) and
Ψd(magenta).
0 0.05 0.1 0.15 0.2 0.25 0.3 −4
−3 −2 −1 0
Displacement [mm]
0 0.05 0.1 0.15 0.2 0.25 0.3 0
1 2 3 4 5
env(max(
Ψ
)) [au]
Time [s]
(a)
(b) env(Ψ
d)
env(Ψr)
-200µm.s−1 -20 mm.s−1
Fig. 8. Simulated target displacement (a) toward the laser at an increasing speed (from 200µm.s−1to 20 mm.s−1) forC=1.5,α=4 andλ=785 nm,
and and (b) calculated envelope of the maximum coefficient usingΨr (red)
andΨd(magenta).
as the maximum coefficients obtained for Ψr and Ψd are similar in values (Fig. 9 (d)). This results in reconstruction errors (Fig. 9 (e)). For the very weak optical feedback regime, the fringe asymmetry is almost non-existent (resulting in sinusoidal shaped fringes, similar to classical interferometry), which can explain the fact that the bi-WT method cannot determine the displacement direction for very smallCvalues. However, similar coefficient maxima of the bi-WT forΨrand
0 0.01 0.02 0.03 0.04 0.05 0.06 0.07 0.08 0.09 0.1 0
200 400
Displacement [
µ
m]
0 0.01 0.02 0.03 0.04 0.05 0.06 0.07 0.08 0.09 0.1 0
0.51 1.52 2.53 3.54
C [au]
0 0.01 0.02 0.03 0.04 0.05 0.06 0.07 0.08 0.09 0.1 −1
0 1
P(t) [au]
0 0.01 0.02 0.03 0.04 0.05 0.06 0.07 0.08 0.09 0.1 0
2 4
env(max(
Ψ
)) [au]
0 0.01 0.02 0.03 0.04 0.05 0.06 0.07 0.08 0.09 0.1 0
5 10
Error [mm]
Time [s]
(a)
(b)
(d)
(e) (c)
env(Ψr)
env(Ψd)
[image:6.595.319.555.122.402.2]C=0.06 C=1.5
Fig. 9. Simulated SM signalP(t)(c) for a linear target displacement away from the laser of 400µm (a) and a C shift from [0.01:4] withα=4 and
λ =785 nm (b). The maximum coefficients using Ψr (black x) and Ψd
(green o) are reported in (d) while the displacement reconstruction error is displayed in (e).
Ψd can not only be obtained for C <0.1 but also for target displacement much smaller thanλ/2. These zones cannot thus be processed by the proposed method. Nevertheless, the bi-WT can identify and flag such zones so that the enclosed information may be subsequently further processed.
It is, however, to be noted that the envelope of the maxima coefficients is reached forCvalues close to 1.5, as expected. This additionally illustrates that our technique is not just confined to the moderate feedback regime but can also be applied to an extended operating range, which is a requirement to process SM signals affected by speckle [21].
Further, the robustness of the approach under the influence of speckle has also been tested. Fig. 10 shows a simulated SM signal with an amplitude which is caused to vary over a factor of 8.Cis also varied simultaneously within the range of 1 to 3 (Fig. 10 (b)). The correct detection of all SM fringes contained in this signal then demonstrates that our method can reliably reconstruct the target displacement even in the presence of significant amplitude and C value variations, a combination regularly encountered in signals corrupted by speckle.
C. Noise performance
[image:6.595.59.294.412.635.2]0 1 2 3 4
x 104
−1 −0.5 0 0.5 1
SM amplitude [au]
0 1 2 3 4
x 104
1 2 3
C [au]
0 1 2 3 4
x 104
−5 0 5
x 10−6
Displacement [
µ
m]
(a)
(b)
(c)
[image:7.595.313.539.112.278.2]Time [au]
Fig. 10. Simulated SM signal affected by speckle but without noise (a) with
Cranging from 1 to 3 (b),α=4 andλ=785 nm. Reconstructed displacement (c) obtained by fringe counting (blue line) and target displacement (green line)
0 1 2 3 4 5 6 7 8
x 104
−2 −1 0 1 2
Self−Mixing
Optical Power (au)
0 1 2 3 4 5 6 7 8
x 104
−5 0 5
x 10−6
TIME (au)
Displacement (
µ
m)
(a)
(b)
(c) Time [au]
4.5 5 5.5
x 104 −1
0 1 2 3 4 5
Time (au)
Amplitude (au)
max(Ψ
r)
max(Ψ
d)
Peaks
SM signal
Fig. 11. (a) Simulated noisy modulated SM signal (black line) withC=0.6,
α=4 and λ =785 nm. (b) Reconstructed displacement based on fringe counting (blue line) using bi-WT compared to the original displacement (green line). (c) Zoom showing the fringe detection mechanism based onΨr(t) and
Ψd(t). Black dashed line: SM signal (without noise and modulation) added
for clarity
SNR is required to process a signal having lower C values. This relationship can again be understood for the same reason
A
m
p
li
tu
d
[image:7.595.58.298.122.330.2]e
Fig. 12. Zoom showing the fringe detection mechanism based on a reverse biorthogonal mother waveletΨrbioand the modulus maxima method applied
on the SM signal of Fig. 11. In red and green dashed lines, two possible threshold positions introducing fringe detection errors.
already explained in the first paragraph of section III-B.
TABLE I
REQUIREDSELF-MIXINGSIGNALSIGNAL-TO-NOISERATIO(SNR)
VERSUSC
C 0.2 0.4 0.6 0.8 1 1.2 1.5 2 SNR (dB) 34 24.5 20 20 20 19.5 17 15.5
To illustrate the capability of our bi-WT method, our algorithm was employed to accurately retrieve displacement information from a simulated noisy target movement with an SM sensor operating at a lowC value. Fig. 11 clearly shows that Ψr(t) andΨd(t) are particularly adapted to rising and decreasing fringes respectively.
Further, Fig.12 shows the WT of the same SM signal (as in Fig. 11 c)) using only one standard reverse biorthogonal mother waveletΨrbio. Compared with the proposed approach, it is much more complicated to discriminate the relevant sin-gularities using the modulus maxima approach. For instance, if the red dashed line in Fig. 12 is defined as the threshold, then 6 false rising-fringes are detected. On the contrary, if the green dashed line is used as the threshold, then one decreasing-fringe is not detected. Therefore, using two custom-made wavelets not only allows an inherent detection of the displacement direction but also provides a robust method to discriminate the relevant peaks.
IV. EXPERIMENTS ANDDISCUSSION
To experimentally validate our bi-WT method, an optical setup similar to [8] has been employed based on an optical casing containing both the ARTIC 39N0 liquid lens from VariopticR and a collimation lens. The LD used in the SM sensor, driven by a constant injection current of 30 mA and a maximum output power of 50 mW, is a Hitachi HL7851G emitting at 785.86 nm. The variations in the OOP of the LD
PZT
SHAKER
SM Sensor
OSCILLOSCOPE
PZT DRIVER
[image:8.595.50.299.106.294.2]Function Generator
Fig. 13. Photograph of the experimental set-up used to induce speckle in SM signals. A piezoelectric transducer (PZT) is employed as the target while the SM sensor is also made to vibrate by using a shaker
0.04 0.05 0.06 0.07 0.08 0.09 -0.05
0 0.05
SM Amplitude [V]
0.04 0.05 0.06 0.07 0.08 0.09
Time [s]
-5 0 5 10
Displacement [
µ
m]
(a)
(b)
Fig. 14. Experimentally acquired SM signal affected by speckle (green) (a) and reconstructed displacement (b) based on fringe counting and direction discrimination. The encircled area denotes a local drop speed area without a global change of displacement direction
away. To induce speckle, the SM sensor is also shaken as per the configuration of [31] as shown in Fig. 13.
Fig. 14 (a) presents the experimentally acquired SM signal affected by speckle along with the reconstructed displacement (Fig. 14 (b)) containing both the target and the laser vibrations. Fig. 15 highlights the correct detection of the fringes. Note that the displacement speed drops in the encircled area without any change of direction, which is correctly analyzed. In addition, despite the speckle affected SM signals containing several hundred of fringes, the algorithm is able to successfully detect all the fringes.
However, as mentionned in the previous section, fringes could be missed for lowC values. These missing fringes can be caused either by:
• a low C factor: the algorithm detects the presence of
fringes but cannot determine the displacement direction.
• a lowC factor and small SM signal amplitude: the peak
0.054 0.056 0.058 0.06 0.062 0.064 0.066 0.068 0.07 0.072 0.074 −0.06
−0.04 −0.02 0 0.02 0.04
SM Amplitude [V]
0.054 0.056 0.0580 0.06 0.062 0.064 0.066 0.068 0.07 0.072 0.074 0.02
0.04 0.06 0.08 0.1
Max [au]
Time [s]
SM Peaks
max(Ψr) max(Ψd)
(a)
[image:8.595.319.550.109.273.2](b)
Fig. 15. Zoom of the experimentally acquired SM signal shown in Fig. 14 (green) (a). The fringes (dotted red) as well as their direction are detected and shown in red line (a) based onΨr(dashed dark blue) andΨd(light blue) (b).
The encircled area denotes a local drop speed area without a global change of displacement direction
0 600 1200 1800 −0.05
0 0.05
SM amplitude [V]
0 600 1200 1800 0
0.05 0.1
Time [au]
Max Amplitude [au]
SM Peaks
max(Ψ
r)
max(Ψd)
(a)
[image:8.595.318.554.345.488.2](b)
Fig. 16. Experimentally acquired SM signal (green) affected by strong speckle (a). The fringes (red) as well as their direction are detected and shown in red line (a) based onΨr (dark blue) and Ψd (light blue) (b). The boxed area
denotes a local lowCand low SM signal amplitude for which the algorithm does not make any decision.
value corresponding to the fringe is lower than the applied threshold.
Fig. 16 shows the case where both theCfactor and the SM signal amplitude are low, which induce the missing fringes.
V. CONCLUSION
We have presented an innovative approach exploiting a bespoke wavelet transform which has enabled robust fringe detection for displacement measurements using self-mixing optical feedback interferometry under weak and moderate feedback regimes. This method can also inherently discrim-inate the displacement direction and has been successfully tested on both simulated and experimental SM signals under different optical feedback regimes as well as in the corruptive presence of speckle and noise.
[image:8.595.56.288.357.523.2]function of the system sampling frequency and of the ampli-tude and frequency range of the vibrating target. Note that in future, additional statistical signal processing can be added to the present algorithm so that even these low amplitude and low C value fringes can still be correctly processed. Such statistical signal processing would make use of periodicity in fringe occurrence coupled with Bi-wavelet based peaks to successfully process such deeply affected SM fringes.
ACKNOWLEDGMENT
The authors would like to thank F. Jayat for the technical support provided during experimental set-up.
REFERENCES
[1] T. Taimre, M. Nikoli´c, K. Bertling, Y. L. Lim, T. Bosch, and A. D. Raki´c, “Laser feedback interferometry: a tutorial on the self-mixing effect for coherent sensing,” Advances in Optics and Photonics, vol. 7, no. 3, pp. 570–631, 2015.
[2] T. Bosch, C. Bes, L. Scalise, and G. Plantier, Optical feedback
interfer-ometry. American Scientific Publishers, 2006, vol. 7, pp. 107–127. [3] R. Lang and K. Kobayashi, “External optical feedback effects on
semiconductor injection laser properties,” Quantum Electronics, IEEE
Journal of, vol. 16, no. 3, pp. 347–355, 1980.
[4] D. M. Kane and K. A. Shore, Unlocking dynamical diversity: optical
feedback effects on semiconductor lasers. John Wiley & Sons, 2005. [5] C. B`es, G. Plantier, and T. Bosch, “Displacement measurements using a
self-mixing laser diode under moderate feedback,” Instrumentation and
Measurement, IEEE Transactions on, vol. 55, no. 4, pp. 1101–1105,
Aug 2006.
[6] S. Merlo and S. Donati, “Reconstruction of displacement waveforms with a single-channel laser-diode feedback interferometer,” IEEE journal
of quantum electronics, vol. 33, no. 4, pp. 527–531, 1997.
[7] Y. Fan, Y. Yu, J. Xi, and J. F. Chicharo, “Improving the measurement performance for a self-mixing interferometry-based displacement sens-ing system,” Applied Optics, vol. 50, no. 26, pp. 5064–5072, 2011. [8] O. Bernal, U. Zabit, and T. Bosch, “Robust method of stabilization of
optical feedback regime by using adaptive optics for a self-mixing micro-interferometer laser displacement sensor,” Selected Topics in Quantum
Electronics, IEEE Journal of, vol. 21, no. 4, pp. 1–8, July 2015.
[9] O. D. Bernal, U. Zabit, and T. Bosch, “Study of laser feedback phase under self-mixing leading to improved phase unwrapping for vibration sensing,” Sensors Journal, IEEE, vol. 13, no. 12, pp. 4962–4971, 2013. [10] A. L. Arriaga, F. Bony, and T. Bosch, “Real-time algorithm for versatile displacement sensors based on self-mixing interferometry,” Sensors
Journal, IEEE, vol. 16, no. 1, pp. 195–202, 2016.
[11] O. D. Bernal, U. Zabit, and T. Bosch, “Classification of laser self-mixing interferometric signal under moderate feedback,” Applied Optics, vol. 53, no. 4, pp. 702–708, 2014.
[12] G. Plantier, C. Bes, and T. Bosch, “Behavioral model of a self-mixing laser diode sensor,” Quantum Electronics, IEEE Journal of, vol. 41, no. 9, pp. 1157–1167, 2005.
[13] G. A. Acket, D. Lenstra, A. J. Den Boef, and B. H. Verbeek, “The influence of feedback intensity on longitudinal mode properties and op-tical noise in index-guided semiconductor lasers,” Quantum Electronics,
IEEE Journal of, vol. 20, no. 10, pp. 1163–1169, 1984.
[14] T. Taimre and A. D. Raki´c, “On the nature of ackets characteristic parameter c in semiconductor lasers,” Applied Optics, vol. 53, no. 5, pp. 1001–1006, 2014.
[15] C. H. Henry, “Theory of the linewidth of semiconductor lasers,”
Quan-tum Electronics, IEEE Journal of, vol. 18, no. 2, pp. 259–264, 1982.
[16] S. Donati, “Developing self-mixing interferometry for instrumentation and measurements,” Laser & Photonics Reviews, vol. 6, no. 3, pp. 393– 417, 2012.
[17] C. B´es, V. Belloeil, G. Plantier, Y. Gourinat, and T. Bosch, “A self-mixing laser sensor design with an extended kalman filter for opti-mal online structural analysis and damping evaluation,” Mechatronics,
IEEE/ASME Transactions on, vol. 12, no. 3, pp. 387–394, 2007.
[18] Y. Yu, J. Xi, J. F. Chicharo, and T. M. Bosch, “Optical feedback self-mixing interferometry with a large feedback factor: behavior studies,”
Quantum Electronics, IEEE Journal of, vol. 45, no. 7, pp. 840–848,
2009.
[19] U. Zabit, T. Bosch, and F. Bony, “Adaptive transition detection algorithm for a self-mixing displacement sensor,” Sensors Journal, IEEE, vol. 9, no. 12, pp. 1879–1886, Dec 2009.
[20] S. Donati, G. Martini, and T. Tambosso, “Speckle pattern errors in self-mixing interferometry,” IEEE Journal of Quantum Electronics, vol. 49, no. 9, pp. 798–806, Sept 2013.
[21] U. Zabit, O. Bernal, and T. Bosch, “Self-mixing laser sensor for large displacements: Signal recovery in the presence of speckle,” Sensors
Journal, IEEE, vol. 13, no. 2, pp. 824–831, Feb 2013.
[22] A. Arriaga, F. Bony, and T. Bosch, “Speckle-insensitive fringe detection method based on hilbert transform for self-mixing interferometry,”
Applied Optics, vol. 53, no. 30, pp. 6954–6962, 2014.
[23] C. B`es, T. Bosch, G. Plantier, and F. Bony, “Characterization of a self-mixing displacement sensor under moderate feedback,” Optical
Engineering, vol. 45, no. 8, pp. 084 402–084 402, 2006.
[24] A. Doncescu, C. Bes, and T. Bosch, “Displacement estimation with an optical feedback interferometer using an evolutionary algorithm,” in
Sensors, 2007 IEEE, Oct 2007, pp. 382–386.
[25] A. Jha, F. J. Azcona, C. Ya˜nez, and S. Royo, “Extraction of vibration parameters from optical feedback interferometry signals using wavelets,”
Applied Optics, vol. 54, no. 34, pp. 10 106–10 113, 2015.
[26] K. Petermann, “External optical feedback phenomena in semiconductor lasers,” in Advanced Networks and Services. International Society for Optics and Photonics, 1995, pp. 121–129.
[27] S. Mallat and W. Hwang, “Singularity detection and processing with wavelets,” Information Theory, IEEE Transactions on, vol. 38, no. 2, pp. 617–643, March 1992.
[28] H. Mesa, “Ondelettes adapt´ees pour la d´etection de motifs,” Ph.D. dissertation, Paris 11, 2006.
[29] ——, “Adapted wavelets for pattern detection,” in Progress in Pattern
Recognition, Image Analysis and Applications. Springer, 2005, pp. 933–944.
[30] T. Jiang, B. Chen, X. He, and P. Stuart, “Application of steady-state detection method based on wavelet transform,” Computers & chemical
engineering, vol. 27, no. 4, pp. 569–578, 2003.
[31] U. Zabit, O. D. Bernal, and T. Bosch, “Design and analysis of an embedded accelerometer coupled self-mixing laser displacement sensor,”
Sensors Journal, IEEE, vol. 13, no. 6, pp. 2200–2207, 2013.
Olivier D. Bernal (M03) received the M.Sc. degree in electrical engineering
and the Ph.D. degree from INPT Toulouse, France, in 2003 and 2006, respec-tively. In 2009,he joined the Laboratory of Optoelectonics and Embedded Systems of the CNRS-LAAS and the INPT, where he is now an Assistant Professor. His main research interests are in the design of analog circuit design for optoelectronics and space applications.
Han-Cheng Seat is currently Associate Professor at INPT-ENSEEIHT and in
the Optoelectronics for Embedded Systems group, LAAS-CNRS. His research interests include high-performance interferometry for geophysics, fiber gas sensors, optical feedback interrogation techniques for FBG-based sensors and ultra-fast phenomena, and refractory surface plasmon resonance
Usman Zabit (M12) did his PhD at Institut National Polytechnique Toulouse
(INPT), France in 2010. His post-doctorate at LAAS-CNRS,Toulouse focused on real-time embedded sensor design. Currently, he is a faculty member at Riphah International University, Islamabad, Pakistan. Dr. Zabit is the recipient of Prix Leopold Escande, and European Mechatronics Award 2010 awarded by INP Toulouse, and European Mechatronics Meeting 2010 respectively.
Fr´ed´eric Surre (S’00, M’03) received the Engineering Degree, MSc and
PhD in electronic engineering from INPT, Toulouse, France in 1998, 1998 and 2003 resp. His research interests include optical systems design. He is a member of the IEEE Standards Education Committee.
Thierry Bosch is Professor at ENSEEIHT-INPT and Head of the
![Fig. 7. Simulated target displacement (a) away from the laser at an increasingTime [s]and (b) calculated envelope of the maximum coefficient usingΨspeed (from 200 µm.s−1 to 20 mm.s−1) for C=1.5, α=4 and λ =785 nm, Ψr (red) andd (magenta).](https://thumb-us.123doks.com/thumbv2/123dok_us/1442597.96671/6.595.57.293.119.340/simulated-displacement-increasingtime-calculated-envelope-coefcient-usingpsspeed-magenta.webp)