Laser Metrology and Machine Performance XII
Measurement of spindle error motions by an
improved multi-probe method
Fei Ding, Xichun Luo*
Centre for Precision Manufacturing, DMEM, University of Strathclyde,
UK
*Corresponding author’s email: [email protected]
Abstract
This paper proposes an improved multi-probe method for measurement of spindle error motions. Four degree of freedoms (DOFs) of error motions of a spindle are measured in a dedicated setup using capacitive sensors. Three sets of probe angle set are carefully selected in order to overcome the harmonic suppression problems commonly encountered in the multi-probe measurement approach. The error contribution of each set of angles is analysed and then the measurement results are modified in frequency domain so as to minimise the effect of harmonic suppression. The evaluation of measurement results shows that this method is effective and possesses good agreement with repeated measurements.
1
Introduction
Rotary motions can be found in majority of machine tools and the study of spindle performance has always been a necessity for machine tool builders. The key issue of spindle metrology is how to separate the true rotor error motions from the acquired sensor data. Reversal, multi-probe and multi-step methods are the three most commonly used separation techniques for spindle metrology [1]. Reversal method typically involves the repositioning of both the artefact and probe which will inevitably introduce extra measuring uncertainty. Multi-probe and multi-step methods have the same problem of harmonic suppression which derives from the algorithm used to separate the artefact profile.
Laser Metrology and Machine Performance XII
dedicated fixture using a spherical pilot mated in a carbide socket to locate the artefact. Marsh and co-workers compared the reliability of three separation methods and it shows multi-probe method gives comparable results to reversal method [3, 4]. S. Cappa and co-workers achieved 0.455nm repeatability using one probe in the multi-probe method by rotating the spindle stator [5].
The above researches have achieved sub-nanometre repeatability. However, those measurements are conducted in controlled lab room with special equipment. In most cases after the spindle is set on a machine tool, rotation of spindle stator is impossible, neither precision reversal is applicable. This paper presents an improved multi-probe method which shows effective reduction of harmonic problems without special setup.
2
Experimental techniques
2.1 Probe arrangement
Harmonic weighting function G(k) is derived from artefact profile to the weighted summation of probe outputs. It can be described as:
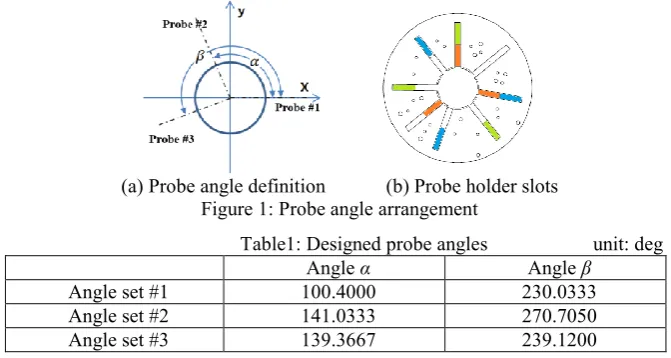
Where k is harmonic order, α and β are relative angles between probes shown in figure 1 (a). Low values of |G| will result in error amplification. However it is difficult to find a pair of probe angles that makes G high enough for a wide range. So three sets of probe angles are selected to maximise the minimum value of |G|. The angle set #1 is selected according to Cappa’s research. A matlab script is written to search for the other two angle values at which the three combinations don’t compress the same harmonics. Eight radial slots are machined on a precision turned flat surface and then used to locate the probe body, as shown in figure 1 (b). The designed angles are listed in table 1.
[image:2.595.77.413.445.624.2]
(a) Probe angle definition (b) Probe holder slots Figure 1: Probe angle arrangement
Table1: Designed probe angles unit: deg
Angle α Angle β
Angle set #1 100.4000 230.0333
Angle set #2 141.0333 270.7050
Laser Metrology and Machine Performance XII
2.2 Experimental setup
Three calibrated Lion precision capacitive probes are used throughout the measurement. The bandwidth of the amplifier is adjusted to 1 kHz to achieve a resolution of 0.3nm rms and the peak to peak resolution is expected to be ten times higher. A 16-bit eight-channel simultaneous sampling board is used to sample the displacement signal. The spindle is equipped with a 6,000-line Heidenhain rotary encoder. The machine controller is configured to generate 10,000 pulses per revolution and these pulses are used to trigger the data acquisition device. Spindle speed is set to 60 rpm. Each measurement begins from the same spindle position and a total of 200 revolutions are sampled. Because the spindle rotation is not stable during the start-up period, only the last 32 revolutions are used in the calculation.
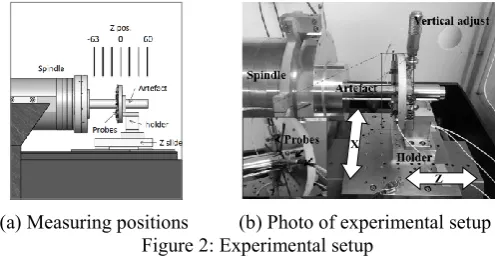
The spindle under test is mounted on a diamond turning machine. An aluminium cylinder artefact is first turned with a diamond tool on the machine, thus a small runout is guaranteed. Spindle error motion measurements are carried out at seven positions spaced by 21 mm along Z direction, each with three angular arrangements. The spindle error motions at different locations are later used to calculate spindle tilt errors. The probe mounting plate is adjusted perpendicular to the spindle rotating axis within 20 um and the influences of probe positional error are analysed in [6]. In order to reduce vibration, the air bearing slides are cut off from air supply and rested on the machine bed after positioning the probe holder. Figure 2 (a) to (b) shows the measuring positions and experimental setup.
[image:3.595.118.366.398.527.2]
(a) Measuring positions (b) Photo of experimental setup Figure 2: Experimental setup
2.3 Determination of probe angles
The exact angles between the three probes are critical for the correct separation of artefact form error and spindle error motion. Although lots of efforts have been made in selecting the different angles, there will be positioning errors when the probes are mounted on the sensor holder. The angle deviations won’t be so large as to affect the overall shape of the weighting function, so the
Laser Metrology and Machine Performance XII
aforementioned design process is still necessary. The question is how to determine the actual angles after the probes are mounted.
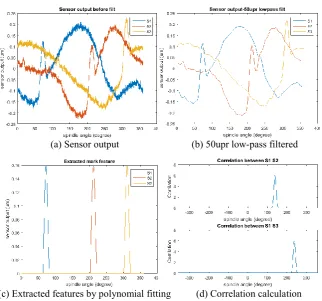
In this paper, an ink mark is made onto the cylinder where test is not planned, Z-10 mm in this case. Because the spindle error motions are superimposed onto the sensor data, direct correlation calculation cannot get good results. So low-pass filters, low-order polynomials subtraction are in turn applied to the curves to extract the ink feature, as shown in figure 3 (a) to (d). Then cross correlations are calculated between each signal and the peak values correspond to the relative angles.
(a) Sensor output (b) 50upr low-pass filtered
[image:4.595.87.410.208.509.2](c) Extracted features by polynomial fitting (d) Correlation calculation Figure 3: Steps for calculation of actual probe angles
Laser Metrology and Machine Performance XII
Table 2: Actual probe angles after mounting unit: deg Angle α Standard deviation Angle β Standard deviation
Angle set #1 100.15 0.0052 230.12 0.0314
Angle set #2 140.90 0.0052 269.92 0.0173
Angle set #3 139.33 0.0131 238.31 0.0144
2.4 Harmonics suppression reduction
[image:5.595.93.406.223.318.2]The three harmonic weighting functions calculated from the measured angles are shown in figure 4. Several unexpected small values of |G| can be found at harmonics around 35 undulations per revolution (upr) and 60 upr.
Figure 4: Harmonic weighting functions after probe mounting
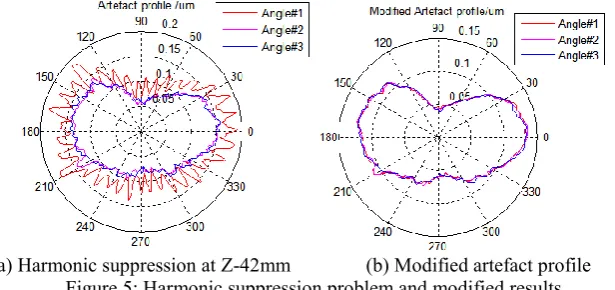
Figure 5 (a) shows the separated artefact profiles from three measurements at Z-42 mm position. The profile measured by angle set #1 poses much higher undulations than angle #2 and #3, which is caused by the error amplification effect of low |G|. A frequency domain modification method is applied to each curve to address this problem. For each angle set, the magnitude of the artefact profile spectrum is scaled to be the smallest of the three, while the phase of each harmonic order is kept unchanged. And then they are converted back into waveforms by inverse FFT. The modified artefact profile is shown in figure 5 (b) and the results show that the maximum differences between the three measurements is reduced from 24.1 nm to 7.3 nm, thus the harmonic problem is effectively reduced by 70% in this case.
[image:5.595.90.398.464.609.2]Laser Metrology and Machine Performance XII
3
Measurement results
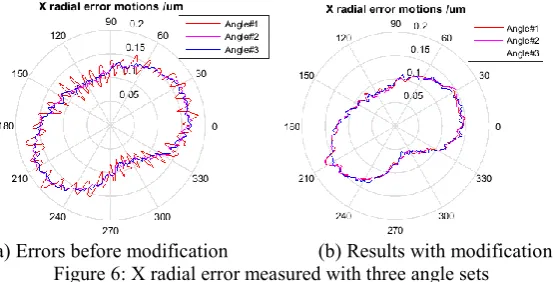
Three measurements with different angles at Z-42 mm (approx. 100 mm from bearing position) are evaluated to verify the frequency domain modification approach. Analysed harmonic range is set from 2 upr to 256 upr and asynchronous errors are removed by averaging 32 revolutions. Figure 6 (a) and (b) shows the synchronous X radial error motions before and after frequency domain modification. The modified results possess much improved agreement between the three measurements. The peak-to-peak synchronous X radial error is measured to be 108.1 nm, 112.1 nm and 101.1 nm respectively.
[image:6.595.111.389.227.368.2](a) Errors before modification (b) Results with modification Figure 6: X radial error measured with three angle sets
Radial error motions at different Z locations are measured using the above method. The trajectories of rotating centre are plotted in Cartesian coordinate in figure 7 (a). Linear fit is applied at each spindle rotary position to calculate spindle X and Y tilt errors. The tilt error around Y axis is show in figure 7 (b).
[image:6.595.87.399.445.580.2]Laser Metrology and Machine Performance XII
4
Conclusions
An improved multi-probe method is proposed for spindle error motion measurements. Measurements at three sets of optimised angles are used to minimise harmonic suppression. The radial error motions at seven axial locations and the tilt error motions of the spindle are obtained by this method. The results show good agreement for repeated measurements and harmonic suppression effect is reduced by 70% at Z-42 mm position.
Acknowledgement
The authors would like to thank the EPSRC (EP/K018345/1) to provide financial support to this research.
References
[1] Whitehouse, D.J., 1976. Some theoretical aspects of error separation techniques in surface metrology.Journal of Physics E: Scientific Instruments,9(7), p.531.
[2] Grejda, R., Marsh, E. and Vallance, R., 2005. Techniques for calibrating spindles with nanometer error motion.Precision engineering,29(1), pp.113-123. [3] Marsh, E.R., Arneson, D.A. & Martin, D.L., 2010. A comparison of reversal and multiprobe error separation. Precision Engineering, 34(1), pp.85–91. [4] Marsh, E.R., Couey, J. & Vallance, R., 2006. Nanometer-Level Comparison of Three Spindle Error Motion Separation Techniques. Journal of Manufacturing Science and Engineering, 128(1), p.180.