R E S E A R C H
Open Access
Epidemiology of mechanically ventilated
patients treated in ICU and non-ICU
settings in Japan: a retrospective database
study
Yoshiaki Iwashita
1*, Kazuto Yamashita
2, Hiroshi Ikai
2, Masamitsu Sanui
3, Hiroshi Imai
1and Yuichi Imanaka
2Abstract
Background:In most countries, patients receiving mechanical ventilation (MV) are treated in intensive care units (ICUs). However, in some countries, including Japan, many patients on MV are not treated in ICUs. There are insufficient epidemiological data on these patients. Here, we sought to describe the epidemiology of patients on MV in Japan by comparing and contrasting patients on MV treated in ICUs and in non-ICU settings. A preliminary comparison of patient outcomes between ICU and non-ICU patients was a secondary objective.
Methods: Data on adult patients receiving MV for at least 3 days in ICUs or non-ICU settings from April 2010
through March 2012 were obtained from the Quality Indicator/Improvement Project, a voluntary data-administration project covering more than 400 acute-care hospitals in Japan. We excluded patients with cancer-related diagnoses. Patient demographic data and the critical care provided were compared between groups.
Results:Over the study period, 17,775 patients on MV were treated only in non-ICU settings, whereas 20,516 patients were treated at least once in ICUs (46.4% vs. 53.6%). Average age was higher in non-ICU patients than in ICU patients (72.8 vs. 70.2,P< 0.001). Mean number of ventilation days was greater in non-ICU patients (11.7 vs. 9.5,P< 0.001). Hospital mortality was higher in non-ICU patients (41.4% vs. 38.8%,P< 0.001). Standard critical care (e.g., arterial line placement, enteral nutrition, and stress-ulcer prevention) was provided significantly less often in non-ICU patients. Multivariate analysis showed that ICU admission significantly decreased hospital mortality (adjusted odds ratio 0.713, 95% CI 0.676 to 0.753).
Conclusions:A large proportion of Japanese patients on MV were treated in non-ICU settings. Analysis of administrative data indicated preliminarily that hospital mortality rates in these patients were higher in non-ICU settings than in ICUs. Prospective analyses comparing non-ICU and ICU patients on MV by severity scoring are needed.
Keywords:ICU, Japan, Mechanically ventilated patient
Background
The numbers of patients requiring intensive care are increasing worldwide [1]. Many of these patients require mechanical ventilation (MV), and in a majority of coun-tries they are treated exclusively in intensive care units (ICUs) [1, 2]. In some countries, including Japan, how-ever, some patients on MV are treated in non-ICU
settings. This is presumably because of a shortage of ICU beds in Japan compared with European countries [3–5], or shortages of trained nurses or critical care phy-sicians. In Japan, because ICUs require official regula-tion, some hospitals have special units that are used to treat severely ill patients but are not officially certified as ICUs. The nurse-to-patient ratio in general wards is 1:7, but official ICUs are required to have a ratio of 1:2. It is difficult for small to medium-sized hospitals to employ enough nurses to meet this ratio. Therefore, some hospi-tals have non-certified ICUs. The organization of, and * Correspondence:iwaci1ta@clin.medic.mie-u.ac.jp
1Emergency and Critical Care Center, Mie University Hospital, 2-174 Edobashi,
Tsu, Mie, Japan
Full list of author information is available at the end of the article
care in, these quasi-ICUs vary among hospitals, and pa-tient selection depends on the region. There are no offi-cial criteria designating what kinds of patients should be treated in each type of ICU. If the quality of care pro-vided in ICUs and these quasi-ICUs differs, then some patients may be receiving suboptimal care.
To the best of our knowledge, no epidemiological data on acute-phase patients on MV treated in non-ICU set-tings in Japan have been reported. Previously, we per-formed an attitude survey of physicians treating critically ill patients in hospitals without ICU facilities, and we found that 10% of physicians at these hospitals were treating acute-phase patients on MV approximately once a month [6]. However, because of a lack of quantitative epidemiological data in the survey, no conclusion was drawn on what proportion of patients were being treated in non-ICU settings. We consider that the feasibility and safety of treating patients on MV in non-ICU settings is worth investigating in a well-designed study.
Our primary objective here was to describe the epi-demiology of patients on MV in Japan by comparing and contrasting these patients treated in ICUs and in non-ICU settings. We also compared the outcomes of ICU and non-ICU patients on MV by using the cur-rently available dataset, as a basis for future studies.
Methods
We compared patients on MV who were treated at least once in ICUs (ICU group) and those who never stayed in ICUs (non-ICU group). Patients whose treatment was started in non-ICU settings and who were then trans-ferred to ICUs were counted in the ICU group, regard-less of whether they started MV before or after ICU admission. “MV” includes both intubated MV and acute-phase non-invasive MV with partial arterial pres-sure of oxygen (PaO2) < 300 mmHg or partial arterial pressure of carbon dioxide (PaCO2) > 45 mmHg. “ICU” was defined here as “officially certified ICU” in accord-ance with Japanese government insuraccord-ance policy. The criteria for an officially certified ICU include staffing of the unit with at least one physician in-house 24 hourly and with nurses at a ratio of one nurse to two patients; in addition, a certified ICU must be fully equipped with hardware to resuscitate critically ill patients. In Japan there are many quasi-ICU units that treat severely ill pa-tients and function similar to ICUs but not officially cer-tified. These quasi-ICUs were counted among non-ICUs. Under the government insurance policy, ICU admission is allowed for patients who are in the following states: loss of consciousness, respiratory failure, cardiac failure, acute intoxication, shock, severe metabolic disorder, severe burns, after major surgery, post-resuscitation, and severe trauma. However, these are minimal requirements, and the actual indications depend on the facilities, the
attending physicians, and the relative severity among ICU patients.
Data source
The data were derived from the Quality Indicator/Im-provement Project (QIP), which is an administrative database project covering more than 400 voluntary acute-care hospitals in Japan. The project is operated by Kyoto University. The dataset is based on a Japanese-government-operated national database (Diagnosis Pro-cedure Combination (DPC)), which includes each pa-tient’s demographic data and diagnosis (including the main reason for hospital admission, major complica-tions, past major diagnoses, and co-morbidities).
Target patients
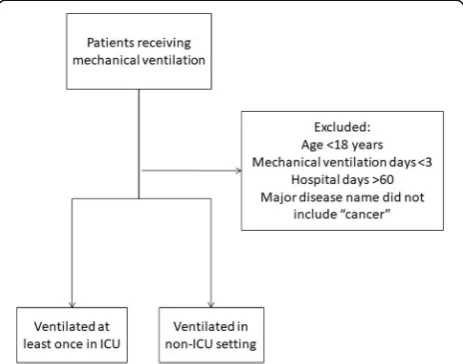
We used patient data from the QIP database for the period from April 2010 through March 2012. Patient flow through the study is shown in Fig. 1. Patients who received MV for at least one period during their hospitalization and did not receive palliative care were eligible for inclusion in the study. Patients who were younger than 18 years, received MV for fewer than 3 days, had hospital stays of more than 60 days, or had cancer as their major disease were excluded. To prevent the data for analysis from being influenced by the inclu-sion of data from terminal-stage patients who were not candidates for ICU admission, we excluded patients who had cancer codes as their major current diagnoses but not in their past histories. Although exclusion of patients with end-stage non-cancerous conditions was not pos-sible, the proportions of patients with severe heart
[image:2.595.306.538.481.663.2]failure (New York Heart Association stage 4) or severe respiratory failure (Hugh-Jones stage 4) were similar be-tween patients in the ICU group and in non-ICU group (data not shown).
Development of the prediction model
Model development was based on previous work done by Umegaki et al. [7]. Briefly, possible variables were derived by using methods developed by Umegaki et al., but with modifications. First, patients in the Umegaki model are all admitted to the ICU, whereas in our dataset not all pa-tients were admitted to the ICU but all papa-tients received MV. Among the demographic variables, age was defined as a continuous variable. Among the clinical factors, hos-pital admission categories were derived from the adminis-trative data. Scheduled-admission patients were those admitted through a reservation provided during their pre-vious hospital visit. Unscheduled or ambulance admissions were categorized as emergency admissions. Emergency admission included admissions direct to the hospital, by referral from other hospitals, or from the scene of the pre-cipitating event or accident. Scheduled admission was used as a reference value for hospital admissions in the multivariate analysis.“Reasons for ICU admission” in the study by Umegaki et al. was replaced by “Reasons for starting MV.” “Patients who underwent surgery on the day of initiation of MV”, or “patients who began MV within 7 days after surgery” were replaced as “patients who underwent MV in relation to surgery.”Among these patients, those who underwent surgery on the day of hos-pital admission or the following day were defined as hav-ing had“emergency surgery,”whereas those who did not undergo emergency surgery were defined as having had “scheduled surgery.”All other patients were considered to have been admitted for medical reasons.
To determine the categories of primary diagnoses, we used the World Health OrganizationInternational clas-sification of diseases and related health problems 10th revision, to translate our administrative data into diag-nostic categories in accordance with the methods used by Umegaki et al. [7] (Additional file1: Table S1). There were four categories of time between hospital admission and initiation of MV (days) (Table 1). Among the treat-ment categories, renal replacetreat-ment therapy included continuous renal replacement therapy, intermittent renal replacement therapy, plasma absorption, and plasma ex-change, but it excluded peritoneal dialysis, which is rarely used in patients on MV. Catecholamine treat-ments included administration of dopamine, dobuta-mine, noradrenaline, or adrenaline.
The relationships between individual variables and hospital mortality were analyzed by thet test, and vari-ables with P> 0.25 were excluded from subsequent ana-lyses. The remaining variables were analyzed by multiple
logistic regression using a backward stepwise selection method. The model was constructed using variables with
P< 0.05. Significant variables and data on whether or not patients were admitted to the ICU were further ana-lyzed by multiple logistic regression using a simultan-eous method and adjusting for other variables to examine whether ICU admission was associated with the 28-day mortality rate.
Model performance was assessed in terms of discrimin-ation and calibrdiscrimin-ation. Model discrimindiscrimin-ation was assessed by using the area under the receiver operating characteris-tic (ROC) curve. The calibration was assessed using Hos-mer–Lemeshow contingencyχ2statistics and a calibration plot curve. The calibration plot curve was described using R. All other statistical analyses were performed using SPSS software, version 23 (IBM Inc., Tokyo, Japan.)
Results
Epidemiological data
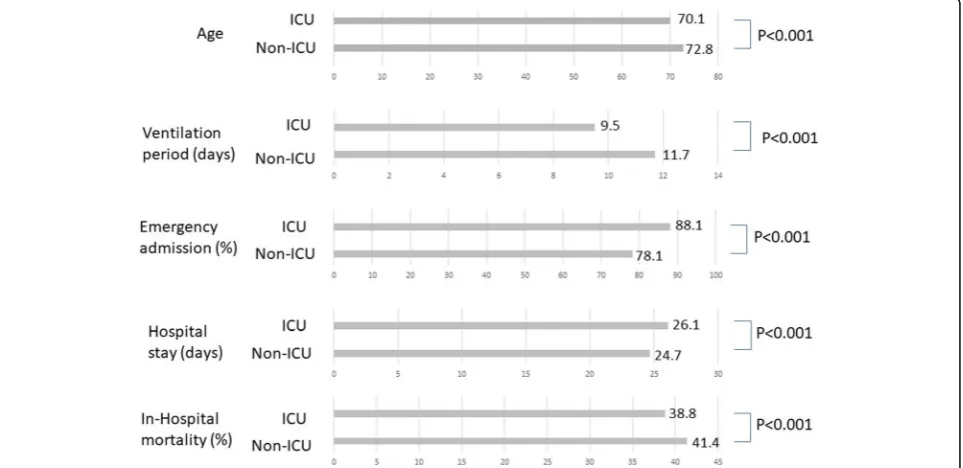
In the study period, 17,775 patients with MV (46.4%) were exclusively treated in the general ward, whereas 20,516 pa-tients with MV (53.6%) were treated for at least one period in the ICU (Fig.2). The percentage of men and the percentage of emergency admissions were significantly higher in ICU patients (P= 0.025,P< 0.001, respectively). Univariate comparisons of ICU and non-ICU patients are shown in Fig. 3. Average age was significantly higher in non-ICU patients than in ICU patients (72.8 vs. 70.1 years;
P< 0.001). The mean number of ventilation days was sig-nificantly greater in the non-ICU group than in the ICU group (11.7 vs. 9.5 days;P< 0.001). Overall hospital mor-tality was significantly higher in non-ICU patients than in ICU patients (7353 (41.4%) vs. 7963 (38.8%);P< 0.001).
Treatment options
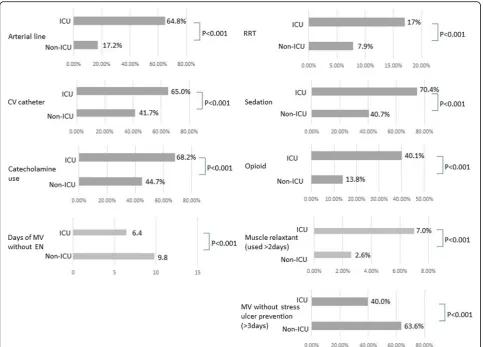
[image:3.595.306.540.109.262.2]Treatments frequently applied to patients on MV in the ICU are listed in Fig. 4. Invasive lines (arterial lines and central
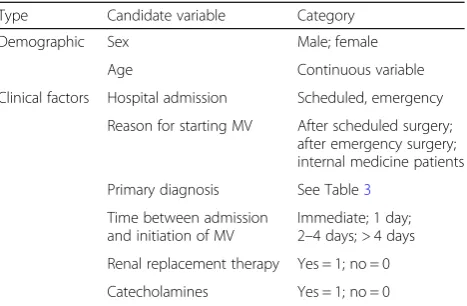
Table 1Candidate variables used to develop the hospital mortality prediction model
Type Candidate variable Category
Demographic Sex Male; female
Age Continuous variable
Clinical factors Hospital admission Scheduled, emergency
Reason for starting MV After scheduled surgery; after emergency surgery; internal medicine patients
Primary diagnosis See Table3
Time between admission and initiation of MV
Immediate; 1 day; 2–4 days; > 4 days
Renal replacement therapy Yes = 1; no = 0
Catecholamines Yes = 1; no = 0
venous catheters) were used in significantly fewer non-ICU patients than ICU patients (arterial line, 17.2% vs. 64.8%,P< 0.001; central venous catheter: 41.7% vs. 65.0%, P< 0.001). There was significantly less use of catecholamines and renal replacement in non-ICU patients (catecholamines, 44.7% vs. 68.2%, P< 0.001; renal replacement, 7.9% vs. 17.0%, P< 0.001). There was shorter durations of enteral nutrition (EN) and less frequent use of stress-ulcer prophylaxis in the non-ICU group (average days of MV without EN, 9.8 vs. 6.4,
P< 0.001; MV without stress-ulcer prevention for more than 3 days, 63.6% vs. 40.0%,P< 0.001).
Major diagnoses
Numbers and percentages of major diagnoses are listed in Table 2. Heart failure was the most frequent reason
for MV in either group (14.0% in the non-ICU group and 12.3% in the ICU group). Diseases requiring surgical interventions, including interventional radiology—such as aortic dissection, acute myocardial infarction, and subarachnoid hemorrhage—were frequently managed in ICUs. Diseases common in elderly patients, such as as-piration pneumonia, were more frequently managed in non-ICU settings.
Epidemiological data according to diagnosis
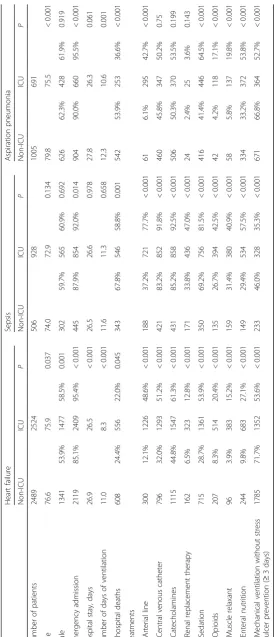
To define the characteristics of ICU and non-ICU patients, we further analyzed three major diseases: heart failure, sep-sis, and aspiration pneumonia (Table 3). We chose these diseases because they are treated in any type of hospital (i.e., they do not usually require surgical intervention). The
Fig. 2aNumber of patients treated in ICU and non-ICU setting. Nearly half of acute-phase patients on mechanical ventilation (MV) were treated in non-ICU settings.bMale versus female ratio of patients on MV treated in ICU and non-ICU settings
[image:4.595.56.539.88.229.2] [image:4.595.58.540.470.704.2]Fig. 4Treatments frequently applied to patients on mechanical ventilation (MV) in the ICU. Invasive lines were used in significantly fewer non-ICU patients than in ICU patients. There was significantly less use of catecholamines and renal replacement in non-ICU patients. There was shorter duration of enteral nutrition (EN) and less frequent use of stress-ulcer prophylaxis in the non-ICU group. CV, central vein; RRT, renal replacement therapy
Table 2The number and percentage of major diagnoses Total
(38,291)
Non-ICU (17,775)
ICU (20,516)
Heart failure 5013 (13.1%) 2489 (14.0%) 2524 (12.3%)
Respiratory failure 1818 (4.7%) 1256 (7.1%) 562 (2.7%)
AMI 1813 (4.7%) 473 (2.7%) 1340 (6.5%)
Aspiration pneumonia 1696 (4.4%) 1005 (5.7%) 691 (3.4%)
Aortic dissection 1635 (4.3%) 211 (1.2%) 1424 (6.9%)
Sepsis 1434 (3.7%) 506 (2.8%) 928 (4.5%)
SAH 1356 (3.5%) 516 (2.9%) 840 (4.1%)
Cerebral hemorrhage 1316 (3.4%) 538 (3.0%) 778 (3.8%)
Interstitial pneumonia 1305 (3.4%) 843 (4.7%) 462 (2.3%)
Pneumonia 1289 (3.4%) 834 (4.7%) 455 (2.2%)
Other diagnoses 19,619 (51.2%) 9557 (53.8%) 10,512 (51.2%)
[image:5.595.57.548.547.724.2]number of patients with heart failure was similar between the ICU and non-ICU groups, whereas patients with sepsis were more frequently treated in ICUs and patients with as-piration pneumonia were more frequently treated in non-ICU settings. Regardless of the diagnosis, in-hospital mortality rates were significantly higher in non-ICU groups (heart failure, P= 0.045; sepsis,P= 0.001; aspiration pneu-monia,P< 0.001). The age of patients treated in non-ICU settings was significantly higher in patients with heart fail-ure (P= 0.037) and aspiration pneumonia (P< 0.001) but not in patients with sepsis (P= 0.134). In patients with sep-sis, use of catecholamines (P< 0.001) and renal replacement (P< 0.001) therapies were more frequent in the ICU group. These data suggest that septic ventilated patients have worse outcomes in non-ICU settings, regardless of the fact that their disease may be less severe and despite their simi-lar ages to ICU patients.
Outcomes in ICU and non-ICU patients
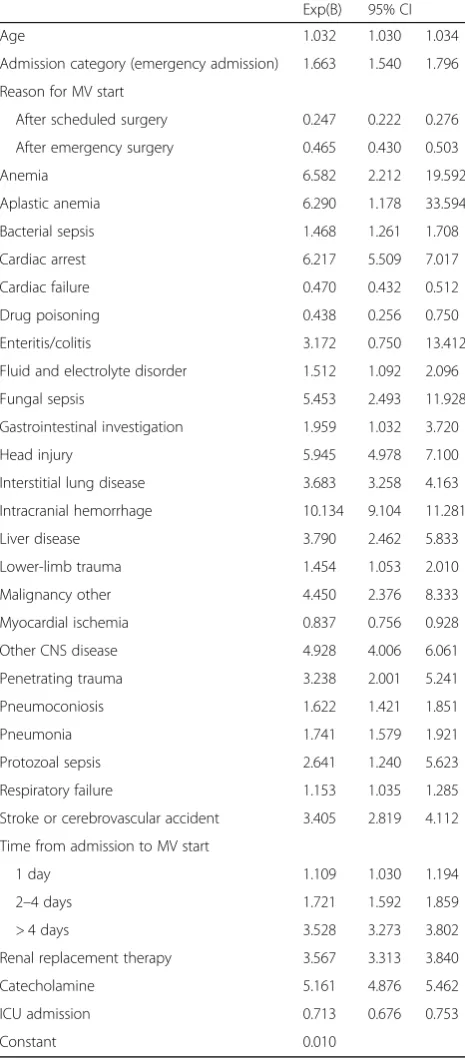
We performed multivariate analysis to clarify further whether management in the ICU was associated with a decrease in hospital mortality rates. We developed a lo-gistic regression model to eliminate possible confound-ing factors. Table1and Additional file1: Table S1 show the variables that could potentially influence hospital mortality rates. These variables were chosen from previ-ous studies [7–9]. The results of the multivariate ana-lyses are shown in Table 4. ICU admission was significantly associated with a decrease in the hospital mortality rate (OR 0.713, 95% CI 0.676 to 0.753).
The discriminatory ability of the model was assessed by the area under the ROC, and the calibration was assessed by the Hosmer–Lemeshow test and a calibration plot curve (Additional file2: Figure S1). The discrimination by the model in the area under the ROC was 0.818. Although the Hosmer–Lemeshow χ2 statistics showed a significant difference between the predicted and observed risk of mortality in our dataset, on the calibration plot curve our prediction model seemed to be well-matched to the ob-served risk of hospital death.
Discussion
To our knowledge, this is the first survey of the charac-teristics and outcomes of patients with MV in non-certified ICU settings in Japan, compared with those in official ICUs. Surprisingly, in Japan, 46.4% of patients on MV were treated exclusively in non-ICU settings, in-cluding in quasi-ICUs and general wards. Patients treated in non-ICU settings were older, were less likely to have had emergency admissions, and had diagnostic characteristics that differed from those of patients in the ICU. Also, patients who needed surgical intervention, such as acute myocardial infarction (AMI), aortic dissec-tion and SAH were more likely to be treated in the ICU.
[image:7.595.305.538.112.643.2]The overall number of ventilation days and hospital mortality rates were higher in non-ICU patients. In pa-tients with sepsis there was no significant difference in age between groups, but there was greater mortality in non-ICU patients, who also received fewer critical care interventions. This suggests that there may be patients
Table 4Results of multivariable logistic regression analysis of hospital mortality in mechanically ventilated patients
Exp(B) 95% CI
Age 1.032 1.030 1.034
Admission category (emergency admission) 1.663 1.540 1.796
Reason for MV start
After scheduled surgery 0.247 0.222 0.276
After emergency surgery 0.465 0.430 0.503
Anemia 6.582 2.212 19.592
Aplastic anemia 6.290 1.178 33.594
Bacterial sepsis 1.468 1.261 1.708
Cardiac arrest 6.217 5.509 7.017
Cardiac failure 0.470 0.432 0.512
Drug poisoning 0.438 0.256 0.750
Enteritis/colitis 3.172 0.750 13.412
Fluid and electrolyte disorder 1.512 1.092 2.096
Fungal sepsis 5.453 2.493 11.928
Gastrointestinal investigation 1.959 1.032 3.720
Head injury 5.945 4.978 7.100
Interstitial lung disease 3.683 3.258 4.163
Intracranial hemorrhage 10.134 9.104 11.281
Liver disease 3.790 2.462 5.833
Lower-limb trauma 1.454 1.053 2.010
Malignancy other 4.450 2.376 8.333
Myocardial ischemia 0.837 0.756 0.928
Other CNS disease 4.928 4.006 6.061
Penetrating trauma 3.238 2.001 5.241
Pneumoconiosis 1.622 1.421 1.851
Pneumonia 1.741 1.579 1.921
Protozoal sepsis 2.641 1.240 5.623
Respiratory failure 1.153 1.035 1.285
Stroke or cerebrovascular accident 3.405 2.819 4.112
Time from admission to MV start
1 day 1.109 1.030 1.194
2–4 days 1.721 1.592 1.859
> 4 days 3.528 3.273 3.802
Renal replacement therapy 3.567 3.313 3.840
Catecholamine 5.161 4.876 5.462
ICU admission 0.713 0.676 0.753
Constant 0.010
who are candidates for ICU treatment but who are being treated in non-ICU settings. This possibility is further supported by the results of the comparison of mortality rates between the ICU and non-ICU settings. The mor-tality rate adjusted by the administrative data was higher in the non-ICU group. Standard critical care, including EN and stress-ulcer prophylaxis, was less likely to be ad-ministered in non-ICU patients. These data may reflect the results of sustained therapy in terminally ill patients or patients with less severe disease who enter non-ICU settings; nevertheless, the reduced likelihood of receiving such treatments could lead to worse recovery outcomes in critically ill patients.
Ideally, critically ill patients requiring life-sustaining interventions should be treated in the ICU. However, one study showed that 16–51% of patients who need critical care are refused ICU admission because of lim-ited resources [10]. In a large number of countries, des-pite limited ICU beds, the majority of acute patients on MV are still treated in ICUs [4], whereas in Japan pa-tients on MV may be treated in non-ICU settings. We defined an ICU here as an “officially certified ICU.” Some of the quasi-ICU facilities in our study may well have been similar to ICUs. However, because admission fees are higher in certified ICUs, it is not likely that any certifiable facility would not obtain certification. There-fore, quasi-ICU units are likely to be inferior to certified ICUs in some regard.
Two reports—from Hong Kong and Israel—have com-pared patients on MV treated in ICUs with those treated in general wards [11, 12]. The Hong Kong study com-pared the mortality rates of patients on MV in non-ICUs with expected mortality rates. The Israeli study compared patients on MV treated in ICUs and those treated in non-ICUs. Both studies showed increase in mortality rates in non-ICU settings. However, both studies were relatively small, single-center studies, with a high institutional bias. In contrast, our results were de-rived from data on more than 38,000 patients from across Japan; this large number may help markedly to eliminate potential institutional biases.
Our results showed lower mortality in patients on MV if treated in ICUs. In contrast, previous studies have shown that mortality rates in patients with acute lung injury or catheter-related bloodstream infection have not decreased with patient treatment in the ICU [13–15]. In fact, patients with either of these conditions may not ne-cessarily need critical care if their condition does not de-teriorate. However, if critically ill patients on MV stay in the ICU, they may benefit from close monitoring and standard critical care (e.g., arterial line placement and stress-ulcer prevention) supplied by sufficient numbers of staff and specialized personnel (e.g., board-certified physicians and specialist nurses). Our results show that
EN, stress-ulcer prevention, and arterial lines were used significantly less often in non-ICU patients with MV. Also, the Israeli study showed that the numbers of ventilator-setting changes and blood gas analyses were
higher in ICU patients and the numbers of
endotracheal-tube-related adverse events were higher in non-ICU patients [12]. These results indicate that pa-tients with MV may be treated optimally in the ICU.
However, even for patients treated in the ICU, the man-agement and outcomes may differ among institutions. In the USA, a comparison between patients on MV treated in rural hospitals with relatively limited resources and those treated in referral hospitals with better resources identified higher mortality rates in rural hospitals [16]. Also in Japan, ICUs certified by academic societies have better patient outcomes than those not certified [17]. Fur-ther research focusing on differences in intensive care quality among institutions is warranted.
these tools in non-ICU settings, regardless of the patient’s condition. This may result in delays in resuscitation or in awareness of hypoperfusion. For this reason, we think that the use of such items may be a prognostic factor as well. Moreover, co-morbidities might be important factors in predicting prognosis. However, we used the model of Umegaki et al. [7], which has already been shown to have sufficient prognostic value without the need to add co-morbidities.
Conclusions
We compared care and outcomes in patients on MV in non-ICU and ICU settings using a large Japanese data-base. A large proportion of patients on MV were treated in non-ICU settings. The mortality rate in patients with MV was higher in non-ICU settings than in ICU settings, even after multivariate analysis. Considering that the cri-teria used to select patients for entry to ICUs is unclear, there may be a group of patients who may benefit from being treated in ICUs but are treated in non-ICU settings. Future research that includes clinically relevant data on patients with MV is needed to identify the factors that can help improve outcomes in these patients.
Additional files
Additional file 1:Table S1.Candidate disease variables associated with hospital mortality rates, and their World Health OrganizationInternational classification of diseases and related health problems 10th revision.(DOCX 29 kb)
Additional file 2:Figure S1.Calibration plot of the logistic regression model. Hospital mortality risk values predicted by our model matched the observed risk values. (JPG 34 kb)
Abbreviations
AMI:Acute myocardial infarction; APACHE: Acute Physiology and Chronic Health Evaluation; CNS: Central nervous system; CV: Central vein; DPC: Diagnosis procedure combination; EN: Enteral nutrition; ICU: Intensive care unit; MV: Mechanical ventilation; QIP: Quality indicator/improvement project; ROC: Receiver operating characteristic; RRT: Renal replacement therapy; SAH: Subarachnoid hemorrhage; SOFA: Sequential Organ Failure Assessment
Acknowledgements
The manuscript has been edited carefully by two native-English-speaking professional editors from ELSS, Inc. (elss@elss.co.jp,http://www.elss.co.jp).
Funding
Not applicable.
Availability of data and materials
The datasets during and/or analyzed during the current study available from the corresponding author on reasonable request.
Authors’contributions
YI analyzed and drafted the manuscript and was a major contributor in writing the manuscript, KY and HI analyzed the data from the statistical view point, MS drafted the manuscript, and YI analyzed and drafted the manuscript. All authors read and approved the final manuscript.
Ethics approval and consent to participate
Not applicable.
Consent for publication
Not applicable.
Competing interests
The authors declare that they have no competing interests.
Publisher’s Note
Springer Nature remains neutral with regard to jurisdictional claims in published maps and institutional affiliations.
Author details 1
Emergency and Critical Care Center, Mie University Hospital, 2-174 Edobashi, Tsu, Mie, Japan.2Department of Healthcare Economics and Quality Management, Kyoto University, Yoshida Konoe-cho, Sakyo-ku, Kyoto 606-8501, Japan.3Jichi Medical University Saitama Medical Center, 1-847 Amanuma, Saitama, Saitama, Japan.
Received: 12 March 2018 Accepted: 29 October 2018
References
1. Carson SS, Cox CE, Holmes GM, et al. The changing epidemiology of mechanical ventilation: a population-based study. J Intensive Care Med. 2006;21(3):173–82.
2. Behrendt CE. Acute respiratory failure in the United States: incidence and 31-day survival. Chest. 2000;118(4):1100–5.
3. Uchino S. Are Japanese ICUs properly utilized? J Jpn Soc Intensive Care Med. 2010;17:141–4.
4. Wunsch H, Angus DC, Harrison DA, et al. Variation in critical care services across North America and Western Europe. Crit Care Med. 2008;36:2787–93. 5. Sirio CA, Tajimi K, Taenaka N, et al. A cross-cultural comparison of critical
care delivery: Japan and the United States. Chest. 2002;121:539–48. 6. Iwashita Y, Sanui M, Imai H. An attitude survey on doctors treating critically
ill patients in hospitals without ICU facilities. J Jpn Assoc Acute Med. 2016; 27:175–83.
7. Umegaki T, Sekimoto M, Hayashida K, et al. An outcome prediction model for adult intensive care. Crit Care Resusc. 2010;12:96–103.
8. Duke GJ, Santamaria J, Shann F, et al. Critical care outcome prediction equation (COPE) for adult intensive care. Crit Care Resusc. 2008;10:35–41. 9. Duke GJ, Barker A, Rasekaba T, et al. Development and validation of the
critical care outcome prediction equation, version 4. Crit Care Resusc. 2013; 15:191–7.
10. Sinufuu T, Kahnamoui K, Cook DJ, et al. Rationing critical care beds: a systematic review. Crit Care Med. 2004;32:1588–97.
11. Tang WM, Tong CK, Yu WC, et al. Outcome of adult critically ill patients mechanically ventilated on general medical wards. Hong Kong Med J. 2012; 18:284–90.
12. Hersch M, Sonnen M, Karlic A, et al. Mechanical ventilation of patients hospitalized in medical wards vs the intensive care unit–an observational, comparative study. J Crit Care. 2007;22:13–7.
13. Quartin AA, Campos MA, Maldonado DA, et al. Acute lung injury outside of the ICU: incidence in respiratory isolation on a general ward. Chest. 2009; 135(2):261–8.
14. Ferguson ND, Frutos-Vivar F, Esteban A, et al. Clinical risk conditions for acute lung injury in the intensive care unit and hospital ward: a prospective observational study. Crit Care. 2007;11(5):R96.
15. Kallen AJ, Patel PR, OGrady NP. Preventing catheter-related bloodstream infections outside the intensive care unit: expanding prevention to new settings. Clin Infect Dis. 2010;51(3):335–41.
16. Fieselmann JF, Bock MJ, Hendryx MS, et al. Mechanical ventilation in rural ICUs. Crit Care. 1999;3(1):23–31.