Diagnostic value of gas exchange tests in patients with clinical
suspicion of pulmonary embolism
Renato Prediletto*, Massimo Miniati*, Lucia Tonelli
†, Bruno Formichi*,
Giorgio Di Ricco*, Carlo Marini
†, Carolina Bauleo
†, Germana Allescia
†,
Franca Cocci
†, Simonetta Monti
†, Massimo Pistolesi
‡and Carlo Giuntini
†Objective: To assess the value of parameters derived from arterial blood gas tests in the diagnosis of pulmonary embolism.
Method: We measured alveolar–arterial partial pressure of oxygen [P(A–a)O2] gradient, PaO2and arterial partial pressure of carbon diaxide (PaCO2) in 773 consecutive patients with suspected pulmonary embolism who were enrolled in the Prospective Investigative Study of Acute Pulmonary Embolism.
Diagnosis: The study design required pulmonary angiography in all patients with abnormal perfusion scans.
Results: Of 773 scans, 270 were classified as normal/near-normal and 503 as abnormal. Pulmonary embolism was diagnosed by pulmonary angiography in 312 of 503 patients with abnormal scans. Of 312 patients with pulmonary embolism, 12, 14 and 35% had normal P(A–a)O2, PaO2and PaCO2, respectively. Of 191 patients with abnormal scans and negative angiograms, 11, 13 and 55% had normal P(A–a)O2, PaO2and PaCO2, respectively. The proportions of patients with normal/near-normal scans who had normal P(A–a)O2, PaO2and PaCO2 were 20, 25 and 37%, respectively. No differences were observed in the mean values of arterial blood gas data between patients with pulmonary embolism and those who had abnormal scans and negative angiograms. Among the 773 patients with suspected pulmonary embolism, 364 (47%) had prior
cardiopulmonary disease. Pulmonary embolism was diagnosed in 151 (41%) of 364 patients with prior cardiopulmonary disease, and in 161 (39%) of 409 patients without prior cardiopulmonary disease. Among patients with pulmonary embolism, there was no difference in arterial blood gas data between patients with and those without prior CPD.
Conclusion:These data indicate that arterial blood gas tests are of limited value in the diagnostic work-up of pulmonary embolism if they are not interpreted in conjunction with clinical and other laboratory tests.
Addresses: *Istituto di Fisiologia Clinica del Consiglio Nazionale Delle Ricerche and
†Dipartimento di Cardiologia, Angiologia e
Pneumologia, Universita’ Degli Studi di Pisa, Pisa, and ‡Dipartimento di Fisiopatologia Clinica,
Universita’ degli Studi di Firenze, Firenze, Italy
Sponsorship: This study was supported by grants from the CNR Targeted Project Prevention and Control of Disease Factors subproject 8, Control of Cardiovascular Pathology 8.5.1, No. 9103611-PF41, from the Ministry of Health and Ministry of University and Scientific and Technological Research of Italy.
Correspondence: Renato Prediletto, MD, Reparto Polmonare, Istituto di Fisiologia Clinica del CNR, Via Savi 8, 56100 Pisa, Italy. Tel: +39 50 583111; fax: +39 50 553461;
e-mail: predile@ nsifc.pi.cnr.it
Keywords:arterial blood gas tests, gas exchange,
pulmonary embolism
Received: 26 May 1998
Revisions requested: 20 April 1999 Revisions received: 12 July 1999 Accepted: 14 July 1999 Published: 30 July 1999
Crit Care1999, 3:111–116
The original version of this paper is the electronic version which can be seen on the Internet (http://ccforum.com). The electronic version may contain additional information to that appearing in the paper version.
© Current Science Ltd ISSN 1364-8535
Introduction
Data from the Prospective Investigation of Pulmonary Embolism Diagnosis [1] indicated that arterial blood gas data are of insufficient value to rule out the diagnosis of pulmonary embolism (PE). In fact, Stein et al [2] showed, with various combinations of normal arterial blood gas values, that PE could be excluded in no more than 30% of the patients with prior cardiopulmonary disease (CPD) and in 14% of those without. The low diagnostic yield of blood gas tests was further supported by another study [3] in which a normal alveolar–arterial partial pressure of oxygen [P(A–a)O2] gradient was
present in some 20% of the patients with angiographi-cally documented PE.
On the contrary, McFarlane and Imperiale [4] found a normal P(A–a)O2in only 2% of the patients with confirmed PE, and concluded that blood gas analysis is of great value in excluding the diagnosis of PE. Similarly, it has been reported that the finding of PaO2 greater than 80 mmHg could virtually eliminate the possibility of the disease [5].
In this discrepant scenario [6,7], it appears of interest to explore further the value of parameters derived from arterial
blood gas analysis, namely P(A–a)O2 gradient, PaO2 and arterial partial pressure of carbon dioxide (PaCO2), in the diagnostic work-up of PE. Patients reported on in this paper were enrolled in the Prospective Investigative Study of Acute Pulmonary Embolism Diagnosis (PISA-PED) [8,9].
Methods
The PISA-PED study was aimed at assessing the role of perfusion lung scan (without ventilation imaging) in the diagnosis of PE [8]. The study design required pulmonary angiography in all patients with abnormal lung scans. Before angiography all patients had to sign an informed consent form. Pulmonary angiography was omitted in patients with normal/near-normal scans because such a scintigraphic pattern rules out clinically significant PE. The study was approved by the Ethics Committee of our Institution.
Here we report the results obtained in 773 consecutive patients who were referred to our Institution for suspected PE. Shortly before perfusion lung scanning, arterial blood samples were obtained in all patients while they were breathing room air in order to avoid any interference caused by the administration of supplemental oxygen. On evaluating blood gas data, patients were also grouped according to whether they had or had not prior CPD. These included chronic cardiovascular disease, ischaemic heart disease, hypertension, arterial disorders, previous history of PE and/or deep vein thrombosis (DVT), dia-betes, chronic obstructive pulmonary disease and intersti-tial lung disease. Any degree of physical abnormality (long-term oxygen therapy, severely ill chronic obstructive pulmonary disease patients, tracheostomy, home ventila-tion) was not considered as an exclusion criterion.
The analyses of arterial blood gas values were made among patients with confirmed PE and those in whom the disease was excluded, either by a negative angiogram or by the finding of a normal/near-normal scan, and between patients with and without prior CPD.
Arterial blood gas and alveolar–arterial partial pressure of oxygen gradients
The measurements of arterial blood gases were obtained shortly before lung scanning while the patients were breathing room air. The P(A–a)O2gradient was calculated according to the following formula [2,10]:
P(A–a)O2= [150 – (1.25 × PaCO2)] – PaO2
The arterial bood gas determinations were obtained using IL 1650 blood gas analyzer (Instrumentation Laboratory, Milano, Italy).
P(A–a)O2 gradient, PaO2, and PaCO2 were considered normal if they were below 20 mmHg, greater than 80 mmHg and greater than 35 mmHg, respectively.
Regard-ing P(A–a)O2 gradient, we also calculated a normal value adjusted for age, according to the following formula [4,11]:
Age-adjusted P(A–a)O2gradient = (age/4) + 4
Data analysis
Blood gas data were stored in a computer to create a data-base from which the frequency and distributions of the chosen variables were derived. The unpaired t-test was used to compare continuous variable means in patients with and in those without PE. The χ2test with Yates’
cor-rection was used to compare the prevalence of normal arterial blood gas values in patients with and in those without PE. P< 0.05 was considered statistically signifi-cant. Unless stated otherwise, continuous variables are reported in the text as means ± standard deviation [12].
Results
Patient characteristics and prevalence of pulmonary embolism
Of the 773 patients who were enrolled in the prospective study, 270 had normal/near-normal lung scans, and 503 had abnormal scans. PE was diagnosed by angiography in 312 patients with abnormal scans and it was excluded in 191. Thus, the overall prevalence of PE was 40% (312/773). Patients with confirmed PE were 64 ± 15 years of age, with a male:female ratio of 1.06. Patients with abnormal scans in whom pulmonary angiography excluded PE were aged 67 ± 12 years with a male:female ratio of 1.0. Patients with normal/near-normal scans were significantly (P< 0.01) younger than those of the other two groups (mean age 61 ± 12 years, male : female ratio 0.7).
Of the 312 patients with confirmed PE, 151 (48%) had prior CPD. Of the 461 patients in whom PE was excluded, 213 (46%) had prior CPD.
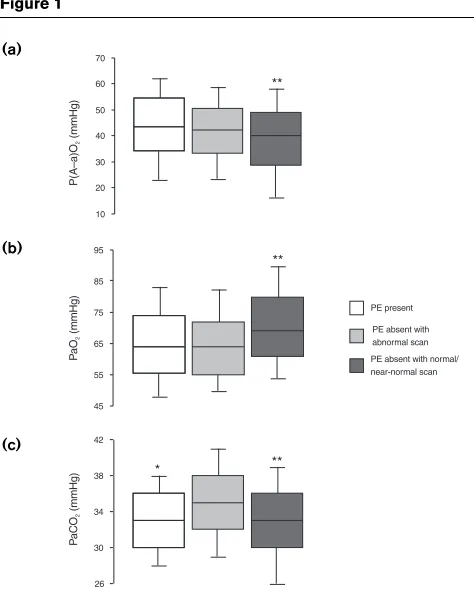
Alveolar–arterial partial pressure of oxygen gradients As shown in Table 1, a P(A–a)O2lower than 20 mmHg was found in nearly equal proportions in patients with angio-graphically proven PE and in those with abnormal scans and negative angiograms. Patients without PE who had normal/near normal scans had a higher prevalence of normal P(A–a)O2 than the other two groups. Among patients with PE, the P(A–a)O2 was on the average 44±15mmHg (range 1–78mmHg), and it was 42 ± 14 mmHg (range 1–76 mmHg) in patients with abnormal scans and no evidence of PE on angiography (P= 0.12). Among patients with normal/near-normal perfusion scans, the P(A–a)O2 was on the average 39 ± 16 mmHg (range 1–83 mmHg), and it was significantly different from that of both patients with PE (P= 0.0001) and patients without PE who had abnormal perfusion scans (P= 0.040).
with PE 50% had a P(A–a)O2 gradient greater than 44 mmHg. Thus, it appears that PE is often accompanied by significant gas exchange abnormalities. However, as many as 50% of the patients with abnormal scans and neg-ative angiograms had a P(A–a)O2 gradient greater than 42 mmHg (Fig. 1).
Considering the P(A–a)O2 gradient corrected for age [4], 7% of the patients with PE had a normal age-corrected oxygen gradient. Among patients without PE, the propor-tion of normal age-corrected P(A–a)O2 gradients was sig-nificantly higher than in patients with confirmed PE (Table 1).
Arterial oxygen tension
As shown in Table 1, a normal PaO2was found in equal proportions in patients with angiographically proved PE and in patients with abnormal scans in whom PE was excluded by pulmonary angiography. The prevalence of normal PaO2 values was significant higher in patients with normal/near-normal lung scans. Among patients with PE, the PaO2was on average 65 ± 13 mmHg (range 31–108 mmHg) and it was 65 ± 15 mmHg (range 35–128 mmHg) in patients without PE who had abnor-mal lung scans (P= 0.94). Among patients with normal/near-normal scans, the PaO2 was on average 71 ± 15 mmHg (range 37–129 mmHg) and it was signifi-cantly different from that in both patients with PE (P= 0.0001) and patients without PE who had abnormal scans (P= 0.0001).
As shown in Figure 1, most of the patients with PE had hypoxaemia, but there was a large overlap of PaO2 values between patients with angiographically proved PE and those with abnormal scans who had no evidence of PE on angiography. In the latter group, as many as 50% of patients had PaO2lower than 65 mmHg. The fre-quency distribution of PaO2 values in patients with normal/near-normal lung scans was significantly
[image:3.609.54.563.119.243.2]differ-ent from that of patidiffer-ents (with or without PE) who had abnormal scans.
Table 1
Frequency of normal arterial blood gas tests in patients with and without pulmonary embolism (PE)
PE present PE absent
abnormal scan* Normal/near-normal scan
n % n % n %
P(A–a)O2< 20 mmHg 37/312 12‡ 21/191 11¶ 53/270 20
P(A–a)O2age corrected† 22/312 7‡§ 23/191 12 43/270 16
PaO2> 80 mmHg 44/312 14‡ 25/191 13¶ 68/270 25
PaCO2> 35 mmHg 110/312 35§ 105/191 55¶ 99/270 37
*Patients in whom PE was excluded by angiography. †Normal values
adjusted for age. ‡Different from those with normal/near-normal scan
and §different from those with abnormal scan. ¶Different from those
with normal/near-normal scan.
Figure 1
Box-whisker plots of (a)alveolar–arterial partial pressure of oxygen [P(A–a)O2] gradient, (b)arterial partial pressure of oxygen (PaO2) and
(c)arterial partial pressure of carbon dioxide (PaCO2) in patients with and without pulmonary embolism (PE) who had abnormal lung scan or normal/near-normal lung scans. Horizontal line in box is 50th centile (median); limits of box are 25th and 75th centiles; whiskers are 10th and 90th centiles. *P= 0.001 between patients with and without PE who had abnormal scans, by unpaired t-test; **P= 0.04–0.001 between patients with normal/near-normal lung scans and patients with or without PE who had abnormal scans, by unpaired t-test.
10 20 30 40 50 60 70
45 55 65 75 85 95
26 30 34 38 42
PE present PE absent with abnormal scan PE absent with normal/ near-normal scan **
** *
**
P(
A–a)
O
(m
m
H
g)
2
P
a
O
(mmHg
)
2
P
a
CO
(mmHg
)
2
(a)
(b)
[image:3.609.315.552.290.591.2]Arterial carbon dioxide tension
As shown in Table 1, a significantly lower proportion of patients with PE had a normal PaCO2 as compared with patients with abnormal scans and negative angiograms. However, patients with normal/near-normal lung scans had normal PaCO2 values in the same proportion as patients with PE. Among patients with PE, the PaCO2 was on average 33 ± 4 mmHg (range 20–46 mmHg) and it was 35 ± 5 mmHg (range 24–53 mmHg) in patients without PE who had abnormal scans (P= 0.0001). Among patients with normal/near-normal lung scans, the PaCO2 was on average 33 ± 5 mmHg (range 17–47 mmHg), and it was sig-nificantly different from that of patients in whom PE was excluded on angiography (P= 0.0001).
Prior cardiopulmonary diseases
PE was diagnosed in 151 (41%) of 364 patients with prior CPD and in 161 (39%) of 409 without prior CPD. As shown in Table 2, among the 364 patients with prior CPD, a normal P(A–a)O2 gradient and a normal PaO2 were found with nearly equal frequencies in patients with PE and in those in whom the disease was excluded either by a negative angiogram or by the finding of a normal/near-normal scan. On the contrary, the prevalence of a normal/near-normal PaCO2was significantly lower in patients with PE than in those without.
Among patients without prior CPD, a normal P(A–a)O2 gradient and a normal PaCO2 were found in similar pro-portions in patients with and without PE. By contrast, the proportion of patients with PE who had a normal PaO2 was significantly less than that of patients in whom the disease had been excluded.
The frequency distributions of P(A–a)O2, PaO2 and PaCO2values in patients with and without PE who had or did not have prior CPD are shown in Figure 2. Of the patients with PE and no prior CPD 50% had a P(A–a)O2 gradient equal to or less than 45 mmHg, a PaO2equal to or less than 62 mmHg and a PaCO2 equal to or less than
33 mmHg. In patients with PE who had prior CPD, the median values of P(A–a)O2, PaO2and PaCO2were 42, 66 and 33 mmHg, respectively (Fig. 2). Thus, it appears that the presence of prior CPD does not significantly influence the pattern of gas exchange abnormality in patients with confirmed PE.
Discussion
Arterial blood gases have been extensively evaluated in the diagnostic work-up of patients with suspected PE. In some reports [4,7,13–15] the finding of arterial blood gas abnormalities was regarded as a valid tool to diagnose or exclude PE, thereby restricting the need for further diag-nostic testing. More recent reports [2,3], however, have indicated that blood gas data are of insufficient value to permit the exclusion of PE.
The present study was aimed at assessing the role of arter-ial blood gas tests in the diagnostic evaluation of patients with suspected PE who were enrolled in the PISA-PED study [8,9]. From the reported data it appears that only a minority of patients with angiographically proved PE have normal P(A–a)O2gradient, PaO2and PaCO2; that patients with abnormal perfusion scans and no evidence of PE on angiography exhibit arterial blood gas abnormalities similar to those of patients with confirmed PE; that patients without PE and normal/near-normal scans tend to have a less severe degree of gas exchange impairment than do patients with abnormal scans; and that the presence of prior CPD does not significantly affect the pattern of gas exchange abnormality in patients with confirmed PE.
[image:4.609.56.558.129.237.2]Our results confirm previous data from Jones et al [14], who evaluated the usefulness of the P(A–a)O2gradient for diagnosing PE in elderly patients. In that study, the P(A–a)O2 gradient in patients with angiographically proved PE did not differ from that of patients with nega-tive angiograms. The authors concluded that, in the elderly, an elevated P(A–a)O2gradient is entirely nonspe-cific and of little value in the diagnosis of acute PE. Table 2
Frequency of normal arterial blood gas tests in patients with and without pulmonary embolism (PE) who had or had no prior cardiopulmonary disease (CPD)
Prior CPD (n= 364) No prior CPD (n= 409)
PE present PE absent PE present PE absent
n % n % n % n %
P(A–a)O2< 20 mmHg 20/151 13 40/213 19 17/161 11 34/248 14
PaO2> 80 mmHg 25/151 17 45/213 21 17/161 11* 48/248 19
PaCO2> 35 mmHg 54/151 36* 103/213 48 56/161 35 101/248 41
In the study by Powrie et al[16], nearly 58% of pregnant women with documented PE had P(A–a)O2gradients that were normal. It was concluded that arterial blood gas tests should not be used to determine the likelihood of PE, not only in pregnant women, but also in all patients suspected of having PE, because this could lead to improper thera-peutic decisions.
That the finding of a normal PaO2 does not necessarily exclude the diagnosis of PE was also documented by Overton and Bockton [17], who found normal PaO2values in 7% of patients with established PE.
A recent study aimed at calculating the likelihood ratios for PE of the arterial blood gas tests [15] showed that the presence of any blood gas abnormality does not substan-tially increase the likelihood of PE. That study concluded that, not only does a normal arterial blood gas value fail to exclude the diagnosis of the disease, but that even an abnormal arterial blood gas value does not appreciably increase the likelihood of PE.
In contrast, there have been two studies in the literature [4,13] that supported the usefulness of normal blood gas
data in excluding the diagnosis of PE. In the study by Cvi-tanic and Marino [13], a normal P(A–a)O2gradient and a normal PaCO2 were found in 5% and in less than 1% of the patients with PE, respectively. That study, however, was restrospective in design and included only patients with angiographically documented PE in the analysis. In the study by McFarlane and Imperiale [4], 489 patients had ventilation–perfusion lung scans and simultaneous room air determinations of arterial blood gases. PE was diagnosed in 15% of these patients, but only 2% of the patients who had normal P(A–a)O2 gradients and no history of previous PE or DVT had PE. Thus, according to these authors, a normal P(A–a)O2 gradient in patients without previous PE or DVT makes the diagnosis of PE very unlikely. In that study, however, the prevalence of PE was low compared with that reported in other large prospective studies [1,8]. Furthermore, relatively few patients with PE and ventilation–perfusion scans inter-preted as low or intermediate probability were included in the analysis [4]. Such patients are likely to have normal arterial blood gas tests [2].
Our prospective study included a large number of unse-lected patients who were referred for lung scanning with suspected PE [8,9]. All patients were evaluated according to a standardized protocol including detailed clinical history, physical examination, electrocardiogram, chest radiograph and arterial blood gas analysis [8,9]. Among patients with angiographically proved PE, the severity of the disease, as assessed by counting the number of unper-fused lung segments on the lung scan, ranged over a wide spectrum, from minor to massive [9].
The present data indicate that the measurement of arterial blood gases cannot be used, in itself, to confirm or exclude the diagnosis of PE, because of the large overlap of data between patients with and without PE. This does not imply that the information derived from arterial blood gas tests should be disregarded, but rather suggests that arter-ial blood gas data should be evaluated in conjunction with other clinical and laboratory data (eg the electrocardiogram, the chest radiograph and the lung scan) [9]. In our experi-ence, the measurement of arterial blood gases is extremely useful, along with the lung scan, to monitor the evolution of PE as a function of anticoagulant therapy [18].
Acknowledgements
The authors thank the medical staff of the Postgraduate School in Pulmonology of the University of Pisa for their invaluable help in performing perfusion lung scans; and Armando Perissinotto, Albero Pollastri, Loredana Salis and Nilo Faraoni for their excellent technical assistance.
References
1. PIOPED Investigators: Value of the ventilation-perfusion scan in acute PE: results of the Prospective Investigation of Pulmonary
[image:5.609.57.284.92.375.2]Embolism Diagnosis (PIOPED).JAMA1990, 263:2753–2759.
Figure 2
Box-whiskers plots of (a)alveolar–arterial partial pressure of oxygen [P(A–a)O2] gradient, (b)arterial partial pressure of oxygen (PaO2) and
(c)arterial partial pressure of carbon dioxide (PaCO2) in patients with
and without pulmonary embolism (PE), who had or did not have prior cardiopulmonary disease (CPD).
40 50 60 70 80 90 10 20 30 40 50 60 70
26 30 34 38 42
Prior CPD No Prior CPD
PE PE b
P(
A–a)
O
(m
m
H
g)
2
P
a
O
(mmHg
)
2
P
a
CO
(mmHg
)
2
(a)
(b)
2. Stein PD, Goldhaber SZ, Henry JW: Alveolar–arterial oxygen
gradi-ent in the assessmgradi-ent of acute pulmonary embolism. Chest1995,
107:139–143.
3. Stein PD, Goldhaber SZ, Henry JW, Miller AC: Arterial blood gas analysis in the assessment of suspected pulmonary embolism.
Chest1996, 109:5–6.
4. McFarlane MJ, Imperiale TF: Use of the alveolar–arterial oxygen
gradient in the diagnosis of pulmonary embolism. Am J Med1994,
96:57–62.
5. Mayeski RJ: PE.In Diagnostic Strategies for Common Medical Prob-lems. Edited by Panzer RJ, Black ER, Griner PF. Philadelphia, PA: American College of Physicians; 1991:260–269.
6. Robin ED, McCarley RF: The diagnosis of pulmonary embolism.
When will we ever learn?Chest1995, 107:3–4.
7. Bennett JC: Use of alveolar–arterial oxygen gradient in the
diagno-sis of PE.Am Med J1995, 99:330–331.
8. Miniati M, Pistolesi M, Marini C, et al(The PISA-PED Investigators):
Value of perfusion lung scan in the diagnosis of pulmonary embolism: results of the Prospective Investigative Study of Acute
Pulmonary Embolism Diagnosis (PISA-PED). Am J Respir Crit
Care Med1996, 154:1387–1393.
9. Miniati M, Prediletto R, Formichi B, et al: Accuracy of clinical
assess-ment in the diagnosis of pulmonary embolism.Am J Respir Crit
Care Med1999, 159:864–871.
10. Guenter CA: Respiratory function of the lung and blood.In: Pul-monary Medicine, 2nd ed. Edited by Guenter CA, Welch MH. Philadelphia: JB Lippincott; 1982:168.
11. Skorodin MS: Respiratory diseases and A–a gradient
measure-ment.JAMA1984, 252:1344.
12. Altman DG: Practical Statistics for Medical Research, 1st edn. London: Chapman & Hall; 1991.
13. Cvitanic O, Marino PL: Improved use of arterial blood gas analysis
in suspected PE.Chest1989, 95:48–51.
14. Jones JS, Van Deelen N, White L, Dougherty J: Alveolar–arterial
oxygen gradients in elderly patients with suspected PE.Am Emerg
Med1993, 22:1177–1181.
15. Ely EW, Smith JM, Haponik EF: PE and normal oxygenation:
appli-cation of PIOPED derived likelihood ratios.Am J Med1997, 103:
541–544.
16. Powrie RO, Larson L, Rosene-Montella K, Abarca M, Barbour L, Tru-jillo: Alveolar–arterial oxygen gradient in acute PE in pregnancy.
Am J Obstet Gynecol1998, 178:394–396.
17. Overton DT, Bockton JJ: The alveolar–arterial oxygen gradient in
patients with documented PE. Arch Intern Med 1998, 148:
1617–1619.
18. Prediletto R, Paoletti P, Fornai E, et al: Natural course of treated pul-monary embolism. Evaluation by perfusion lung scintigraphy, gas

![Figure 2data in excluding the diagnosis of PE. In the study by Cvi-tanic and Marino [13], a normal P(A–a)O2 gradient and a(a)normal PaCO were found in 5% and in less than 1% of](https://thumb-us.123doks.com/thumbv2/123dok_us/8347566.308085/5.609.57.284.92.375/figure-excluding-diagnosis-study-marino-normal-gradient-normal.webp)
![5 Methyl 2 methylsulfanyl 7 phenylpyrazolo[1,5 a]pyrimidine 3 carbonitrile](data:image/gif;base64,R0lGODlhAQABAIAAAP///wAAACH5BAEAAAAALAAAAAABAAEAAAICRAEAOw==)