,
/
-
,
-~--- -- --- -- ,-
---
-MINISTRY OF EDUCATION, SCIENCE AND SPORTS
TRAINING AND WORKING MANUAL
POLICY RESEARCH, MONITORING AND EVALUATION
FOR DISTRICT AND REGIONAL EDUCATION PERSONNEL
DEVELOPED BY
POLICY RESEARCH, MONITORING AND EVALUATION UNIT, PBME DIVISION
I
I' '
-TABLE OF CONTENTS
PAGES
LIST OF ACRONMYS S
LIST OF TABLES AND FIGURES 6
PREFACE 7
INTRODUCTION 8
n
I
ACKNOWLEDGEMENT 9
MODULE 1: The Concept of Monitoring and Evaluation 10
1.1 What is the
impoitlilce ofM&E?
101.2 How
IbouId
MAEbe
carried out? 101.3
WhO lie
tbe by pJa"enin
MAE?
1 0
1.4 WhIt . .die
oompdWCiCl1o be achieved by Participants? 11I.S
Key Qaestioa: What is the difference between M&E? 111.6 Summary
noces
11MODULE 2: Indicators 12 _
2.1 What are Educational Indicators 12 2.2 Why are Educational Indicators important 12 2.3 What should we know about Educational Indicators 12 2.4 What should we do to track our district educational indicators12
2.S
How can the trKking of Educational Indicator.; improve 13the quality of education
2.6 Key Questions 13
r.T~No~ IS
2.7.1 Effectiveness and Efficiency Indicators 16
-MODULE 3: Schooling 16
3.1 What is schooling? 16
Looking at Indicators which best measure its dimension
MODULE 4: Formulating M&E Plans
4.1 What is a district M&E plan?
4.2 How do we formulate an effective M&E Plan? 4.3 Who are the Key players to be involved? 4.4 Key Question: What formal should M&E take?
4.5 Summary Notes
2
18
18-18
18
-19_ 19-6.3.4 Senior Secondary School 35 6.3.5 Technical Vocational Education and Training 36
6.3.6 Non-Formal Education 36
6.3.7 Education Manapment 37
6.4 Mooitoring Visits to Schools 38
6.5 Capacity Strengthening 39
6.6 Punctuality and Absenteeism 39
6.7 Financial Report 39
6.8 Non-Govemment Organisation in Education 42
6.9 Infrutructure Profile 43
6.10 Assessment of Classroom Furniture 45 6.11 Assessment of Teaching and Learning materials 45 6.12 Education Payroll Expenditure 46
6.13 Staff Attrition 46
MODULE 7: How to plan a useful evaluation
7.1
Introduction
7.2 Impact Evaluation7.3 Participatory
Evaluation Methods MODULE 8:Selection of a sample
8.1
Simple Random sample 8.2 Cluster sampling 8.3 Systematic sampling 8.4 Stratified samplingMODULE 9: Log Frame for Policy Research and Evaluation for RegionallDistrict Directorates of Education
MODULE 10: Strategic Staircase Techniques
10.1 Tracking of Policy Intervention 10.2 Solution Framework
Group Work I: Tracking Impact oCPolicies
Group Work II: Selection of a Sample and developing a composite index Group Work III: District! Region develop their respective M&E Log Frame Group Work IV: Developing an Improvement Plan and reporting Fonnat Group Work V: Reporting System
Tentative Time Table
Appendix I: Primary Education. Measuring Policy Intervention to bridge the Gap: Urban, Peri-Urban and Deprived
Appendix II Fonnulae for key indicators Appendix III: Definitions of Key Indicator.;
Appendix IV: Assignment
References
4
...
n
SO
50
n
54 5S
58
n
l
59
6060
n
60
-61
n
63
n
63
n
6S
~
66
I
66
66
66
67
~n
73
-7S
-75
76
76
-LIST OF ACRONYMS
:~)f~
:
~.s;r:ti
:-
Jiii;
--
- . -:
}~¥:~:.
:r.
.1
V::
_
ABBREVJA! ONS
1\ND
:ACRONYMS
-ADPR Annual District Perfonnance Reports
ADEOP
Annual District Education O~erational PlanBECE Basic Education Certificate Examination DEO District Education Office
DESAR
District Education Strategic Annual ReviewDPR District Performance report
Dl
D~pa.1iL'y IndexEDl Education for All Development Index
EFA Education
For
AllEMlS Education Management Infonnation Systems ESP Education Strategic Plan
GER Gross Enrolment ratio
GW
Group WorkMOO Millennium Development Goals M&E Monitoring and Evaluation
NER
Net Enrolment rateNGO
Non-Govemmental OrganisationREO
Regional Education OfficeSPIP School Performance lmprovement Programme SSCE Senior Secondary School Certificate Examination
LIST OF TABLES AND FIGURES
Table2.6.5 Advantage of Quantitative and Qualitative data Table 5.3.1.1 Calculating the EDI
Table 5.3.1.2 The Disparity Index
Table 6.7.1 Budget Execution (to be completed)(2005/06) Table 6.7.2 Budget Utilization
Table 6.8.1 Registration ofNGOs Table 6.8.2 Interventions from NGOs
Table 6.9.1 Infrastructure Profile in Public Schools Table 6.9.2 Project Appraisal Activity Code Approach Table 6.10.1 Assessment of Classroom furniture
Table 6.11.1 Assessment of Teaching and Learning materials Table 6.12.1 Education Payroll Expenditure
Table 6.13.1 Staff Attrition
Table 6.14.1 Illness / Accidents / Suicide (Teachers) Table 6.15.1 Illness / Accidents / Suicide (Non- Teachers) Table 6.16.1 Students/Pupils Deaths per Year
Table 9.1: Log Frame for Policy Research, Monitoring and Evaluation Policy Research
Table 9.2: Log Frame for Policy Research, Monitoring and Evaluation Monitoring and Evaluation
Table 10.1 Strategic Staircase Technique TableGW II
TableGW IV
Figure 3.1 Core Business in Education
Figure 3.2 Learning model of Four "Environmental Factor" Figure 5.3. I. 1 Tracking progress in EFA targets
Figure 5.3.1.2 Disparity Index
Figure 5.4.1 Analysis of Financial Statements and reports Figure 5.5.1 Comparative analysis of BECE results Figure 5.6.1 Trend in Percentages passes of SSCE
6
-PA ...
-~
-..
4
-
..
I
6
-
I
\J6
.~1
-
1~.
l'
.~
: I
2'
1
PREFACE
Weak monitoring and evaluation in the districts and schools has been identified as one of the key challenges confronting education delivery in the country
As part of the strategy to ensure perfonnance accountability based on the results which the
Education sector aspires to attain the existing policy research. monitoring and evaluation systems
in the education sector has been reviewed.
Two levels of Monitoring and Evaluation are being considered:
• Synoptic (Birds Eye) monitoring and evaluation where infonnation is aggregated and analysed at a system-wide level to provide inputs into sector level reports
• Operational monitoring and evaluation for districts and schools management on the ground to make well-informed decisions and take strategic actions in the districts
~ including among others resource allocation; salary costing and payroll management;
teacher deployment and utilization; implementation of the GES study leave and distance
education policies.
This training manual has been develo d
to~dresS
the chalJenges identified with the current system for Monitoring and Evaluation. ~e use of this training and working manual will thus have a downstr tmpact on GES operations. The manual will become the main instrument for regional and district education officers to consult whenever necessary on how to proceed with policy research, monitoring and evaluationin
the regions districts and schools. The manual also introduced good management practices such as the "Public Expenditure Tracking Surveys (PETS) • as one of the standard tools to be used to enhance the efficient financial management inthe schools.
The Ministry as a start will train one (1) officer each from the Regional Office and two (2) office.rs each from the District Offices including the Regional and District Directors of Education. The RegionallDistrict Directorates of Education in collaboration with the School Management
Committees (SMC) and District Education Oversight Committees (OEOC) are to form strong monitoring teams in the regions. districts and schools to enhance education delivery in the
country.
This training is an important contribution to the process of decentralizing the delivery of
J
education services. The Ministry is fully committed to that process and believesit
will improvethe education system's efficiency and responsiveness. Policy Research. Monitoring and
Evaluation at all levels of the Ministry is a critical strategy in achieving this.
7
INTRODUCTION
The Ministry of Education. cience and Sports is under increasing pressure to use result-oriented approach to demonstrate and produce results that will improve quality delivery of education especially in the Public Basic School in the country.
The policy research, monitoring and evaluation (PRME) techniques in the manual wil.l encourage
-the education offices in -the regions and djstricts to better understand their own education status,
assume responsibility for meeting the real changes that are necessary through optimum allocation
of resources and taking rcle ant tep to enhance decentralization.
This training manual will thus strengthen the existing monitoring and evaluation structures and systems in place to provide a practical. action-oriented programme.
The manual is an important contribution to the proce s of decentralizing the delivery of education ervices. The DEO is now the primary management
urnt
directing and reporting on education service delivery. DEOs will be Increasingly responsible for programme planrung. financial management and administration. monitoring and evaluation of programme performance, financial flows and human resource management. It is therefore critical that every effort is made to buildthe capacity of the district education officials. This i one of the important steps in this process .
...
The manual will also facilitate the introduction of good management practices such as "Public Expenditure Trac\cing urveys (PETS): preparation of di trict performance reports district annual operational plan need asse menlo capitation grant management, teacher development classroom con truction plan, annual regionaVdislrict ector reviews and the use of evaluation findings to foster organizational learning, transparency and accountability at the district level to
enhance quality feedbacks aDd reports. This will improve existing interventions and support the design of new one as well as to repo irion the Ministry to use the infonnation to improve its existing strategic plans or simply to bargain for additional resources.
8
-n
ACKNOWLEDGEMENT
We are grateful to JICA and UNICEF that funded the production of this manual and the training of the Regional and District Directorate staff in policy research. monitoring and evaluation techniques. Satomi Kamei, JICA Advisor and Peter De Vries, Education Specialist in UNICEF further provided comments and suggestions to improve the content of the manual.
We thank the Policy Research. Monitoring and Evaluation Unit staff (Dr. Dominic Pealore, Mr. Joseph Chonia,
Mr.
Kwame Agyapong Agin and Afred Quaynor) for their unflinching support to the Unit and for their inputs in the production of the manual.Special mention must be made of Mr. Matthew Karikari-Ababio, the Head of the Policy Research, Monitoring and Evaluation Unit for his initiative to produce this manual, one of the important steps to build the capacity of the district education officials to enhance the implementation of the decetralisation process in the education sector.
They were supported by Mr. J.O. Afrani, Director (PBME) Division and Mr. Ato Essuman, Chief Director, Ministry of Education, Science and Sports
We finally wish to thank Angela Arnott, UIS EMIS and Project Coordinator for the pains she took to go through the manual to further enrich the content.
...
MODULE 1 : THE CONCEPT OF MONITORING AND EVALUATION
1.1 Wbat Is tbe importanc:e ofM&E?
Managers at the district and community level must see themselves as decision-makers who can make improvement in education. There is also a huge gap between the national standards I goals and the reality of the community school; reasons for this gap must be better understood by the -district and the community so that action can be taken to reduce the gap. As reasons for the gap become better known, the schools and districts may not only improve performance at the local level, they may wish to question the standards imposed by national authorities.
-M&E is currently seen by most people in the system as bureaucratic reporting to authorities, with the purpose of finding failures that the authorities can punish. However, M&E is essential to effective management It needs to be integrated into all functions at the district and local level and -to be continuous, with certain basic things happening on a periodic basis (Refer 7.3 Participatory evaluation methods inpage
55 of the manual) -M & E will therefore:• Influence decisions on resource allocation, taken at upper levels, using information on the _ actual situation at local levels and alternative approaches to improvement, based on ground-up information ( See District Performance Monitoring Page 29)
• Encourage schools and communities to take more initiatives in making decisions based on information-this can motivate and energize schools and communities
• Provide justification for spreading or replicating successful programmes or activities
1.1 How should M&E be carried out?
We should:
• Organize dissemination meetings to discuss possible M&E models with the stakeholders at the district and local levels
-• Undertake a needs assessment of the district, interviewing and discussing with-stakeholders at the district and local levels in order to find the questions that need answering and issues and problems that need attention (Refer 7.3 Participatory Evaluation Methods, Page 55 and 7.3.6 Conducting Need Assessments, Page 56 of the-manual)
• Discuss with stakeholders the possibility of using capitation grant as pilot, to track-progress and to make changes in the implementation strategy in schools
1.3 Wbo are tbe key players in M&E?
• The staff of the REOIDEO must internalize the necessity for and the possibilities of M&E
• At the action side of the equation, community leaders, head teachers and teachers must understand the use of infonnation and the need to take decisions at the school and community level that will improve teaching and learning.
1.4 What are tbe competencies to be acbieved by participants?
• Work with other REO IDEO staff to identify questions, issues and problems peculiar to the district and local levels
• Meet with local level representatives (head teachers, teachers, SMCIPT A executives etc) to eUcit input on questions, issues problems and challenges at the school level
•
Compare
perceptions at the district and local level and work with DEO staff to identify priority areas of concern to be addressed through M&E• Use the information provided in this manual , along with other sources, to support the DEO staff
in
implementing an M&E programme to address the priority areas of concern•
Put
M&E systems in place at the district level• Demand from Districts EMIS Officers for appropriate data and data analyses • Use analysed data for preparation of plans and for resource management
1.5 Key Question: Wbat Is tbe difference between M&E?
1.6 Summary notes
MODULE 2 : INDICATORS
2.1 What are educational Indicators?
Indicators are often referred to as being of four types: input, process, output, or outcome. Input
indicators measure what is being added or provided (training, materials, funds) at the activity level. Process indicators measure behavior change which is hypothesized from the inputs (e.g., teachers incorporating new teaching methods). Output indicators measure direct results of the
behavior changes (e.g., students reading levels). Outcome indicators measure indirect results of the behavior change or collective results of a variety of behavior changes (e.g. improved student performance on standardized tests) (Read further Module 3: What is Schooling? Looking at indicators which best measure its dimension, Page 16)
An educational indicator is a quantitative or qualitative measure used to track progress toward a strategic objective. The indicators tell us specifically what to measure to determine whether an objective has been achieved. The tracking of indicators is a vital management tool for making performance-based decisions about strategies and activities to improve teaching and learning.
2.2 Why are educational indicators important?
• Measure the progress of an educational activity against stated targets
• Serve as a vital management tool for making performance-based decisions ah?ut strategies and activities to improve teaching and learning . ~
• Are used to measure behavior change which is hypothesized from education inputs (e.g., training).
2.3 What should we know about educational indicators?
• Types of Indicators o Input o Process o Output o Outcome
• Criteria for selecting indicators
• Adequacy/inadequacy of a set of educational indicators
• Whether the indicator has appropriate quantitative and or qualitative measures to be used
2.4 What should we do to track our district educational indicators?
• Identify our educational objectives and activities. • Define the indicator(s) and develop an M&E plan.
• Identify source(s) of data that exist or need to be collected. • Collect and analyze data on a regular schedule.
• Report on indicator progress as frequently as possible.
2.S How can the tracking of educational indicators improve the quality of education?
• Keep district officers infonned of progress towards stated targets and objectives.
• Provide incentive for stakeholders to maintain good perfonnance or improve bad performance.
• Encourage reform of educational programmes where necessary.
2.6 Key Questions:
2.6.1 How to track educational indicators?
• Set indicators to track progress of our educational activities.
• Train circuit supervisors to use indicators to track progress of our educational activities. • Collect data and analyze.
2.6.2 How to set Targets?
Ideally, targets should be set after a baseline measure has been collected or approximated/estimated. The target should be set based on the following factors.
• The baseline value.
• The level of effort that will be put forth to influence a change in the indicator. • The time period available to reach the target.
Target values are very important because if they are properly set they can motivate people to succeed in their goals. Targets also provide a means for assessing whether or not the activities that are being undertaken are sufficient to produce the desired changes.
2.6.3 How to get a baseline data?
__ As stated above, a baseline measure is needed if an indicator is going to be used to legitimately track progress. However, due to bad timing or a lack of resources in some cases, a true baseline data collection activity can not always be carried out. The following are some suggestions on how to obtain baseline figures in different situations.
2.6.3.1 Before Implementation has Begun
• Do tbe actual data collection, the exact way that it will be done for all subsequent data collection activities. This is the only way to obtain a true baseline figure and the preferable
... method. If finances or timing is going to be a problem, consider using sample instead of collecting data for the entire population (see Topic on Performance Monitoring, Page 29 of the manual)
,.
to the data that will be collected later in order to be a valid estimate of the baseline. If this option is going to be used, it makes sense to consider using the previous data collection strategy for all future data collection, assuming that the data can adequately measure the indicator.
• Use a proxy measure to represent the baseline, meaning another measure that is similar enough to the indicator to provide a reasonable estimate. For example, if the indicator relates to pupils ability to solve simple math problems, some items from the last School Education Assessment or Continuous Assessment might be analyzed to get a proxy measure of the indicator. In reporting the results, it is important to be clear that the baseline is a proxy and to make the appropriate interpretations.
2.6.3.2 If Implemeptation Has Already Begun
If activities intended to influence the value of the indicator have already begun. it is not possible to undertake a true baseline data collection activity. In this case, the following options are available.
• Select comparison/control sample and do an actual data collection the exact way that it will
be done for the target population for all subsequent data collection activities. The control sample must be as similar as possible to the target population on any characteristics that could possibly influence the value of the indicator. If this option is used, the control sample can continue to be tracked along with the target population to give a better understanding of whether changes in the indicator are a result of the activities or of some other factor (See Topic on Selection of a sample: Module 8, Page 58)
• Compute tbe indicator from existing data that has been collected for some other reason. For example, if the indicator relates to percentage of trained teachers, the most recent school census data could be used to compute the baseline value. The data must be reasonably close to the data that will be collected later in order to be a valid estimate of the baseline. If this option is going to be used, it makes sense to consider using the previous data collection strategy for all future data collection, assuming that the data can adequately measure the .. indicator.
2.6.4 Quantitative Data
Findings from quantitative data tend to have numerical values. Data collection instruments can be
based on any of the following approaches:
• Sample surveys which can be based on interviews, using a standard questionnaire. All respondents are asked the same set of questions
• Direct observation using service statistics and other programme documents
• Self-administered questionnaire-Not ideal for a less educated population and tends to have a low response rate
• Secondary data sources (official records, census, official statistics, etc)
14
-
.-...
2.6.5 Qualitative Data
Thus qualitative data can be collected using the following key approaches:
• In depth Interviews-Usually there is a guide or a set of questions to facilitate collection of infonnation from respondents. The guide helps to standardize the questions being asked so that there is unifonnity in analyzing the responses
• Focus Group Discussions-Respondents are brought together for open discussions on a set of issues prepared in advance. There is a facilitator who helps to guide the discussions as well as a rapporteur who takes notes. It is recommended that focus group discussions involve 8-10 participants, however, at the outer limits there should be no less than 5 and no more than 12
• Direct Observation-This is often used to assess service delivery points to detennine quality of service provision. It requires highly skilled observers and analysts such as ethnographers
• Case Studies-these nonnally concentrate on a small number of cases, which are examined in depth. Case studies can examine one moment in time and one event or processes that evolve over long periods oftime
• Content Analysis of written materials-this is useful for analyzing training materials
Table
2.6.5
Advantages of Quantitative and Qualitative Data~!itative Qualitative
•
Data is consistent and provides a basis•
It makes it possible to collect for national and international infonnation from respondents whose comparisons views are based on gut feelings•
It is cost effective for collecting data•
Helps to probe social and cultural from a large population attitudes•
Provides standardized responses•
Allows for probing for unintended•
Suitable for collecting data from resultspeople who are less educated
•
Allows assessment of goals that are not•
It is ideal for a large sample size amenable to quantitative analysis. For•
It is less time consuming example : empowennent, self-esteem,negotiation skills
2.6.6 Tips for Quantitative and Qualitative Data
To
ensure
high quality of data. prepare written guidelines for data collection. The guideline will ensure some degree of standardization in the data collection process. Also pilot-testing should not be done in an area where the questionnaire will be administered.2.7 Summary Notes:
Indicators are not necessarily an exact measure of the objective, but rather are intended to give a reasonable idea about whether or not the objective is being achieved. Often it is necessary to have more than one indicator to sufficiently measure against an objective. Generally, in deciding on indicators, you must ask the question 'What do we need to know to decide if the objective has been met?
[image:15.607.4.509.43.822.2]2.7.1 Effectiveness and Efficiency Indicators
To produce education indicators that will reveal the effectiveness and efficiency for use in monitoring and improving the system. it is necessary to report not just the raw data on outputs of the education system but also the ratio of the outputs to the inputs, or to the resources used (Mean test score increments I unit costs per pupil)
EM IS should provide the data while M&E convert the data to infonnation, knowledge and wisdom of the education system in the district and schools
MODULE 3: SCHOOLING
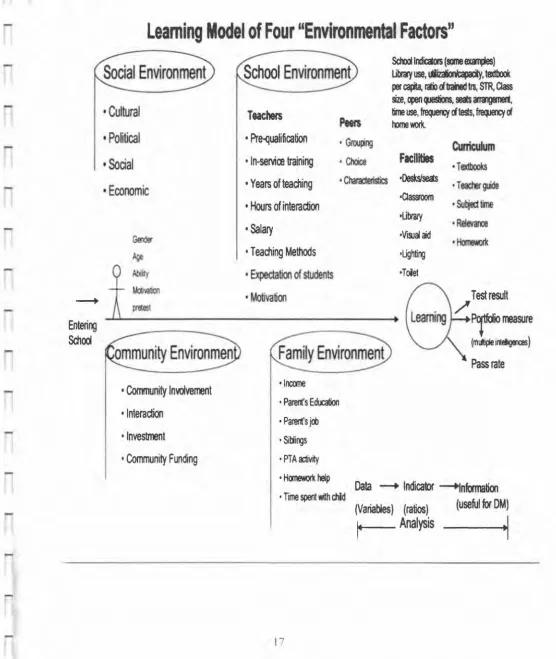
3.1 What is schooling? Looking at Indicators which best measure its dimensions.
Schooling is a process that converts inputs (students, teachers, materials, facilities) to outputs (graduates skiJls, knowledge attitudes and values) which lead to broader longer range outcomes (employment enhanced productivity and civil societies). Well-managed learning environment will enrich the conceptual and thinking talents of the children. We need to identify the environmental factors to enhance management and monitoring of the core business in education especially the process (proper organization of lesson, the absolute amount of time spent on task,
[image:16.605.118.592.34.842.2]the correct use of texts and homework and the encouragement of a child)«See Figure 3.1 (Core business in Education Page 16) and Figure 3.2: Learning Model of Four" Envirorunental Factors" Page 17»
Figure 3.1 Core Business in Education
"Core Business" in Education
/
Make Learning possible work on "inputs"
• Send them in? • Keep them there? • Move them along?
16
Make Learning happen work on "process"
• Learned or not? • Learned what?
...
Figure 3.2
Learning Model of Four "Environmental Factors"
Enteri~
Schod
• Cultural
• Political
• Social
• Economic
• Community InYOlvement
• Interaction
• Investment
• Community Funding
Teachers
• Pre-<jualification
•
Groo~~• In-servioo training
•
croce
• Years of teaching
•
Characteristics• Hours
of
interaction
• Salary
• Teaching Methods
•
Expectation of students
•
Motivation
'Incane
• Parent's Education
• Parent's job
• Si~ings
ScOOoIlrxIK3ors (Imle
exanpes)
I.itRyuse,
~. textbook IBcapta,
rem
d IJaiIed tis, STR, Classm,
~ cp!SIions. _ at13IlQIITIId,time
use,
~dtests, ~d00mem.
Curriculum
Facilities
• Textbooks
'Deskslseas
• T
eacrer !Pde
·Oassroom
'Su~time
'Ubrary
• Relev;n;e
·Visual aid
.~ 'Lighting
·Toiet
Pass rate
• PTA~vity 'H~help
Data
- +
Indicator
~nformation(Variables) (ratios)
(useful
for
OM)
14
Analysis
~I
MODULE 4: FORMULATING M&E PLANS
4.1 What is a district M&E plan?
A district M&E plan is a tool that lays out M&E activities that are to be undertaken within a specified time period related to objectives agreed upon at the district level. It is not a static document, but rather a rolling plan that change with experience and over time. The pIan can be
very simple and consist of ery basic M&E activities or can be more complex. integrating many sources of infonnation for decision-making (Read further ModuJe 7: How to Plan a useful Evaluation, Page 50 of the manual)
4.1.1 An M&E plan is important because:
• Managers at the district and community level must begin asking questions more relevant to the improvement of teaching and learning and systematically using existing information and seeking new information that wiJI help answer those questions and point to action that can be taken at aU levels.
• It helps DEO staff to think critically about the questions and the necessary processes to answer the questions, including understanding the technical capacity and resource needs.
• It provides a transparent and systematic process and realistic schedule for implementing M&E activities.
4.2 How do we formulate an effective M&E plan?
The following steps should be followed to formulate an effective M&E plan in the
district:
• The officers in the district office who support the need for an M&E plan and those that will be available are to participate in its implementation
• Information currently being used for decision-making can be built upon and expanded.
• The range of M&E activities that might be undertaken, from basic (better storage, retrieval and use of data now collected. including annual census statistics, continuous assessment and SPIP plans) to more advanced (indicator development and tracking, new district student achievement tests. regular district meetings to discuss and share information, etc.) are to be incorporated • Grants or programs being implemented in the district (e.g. Pilot Programmatic Scheme) and the
associated M&E plans that have been developed are also to be factored in the plan
4.3 Who are the Key players to be involved?
• The Statistics Unit (AD Statistics and statistics officers should be primarily responsible for provision of data and information)
• The M&E staff in collaboration with DEOC, SMC and the Circuit Supervisors should formulate the plan
• The District Director should review. approve, and support the M&E plan, in both the programmatic and budgetary sense.
• The larger DEO staff should assist in the implementation of the plan and the dissemination of the results.
-4.4 Key Question: What format should M&E take?
M&E plans can take many different fonnats. The fonnat chosen should be one which allows for the complexity of the plan, but is also easily understandable to the users (Refer to the Topic Perfonnance Monitoring. Page 29 of the manual)
4.5 Summary
Notes:
The following elements should be considered when fonnulating a plan:
• The objectives or key questions to be answered.
• Indicators and their definitions. including the unit of measurement. The definition should be detailed enough that different people at different times would collect identical types of data. • Data source, meaning from where the data will be obtained. The source can refer to
documents, data files, or people.
• Method/approach of data collection, including unit of analysis, data disaggregation needs (gender, age, class, etc ... ), sampling techniques, and collection techniques or instruments. • Frequency and schedule of data collection.
• Responsible parties, including those who will manage the activity and who will carry out the activities.
• Data analysis plans.
• Dissemination/reporting plans. • Budget.
MODULE 5: POLICY RESEARCH
5.1 What will be the priority research questions?
The focus of priority research questions will be on disparities in the educational system; teacher deployment and utilization; textbook ordering; classroom building; school capitation grant management; salaries management; right type of incentive packages; staff transfers and mobility; deprivation and contact hours in schools.
5.2 What is the importance of Policy Research?
Application of policy research will lead to rationality in decision-making and strategic funding. Rationality in decision-making, for instance, should lead to identification of the gaps or deficits in the systems and viable areas to invest education resources. Strategic funding is investing in areas that will yield maximum results, efficiency and satisfaction of the interests of the key stakeholders
5.3 What is an Index?
-
~
==
==~~~
--~~---Indices can measure things such as pupil performance. output of new infrastructure. administrative efficiency or level of disadvantage or deprivation~
5.3.1 Composite Index
A Composite Index is made up of a number of indicators. They are strategically selected and synthetically designed and analysed to enhance Policy research. It is also to provide critical analysis of the EMIS data and Financial Statements and Reports to enhance accoWltability. effectiveness. efficiency and equity in education delivery at the operational level. Resources that would otherwise be wasted in ineffective uses are identified and become available to improve the quality delivery. Two composite indexes effectively utilized in policy research using the EMIS data are EF A Development Index (EDl) and Disparity Index (01)
5.3.1.1 EDI Index
While each of the six EF A goals is individually important. it is also useful to have a means of indicating progress towards EF A as a whole. The EF A Development Index (EOn. a composite of relevant indicators, provides one way of doing so. at least for four of the goals: universal primary education (UPE). adult literacy. gender parity and the quality of education. The two goals not included in the EOI are goals I and 3. Indicators on goal I Early childhood care and education) are still not reliable and goal 3 (learning needs of youth and adults) has not yet been sufficiently defined for quantitative measurement.
Calculating the EDI Index
The ED) is the arithmetic mean of the following four components:
• Net Enrolment rate (NER) • Adult literacy rate
• Gender Parity Index (GPO • Survival rate
Survival rate is chosen as a proxy measure of quality. An education system capable of retaining a larger proportion of their pupils is performing bener. on average. on international standards. The EOI value for a particular region. district and school is thus the arithmetic mean of the observed values for each component. Since the components are all expressed as percentages, the EDI value can vary from 0 to 100% or when expressed as a ratio. from 0 to 1. The closer a district's ED! value is to the maximum, the greater the extent of its overall EFA achievement and the nearer the district is to the EFA goal as a whole.
A composite indicator such as Education for All Development Index (EOI) is thus very useful to inform the policy debate on the prominence of all the EF A goals and to highlight the synergy among them and focus discussion on both quantitative and qualitative assessment and on a particular set of issues. rather than simply to collect data. EDI is calculated as follows using EMIS data to ensure data validity and reliability:
20
...
V. (Net Enrolment rate
+
Adult Literacy rate+
Gender Parity Index (GPl) +Survival rate). The calculation based on the National achievement using EMIS data is outlined in the table and the graph below (Refer Page 75; Definition of Key Indicators)T • e bl 5.3 l i e
. .
a cu Btine the
I I ED I12003/04
12004105
!200SI06
Ir'iet Enrolment rate (NER)
59.1
159.1
169.2
!Adult literacy rate ~3.4 ~3.4
160.3
~ender
Parity Index (GP!)
~.93KJ.93
P.95
lSurvival rate
183.2
~2.6 ~S.6 [image:21.599.0.552.53.799.2]EDI
~9.2 ~9.0 [51.5Figure 5.3.1.1 Tracking Progress in EF A targets in Ghana
TrackIng progre • • of the EFA
52
51.5
51
I
50.5 150
49.5
~
49 48.548
47.5
2003/04 2004105 2005106
Year
Looking at the progress of the EF A targets in Ghana, it could be said that the influence on the
capitation grant since its inception in 2004/05 on net enrolment rate, Gender Parity Index and
Survival rate to mention but a few. has impacted positively achieving the EF A goals during
2004/05 and 2005/06
5.3.1.2 The Disparity IBdex
(OJ)The Disparity ladex is the arithmetic mean of the coefficient of variation of the eight components outline in the table and the grapb below. The coefficient of variation measures the degrees of variances in the key indicators across primary schools in different settings-Urban, Peri-Urban and Deprived. The fonnula for calculating the Coefficient of variation is standard deviation divided by the Mean (Standard Deviation /Mean). The research question
was
to what extend has Management used poverty alleviation budgets and other available resources such as the Capitation grant and the Pilot Programmatic Scheme (pPS) to address the disparities in the districts? The following were some of the key input criteria used to select the 53 deprived districts in the Education sector:--
---
~
=---
__________
_.
n
»
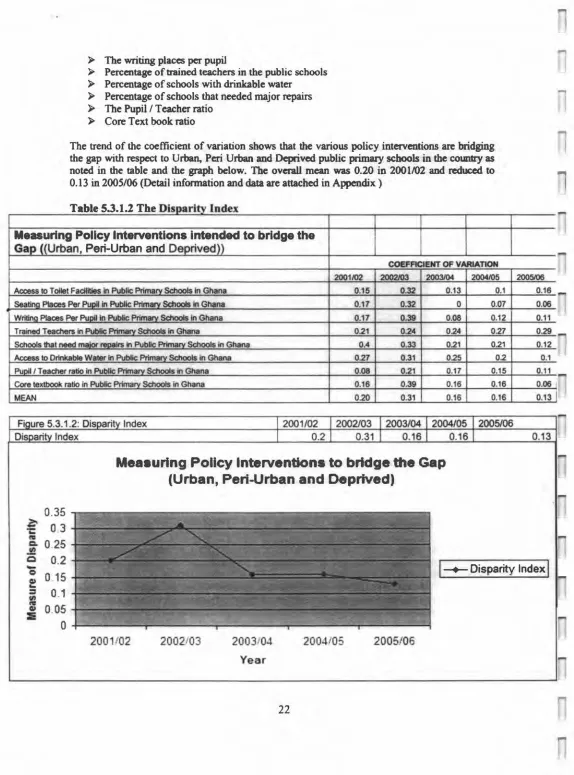
The writing places per pupil»
Percentage of trained teachers in the public schools»
Percentage of schools with drinkable water»
Percentage of schools that needed major repairs ~ The Pupil 1 Teacher ratio~ Core Text book ratio
[image:22.595.21.596.38.813.2]The trend of the coefficient of variation shows that the various policy interventions are bridging the gap with respect to Urban. Peri Urban and Deprived public primary schools in the country as noted in the table and the graph below. The overall mean was 0.20 in 2001102 and reduced to 0.13 in 2005106 (Detail information and data are attached in Appendix)
Table 5.3.1.2 The Disparity Index
Me.uring Policy Interventions intended to bridge the
Gap «(Urban. Peri-Urban and Deprived»COEFFICIENT OF VARIATION
2001102 2002103 2003104
Access 10 Toilet Facilities In Public Primary Schools in Ghana 0.15 0.32
seating Places Per ~, In Public Primarv Schools In Ghana 0.17 0.32 WriUng Places Per Pu~ In Public _PriO'I!ID' Schools In Ghana 0.17 0.39
Trained Teachers In PublIc Prirnan'Schoois In Ghana 0.21 0.24 SchOOls thaI need major reoaIrs In Public Primarv Schools In Ghana 0.4 0.33 Access 10 Drinkable Water in Public PrImary Schools In Ghana 0.27 0.31 Pupil I Teacher ratio in Public Primary Schools In Ghana 0.08 0.21
Core \eKlbook ratio In Public PrImary Schools In Ghana 0.16 0.39
MEAN 0.20 0.31
Index
Measuring
Policy
Interventions to bridge the Gap
(Urban, Peri-Urban and Deprived)
0.13
0
0.08
0.24
0.21
0.25
0.17
0.16
0.16
2004105
0.1
0.07
0.12
0.27
0.21
0.2
0.15
0.16
0.16
2005106
n
n
2005106 0.16
0.06
0.11
0..29
0.12 0.1
0.11 0.06
0.13l
0.13
I
-+-
Disparity IndexI
2001
/
02
2002
/
03
2003/042004
/
05
2005
/
0
6
Year
Calculating the Disparity Index
A critical analysis of all the districts in the country
was
undertaken by categorizing them in groups of Urban. Peri Urban and DepriVed using the EMIS data from 2001102 -2005/06. Where the gap is being bridged the coefficient ofvariatioD is very small and decreases within the passage of time. A higher coefficient of variation means there is much disparity (See Appendix 11 for further details)Calculation oftbe Standard Deviation and tbe Mean (Using Excel Commands)
In the calculation of the standard Deviation and the mean, excel spread sheet was used following the steps below:
~ Click Function (fx)
~ Select Mean or Standard Deviation
»
ClickOK»
Highlight the figures~ Click OK to finalize the calculations
Each component indicator is presented below with a corresponding graph:
Table 5.3.1.2.1
Access to Toilet Facilities in Public
PrilmlU"V Schools in Ghana Coefficient of Variation
2001/02 2002103 2003/04 2004105 2005106
0.15 0.32 0.13 0.1 0.16
Disparities in Education delivery
(Access
to Toilet Facilities in Public Primary Schools)
0.35
0.3
~ 0.25
1
0.2!
0.15I-+-
Disparities in the systemI
!
0.1 0.05O-r==
2001/02 2002103 2003/0.1 2004/05 2005/06
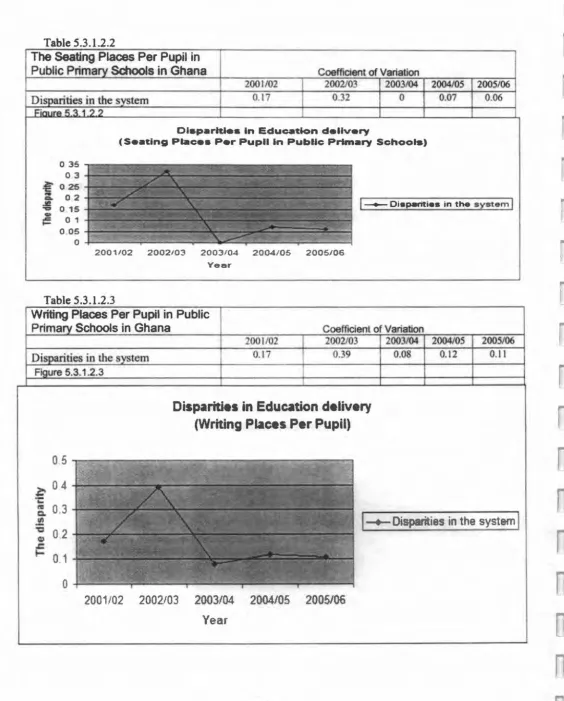
Table 5.3.1.2.2
The Seating Places Per Pupil in
Public Prima Schools in Ghana Coefficient of Variation
2001102 2002103 2003/04 2004105 2005/06 0.17 0.32 0 0.07 0.06
Clsparltles In Education delivery
(Se.ting Place. Per Pupil In Public Primary Schools)
1
_
Diep8titi • • in the systemI
2001/02 2002/03 2003/04 2004105 2005/06
Year
Table 5.3.1.2.3
Writing Places Per Pupil in Public
Prima Schools in Ghana Coefficient of Variation
2001/02 2002103 2003104 2004/05
tern
~
04
+-"-'~~1:
0.17 0.39
Disparities in Education delivery
(Writing Places Per Pupil)
0.08 0.12
2005/06 0.11
~
0.3
.!!
-:
02
\-+-
Disparities in the system
I
~
I-
0.1
2001/02
2002103
2003/04
2004/05
2005106
Year
24
n
n
n
n
n
n
[l
n
n
n
n
n
n
n
o
n
n
..,
I
[image:25.597.1.543.68.787.2]n
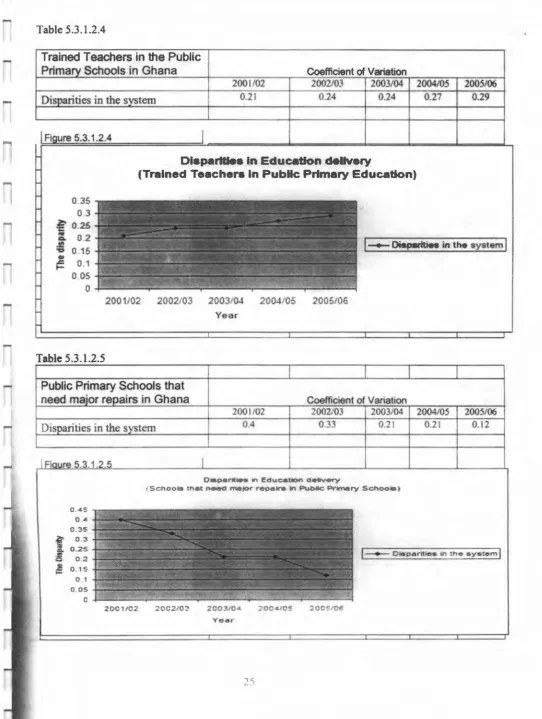
Table 5.3.1.2.4
Trained Teachers in the Public
Prima Schools in Ghana
Coefficient of Variation2001/02 2002103 2003/04 2004105 2005/06
I
Figure 5.3.1.2.40.35
0.21 0.24 0.24
D ..
~rttIe. In Education delivery(Trained Teachers In PubHc Prtmary Education)
0.27 0.29
0.3
€
0.25j
0.2"0 0.15
Q)
I
~ Diep8rities in the systemI
~ 0.10.05
o
~~~~T-~~~T---~~~--~--~~~~2001/02 2002/03 2003/()..1 2004105 2005/06
Table 5.3.1.2.5
Public Primary Schools that
n
eed ma
'
or re airs in Ghana
Year
Coefficient of Variation
2001/02 2002103 2003/04 2004105 2005106
0.45 0.4
0.35
t'
0.3.i
0.25io 0.2 ~2!iEi
~ 0.15
o 1
o 05 -+-..-,.p;
0.4 0.3 0.21 0.21 0.12
D~",'" in EducatiOn d.w~
(SChoolS tna' need majOr rep."" In Public Primary Sct\oo_)
In lh1t ayatem
I
---
n
Table 5.3.1.2.6
Access
to
drinkable water supply in
Public Prima Schools in Ghana
~dentofVariation2001/02 2002103 2003/04 2004105 2005106
Di
arities in the
s
stem
0.27 0.31 0.25 0.2 0.1Fi ure 5.3.1.2.6
0.3S 0.3
Dls~rltles In Education delivery
(Access to drtnkabl. water supply)
i
0:':
• 0.1Se:: 0.1
1 _
Dl.p ... In 1he systemI
O.OS
o
2001/02 2002103 2003I(M 2004J0S 2OO5IOf5 Yea,.
Table 5.3.1.2.7
Pupil
I
Teacher ratio in Public
Prim
Schools in Ghana
Coefficient of Variation2001102 2002103 2003/04 2004105 2005106
0.25
0.08 0.21 0.17
Disparities In Education delivery
(Pupil/Teacher ratio in the Public Prtmary School)
0.15 0.11
0.2
i
0.15
, ' 9'.10.05
1...-
DlSpaf1tles In the s;'stemI
r
G
o+-~=~;;;;;
2001102 2002/03 2003104 2004105 2005106
n
Year
~---~
n
26
n
n
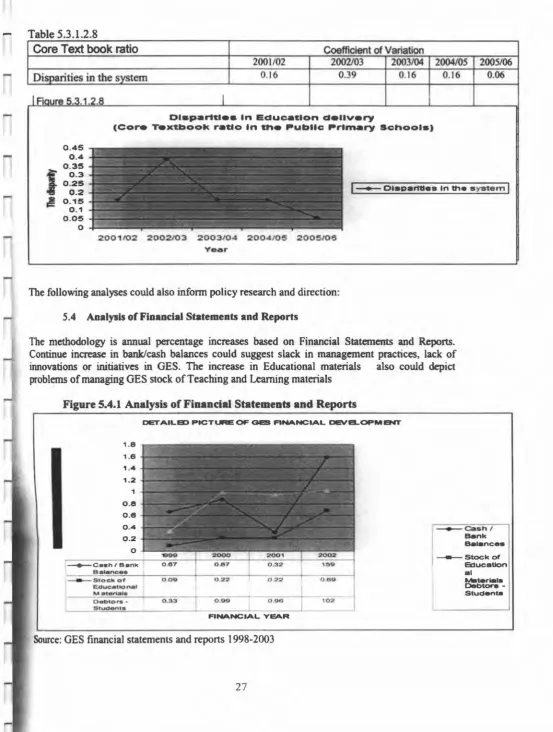
-Table 5.3.1.2.8
Core Text book ratio Coefficient of Variation
2001/02 2002103 2003/04
0.16 0.39 0.16
DI.paritie. In Education delivery
(Core Textbook ratio In the Public Primary School.)
0.45 0.4 0.35
2004105 2005106
0.16 0.06
I
0.3 0.25 0.2!
0.151 _
Ola.,arta • • In the systemI
0.1 0.05
o ~;;..;;o;l!:oo
2001/02 2002103 2003104 2004/05 2005/06
Year
The following analyses could also infonn policy research and direction:
5.4 Analysis of Financial Statements and Reports
The methodology is annual percentage increases based on Financial Statements and Reports. Continue increase in bank/cash balances could suggest slack in management practices, lack of innovations or initiatives in GES. The increase in Educational materials also could depict problems of managing GES stock of Teaching and Learning materials
Figure 5.4.1
Analysisof Financial Statements and Reports
DEI' AILED PICTURE OF GES FlNANClAL DEVELOPM ENT
Oebtors
-Studo"'.
0.33
022
_O_'gg _ _ --'-_ _ 0_
I
FlNANClAL Y~R
Source: GES financial statements and reports 1998-2003
o 6 iii
102
_ _ Cash I
Bank
a."nc _
_ Stock of
education
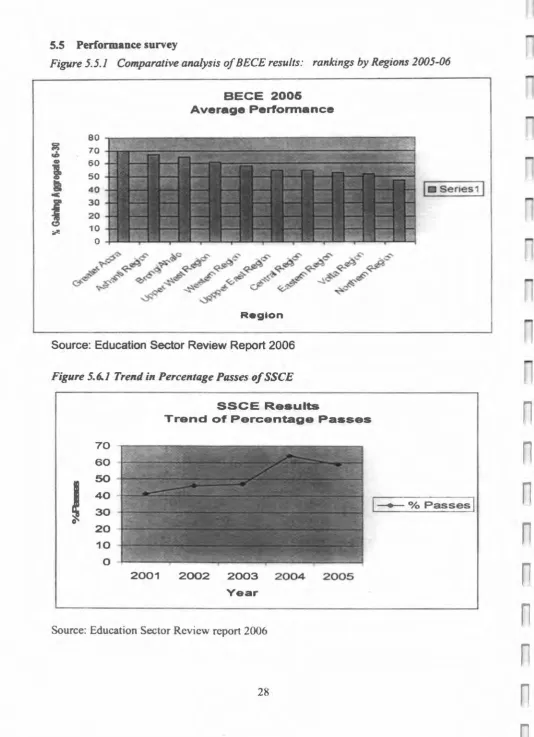
[image:27.597.0.554.55.787.2]5.5 Performance survey
Figure
5.5.1 Comparative analysis of BECE results: rankings by Regions 2005-06
80 T:"1-n:;sti;!imI
70 60
50 40
30 20
10
o
eECE 2006 Average Performance
Region
Source: Education Sector Review Report 2006
Figure
5.6.1 Trend in Percentage Passes o/SSCE
70 60
I
50 40 .30
0
20 10 0
2001
SSCE Results
Trend of Percentage Passes
2002 2003 2004 2005
Year
Source: Education Sector Review report 2006
28
---....
I_
serieS11....
n
n
n
n
n
n
n
MODULE 6: PERFORMANCE MONITORING
6.1 Introduction
Several days of training are recommended to develop skills for defining practical indicators to enhance performance monitoring. Data collection, analysis and reporting skills and management information system (MIS) skills are required to implement performance monitoring systems. The following steps are to be used in the performance monitoring process at the Regional, District and School level:
Step I: Develop clear sense of results sought
Step 11: Establish performance criteria, checkpoints and lists
Step Ill: Measure performance against criteria. checkpoints and lists
Step IV: Analyse / Evaluate measurement information
Step V: Decide on appropriate response
Step VI: Respond appropriately
Step VII: Monitor the effectiveness of the response
This training and working manual provide selected statistical indicators and data for each district to determine the extent to which set targets are being achieved by the application of the various interventions in the schools/colleges. The following are some guiding principles in preparing and submitting the District Performance reports:
6.2 District Performance Report
Provide an introduction to the report summarizing its purpose; how it was produced and who it is to be submitted to.
Key questio"s
tISa guide:
• What is the purpose of the report? • What information does it provide?
• Who was responsible for producing the report? District Director?
• What information sources were used? -EMIS? School monitoring reports? Etc.
• Who was consulted during the production of the report? District circuit supervisors, local Education NGOs, schools or School Management Teams. District Assembly, Civil Society Organizations.
• Who was the report finally submitted to'! Central MOESS? To infonn Education Sector Annual Review'? To infonn production of net AESOP?
Date of Submission: 30'" April each year
Signed and approved
District Education Office Director
District Authority Director
Address To:
The Hon. Minister,
Ministry of Education Science and Sports P.O. Box M45
Accra
Attention Director PBME
The following are the reporting instrument to collect and analyse the data:
6.3 Performance Reporting Instruments
6.3.1 KINDERGARTEN
6.3 .1.1 Acc~s
Kindergarten: Access (4-5) 2004/05 2005/06
Actual Actual
Total Number of male Qupils in KG 1 Total Number of female pupils in KG 1 Total Number of male pupils in KG 2 Total Number of female pupils in KG2
Number of Male pUQils in public Kindergartens
Number of Female ~uJ)ils in j)1!blic Kindergartens
Number of Male pupils in private Kindergartens
Number of Female pupils in private EUndergarten
Gross Enrolment Rate (GER)
Male Gross Enrolment Rate (MGER)
Female Gross Enrolment Rate (FGER)
Population aged 4-5
Female Population aged 4-5
Male Population aged 4-5
Gender Parity Index (GPI)
30
...
-6.3.1. 2 Kindergarten: Quality
Kindergarten: Quality (4-5) 2004/05 2005/06 2006/07 2006107
Actual Actual Actual Tanzet Total Number of Teachers
Total Number of Teachers in Public KG Number of Trained Teachers in Public KG Total number of Teachers in Private KG Number of Trained Teachers in Private KG Percentage of Trained Teachers in Public Pupilffeacher Ratio in Public KG Schools PupillTeacher Ratio in Private KG Schools
6.3
.
1.3 K1 d D ergarten: Ph lyslc. .a IKindergarten: Physical 2004/05 2005106 2006107 2006107
Actual Actual Actual TarJZet Number of Public Kindergartens
Number of Private Kindergartens
No. Public Kinderr.~artens needing major repair
Write briefly on the Kindergarten performance by answering the following questions on the indicators from 2004/05·2006/07
1) What are the changes in the following?
a) Gross Enrolment Rate (GER)
b) Female Gross Enrolment Rate (FGER)
c) Gender Parity Index GPI)
d) Gross Admission Rate (GAR)
e) Female Gross Admission Rate (FGAR)
f) Pupil Teacher Ratio (PTR)
g) Pupil Textbook Ratio
h) Net Enrolment Rate (NER)
2) What are the causes of the changes in each indicator?
...J
--~=---~---6.3.2 Primary
6.3 21 Prl
.
.
mary_ A C(_USPrlmuy: Aceess (6-11) 2004/05 2005106 2006107 2006107
Actual Actual Actual TU'let
Total Number of Male P!lJ)ils in all schools Total Number of female Pupils in all schools Gross Enrolment Rate (GER)
Mal; Gross Enrolment Rate (MGER)
Female Gross Enrolment RatelFGER~
POJ)Ulation aged 6-11 in the district
Female ~lation a~ 6-I I
Male Population a~ed 6-11
Gross Admission Rate (GAR)
Male Gross Admission Rate (MGAR)
Female Gross Admission Rate (FGAR)
Population agect 6 in the district
Female j)C)I)Ulation aged 6
Male population aged 6
Gender Parity Index (GPI) Number of Primary I Pupils
Number of Female Primary 1~~ls
Number of Primary 6 pupils
Number of female Primary 6 pupi Is
6.3.2.2 PrimarY Qualit)
Primary: Quality 20G4/05 2005/06 2006107 2006107
Actual Actual Actual Target
Total Number of Teachers in all schools Total Number of Teachers in Public Schools
Total Number of Trained Teachers in Public Schs
Percentage of Trained Teachers in Public Schools
Percentage of Trained Teachers to Private
Schools
Number of New trained Teachers posted in Public
Schools
No. of New Teachers actually at post in Public
Schs
Pupil Teacher Ralio in Public Schools
Pupil Teacher Ratio in Private Schools
-Highesl PTR in a Public school
Lowest PTR in a Public school
Number of new Teachers deployed to district at
public schools from outside
Number of new Teachers deployed within the district at public schools
Puj)il: Core textbook Ratio in Public Schools No. of Public schools with functioning School
Management Committee (SMC)
No. of Public schools with School Performance
-Improvement Plans (SPIPJ
Total no. of trained teachers in Private Schools
Total no. of pupils
-6.3.2.3 Primary Physical
Primary: Pbysical 2004105 200S106 2006107 2006107
Actual Actual Actual Tarpt
Total Number of Public Schools Total Number of Private schools
No. of Public schools with toilet facilities No. of Public schools with potable water Total number of classrooms in Public schools No. of classrooms needing major repair
No of New classrooms needed
Write briefly on the Primary performance by answering the following questions on the indicators from 2004/05-2006/07
1) What are the changes in the following? a) Gross Enrolment Rate (GER)
b) Female Gross Enrolment Rate (FGER) c) Gender parity Index (GPI)
d) Gross Admission Rate (GAR)
e) Female Gross Admission Rate (FGAR)
f) Pupil Teacher Ratio (PTR) g) Pupil Textbook Ratio
h) Percentage of Trained Teachers i) Net Enrolment Rate (NER)
2) What are the causes of the changes in each mdicator?
3) What would you do to improve the trend in indicator'.'
6.3.3 Junior secondary school
6.3.3 1 JSS Access
.
I
JSS: Access 2004/05 2005/06 2006107 2006107I Actual Actual Actual TaJ"2e'
Total Number of Students in all schools Total Number of students in Public schools
i Total Number of students in Private schools I
i
Total Number of Male students In all schoolsI
i Total Number of Female students in all schools I I
l Gross Enrolment Rate (GER)
: Female Gross Enrolment Rate (FGER) I
I Popu lalion aged 12- 14
Female population aged 12-14 I
Male population aged 12-14- j
Number of JSS 1 students Nwnbcr of female JSS 1 students Nwnbcr of JSS 3 students Number of female JSS 3 students
Number of JSS student scholarships awarded Number of Male students in STME clinic Number of Female students in STME clinic Number of days for STME clinic
6.3.3.2 JSS Quality
JSS: QuaUty 2004/05 2005106 2006107 2006107
Actual Actual Actual TU'2tt
Total number of Teachers in all schools Total Number of Teachers in Public Schools Total Number of Teachers in Private schools
Total Number of Trained Teachers in Public schools Total Number of Trained Teachers in Private schools Percentage of Trained Teachers in Public
Percentage of Trained Teacbers in Private Number of New Teachers posted in Public
No. of New Teachers actually at post in Public schools Pupil Teacher Ratio in Public Schools
Pupil Teacher Ratio in Private schools Highest PTR in a Public school Lowest PTR in a Public school
Number of new Teachers deployed to district public schools from outside
Number of new Teachers deployed within the district at public schools
Pupil: Core textbook Ratio in Public Schools No. of Public schools with functiOning School Management Committee(SMC)
No. of Public schools with School Perfonnance Improvement Plans (SPIP)
% of Male students with aggregate 6-30 in BECE
% of Female students with aggregate 6-30 in BECE
6.3.3.3 JSS Physical
JSS: Physical 2003/04 2004/05 2005106 100S106
Ac:tual Adual Actual Taratt Total Number of Public Schools
No. of schools with toilet facilities No. of schools with potable water Total number of classrooms Nwnber of JSS with workshops
How many JSS have tools and equipment
-Number of JSS without workshops
Number of classrooms needing major repair Number of schools with 10 computers
Write briefly on the JSS performance by answering the following questions on the indicators from 2003/04-2005106
1) What are the changes in the following? a) Gross Enrolment Rate (GER)
b) Female Gross Enrolment Rate (FGER) c) Gender parity Index (GPI)
d) Gross Admission Rate (GAR)
e) Female Gross Admission Rate (FGAR) f) Pupil Teacher Ratio (PTR)
g) Pupil Textbook Ratio
h) Percentage of Trained Teachers i) Net Enrolment Rate (NER)
2) What are the causes of the changes in each indicator'?
3) What would you do to improve the trend in indicator'!
6.3.4 Senior Secondary Scbool
SSS 2004/05 2005106 2006/07 2006107
Actual Actual Actual Target Number of all Secondary
Schools
Number of Public Secondarv Schools
Number of Male Students in all schools
Number of Female Students in all Schools
Number of Students in Public Secondary Schools Gross Enrolment Rate
(GER)
Female Gross Enrolment Rate (FGER)
Gender Parity Index (GPI)
Number of Labs. With equipment in Public School~ Number of Labs. Without equipment in Public schools Number of schools with 10 computers
Number of STME Clinics Duration of STME Clinic in Days
Number of Male students in Clinic
Number of Female students
in Clinic
6.3.STVET
TVET 2004/05 2005106
Adulil Actual
Number of Male Students Number of Female Students Number ofTVET schools Number ofpubJic TVET schools Number of private TVET schools
Number of students in public TVET schools Number of students in private TVET schools
List priority areas to improve Science and TVET in your district What will your district do to strengthen these areas?
6.3.6 Non- Formal Education
NON-FORMAL EDUCA nON 2004/05
Actual
Number of Male Students Number of Female Students
No. of programmes being run in the district (Private and Public)
What changes have taken place for the years stated above?
2005106
Actual
List priority areas to improve Non-Formal Education in your District? What will your District do to strengthen these areas?
36
2006107 2006107
-Actual Target
2006107 2006107
Actual Target
....
6.3.7 Education Management
With the increase in resources being managed at the district and school level it becomes
more important to have regular assessment of district performance in respect of activities
critical to achieving goals in the national Education Strategic Plan
.
Currently districts produce quarterly and annual reports which are widely circulated (to
all other districts) but the current format does not enable the centre to compare
performance on key strategic indicators.
This session will introduce the new Annual District Performance Report format and give
training in its application. It will identify practical difficulties to its implementation and
make plans to overcome them. The medium term impact of introducing the new format
should include improVed capacity to identify districts where underperformance is
threatening the accomplishment of national goals and hence enable GES management to
focus remedial support accordingly. Competencies to be achieved by participants: will
include the capacity to:
•
Produce accurate and well analysed reports according to the new format.
• Use the reports to improve planning
6.3.7.1 Annual District Education Operational Plan (ADEOP)
1
2 3 4 5
• When was the ADEOP produced? By Whom (District planning team'!). Who was consulted during its production (District Authorities. local NGOs, Regional education Office? etc.)
• What were the main activities outlined in the plan?
Key Agreed
Activities Costing Targets
For further detaJls (date for the ADEOP to be produced and date Headquarters want it see the District Log Frame Page 61)
• What were the main priorities amongst these activities?
• How were they prioritized (consultative meeting, response to central MOESS/GES priority etc.) what was the reason for their high priority (linked to a priority target) • What has been the progress in implementing the ADEOP activities? (refer to other parts
of the report as required).
• What are the key achievements? - are there any best practices to share with other district education offices
• What have been the main obstacles to implementation'? How has the district education office tried to overcome them?
• What support does the DEO required from MOESS/GES or other partners to assist it in implementing activities in future?
6.3.7.2 District levies
• Are district levies in operation in your district?
• List all the levies and the amount to be paid.
• Are there any exemptions from the levies (E.g. for poor students) - if so how many
exemptions were made and how was the decision to exempt a student made?
6.3.7.2 School Management Committees (SMC)
• How many primary and JSS schools in your district have established School Management Committees (as a number and as a percentage of the total)?
• Are the SMCs established appropriately - with community and parental representatives, regular meetings and so on?
• How many primary and JSS schools in your district produce School Performance Improvement Plans (SPIPs)? (as a number and as a percentage of the total)? • Are the SPIPs well produced and are they implemented effectively?
• What areas of SMC management of SPIP production work well and what areas need strengthening?
-• What would you suggest as a means of strengthening SMCs? ... 1
• What would you suggest as a means of strengthening the production of SPIPs?
6.3.7.3 School Operating Budgets (Capitation Grants)
• Do schools 10 your district receive capitation grants?
• If so, are the amounts per male and per female student received sufficient, for what? • Are the guidelines on spending the grants sufficiently clear for head teachers and SMCs
to understand?
• Is the financial reponing system suffiCient to track the spending? Is it too complex or too simple'!
• Do the operating budgets improve the quality of education services in the schools or not (Give number and percentage of schools reponing improvement., no change and worse: District monitoring visits should provide information on this)
6.4 Monitoring visits to schools
• How many monitoring visits to schools did your office undenake (give total number of school visits by district circuit supervisors)
• How many visits did the district circuit supervisors pay to the SMCs?
• What were the key issues that district circuit supervisors reported from their visits?
38