I
ncomeT
ransferS
ystems:
A C
omparativeS
tudyU
singM
icrodata.
Deborah Mitchell
Aavaan * )
A thesis submitted for the degree of Doctor of Philosophy
of the Australian National University.
D
eclarationExcept where otherwise indicated this thesis is my own work.
A
cknowledgementsThis dissertation was produced w ith the encouragem ent and helpful supervision of a number of staff from the Public Policy Program and the Research School of Social Sciences at the Australian National University. Most notably: Francis Castles, Steve Dowrick, Rolf Gerritsen, Rosemarie Gill, Fred Gruen, Raja Junankar and Jane Marceau. Useful comments on earlier drafts were also provided by Peter Saunders of the Social Policy Research Unit at the University of New South Wales.
The dissertation was inspired by the Luxembourg Income Study Workshop conducted by Tim Smeeding (Vanderbilt University) and Lee Rainwater (Flarvard University) in 1988. The methodological and theoretical issues raised by the participants in the Workshop provided a solid basis for the empirical research conducted for the dissertation. Thanks are also due to John Coder, the LIS Technical Director over the period of the study, who provided advice on the data sets and patiently responded to any problems which arose in the course of the remote accessing of the LIS database.
i v
A
bstractThis study uses the microdata assembled by the Luxembourg Income Study (LIS) to examine the impact of the social security and taxation systems on poverty and inequality in ten OECD countries, circa 1980. A model of income transfer processes is developed to show the relationship between government expenditure, transfer instruments and the outcomes of the transfer process. The study adapts and extends existing methodologies in the poverty and inequality literature. These measures are then applied to the LIS microdata to reveal the efficiency and effectiveness of both the social security and taxation systems in the countries chosen for comparison.
The analysis shows that, in general, it is the larger welfare states which are the most effective in reducing poverty and inequality. The most efficient welfare states are those which apply either income tests to direct transfers and/or have highly progressive taxation systems. There appears to be a trade-off between the efficiency and effectiveness goals of the transfer systems in the LIS countries.
TABLE of CONTENTS
Introduction 1
An overview of the study. 2
An overview of the Luxembourg Income Study. 5
A glossary of terms. 7
Part I AN empirical Investigationof Income Transfer Systems. 9
1. Defining Efficiency and Effectiveness: Concepts and Application. 11
1.1. Focusing on outcomes: the use of efficiency and
effectiveness criteria. 12
1.1.1. The goals of income transfer policies. 13
1.1.2. Defining efficiency and effectiveness. 16
1.2. The effectiveness criteria. 16
1.3. The efficiency criteria. 18
1.4. Discerning the effects of the transfer instruments. 19
1.5. Sum m ary. 20
2. Data Constraints and Operational Solutions. 23
2.1. Using the LIS data: some general measurement problems. 24
2.1.1. The unit of analysis. 24
2.1.2. The analysis of family types. 26
2.1.3. Equivalence scales. 27
2.2. Income measurement issues. 29
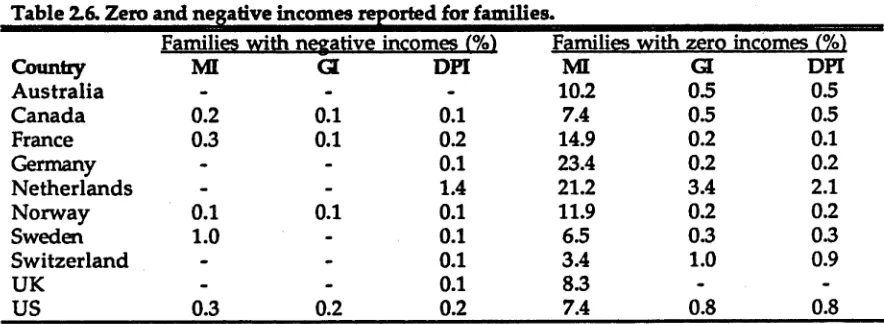
2.2.1. Treatment of zero and negative incomes. 29
2.3. Different years of observations. 30
3. Poverty Measurement Issues. 31
3.1. Defining and measuring poverty in a comparative context. 32
3.2. The poverty debate. 32
3.2.1. Five approaches to poverty measurement. 33
3.2.2. Budgetary approach. 33
3.2.3. Consumer expenditure theory. 34
3.2.4. Budget standards. 36
3.2.5. Attitudinal surveys: the social consensus approach. 37
3.2.6. Relative deprivation. 38
3.2.7. Relative income approaches. 39
3.2.8. Observing poverty: appropriate measures for the comparative
3.3. Setting a relative poverty line. 43
3.4. Head-counts and poverty gaps. 43
3.5. A discussion of partial ordering. 45
3.5.1. Alternative equivalence scales. 48
3.6. Summary. 50
4. Poverty Reduction in the LIS Countries: Effectiveness Measures. 51 4.1. Cross-national measures of poverty: some presentational issues. 52
4.2. Aggregate poverty measures: head-counts. 55
4.2.1. Comparing post-transfer poverty rates: sensitivity to the choice
of equivalence scale and poverty line. 56
4.2.2. The post-transfer reduction of the poverty head-count. 60 4.2.3. The effectiveness of transfer systems in eliminating poverty 63
4.3. Aggregate poverty measures: poverty gaps. 66
4.3.1. Post-transfer poverty gaps. 70
4.3.2. The post-transfer reduction of the poverty gap. 72
4.3.3. Assessing effectiveness in eliminating the poverty gap. 73 4.4. Comparing aggregate poverty levels: head-counts versus
poverty gaps. 74
4.5. Comments on the poverty intersection method for aggregate
estimates. 77
4.6. Disaggregated poverty measures: head-counts. 81
4.6.1. Disaggregation of the post-transfer head-count. 81
4.6.2. Disaggregation of the post-transfer reduction of the poverty
head-count. 84
4.7 Disaggregated poverty measures: poverty gaps. 86
4.7.1. Disaggregation of the post-transfer poverty gap. 87
4.7.2. Disaggregation of the post-transfer reduction in the poverty gap. 89 4.7.3. Comparing disaggregated poverty levels: head-counts versus
poverty gaps. 90
4.8 The role of social security and taxation in reducing poverty. 90
4.9. Summary. 93
5. Poverty Reduction in the LIS Countries: Efficiency Measures. 95
5.1. Beckerman's efficiency model. 96
5.2. Efficiency of aggregate social security expenditure. 98
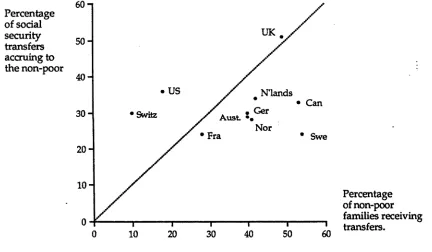
5.3. Transfers to the non-poor. 103
5.4. The pattern and size of the spillover. 106
5.5. The poor who don't receive transfers. 108
5.7. Clawback through the tax system: an extension of the
Beckerman model. 109
5.8. The impact of taxation clawback. 113
5.9. Who is affected by clawback? 115
5.9.1. Non-poor families affected by clawback. 117
5.9.2. Pattern and size of the spillover after clawback. 119
5.10. Net efficiency of transfers: a summary. 121
6. The Measurement of Inequality. 127
6.1. The measurement of inequality. 128
6.1.1. The Lorenz curve and Gini coefficient. 128
6.1.2. The Atkinson measure. 131
6.1.3. Additively decomposable inequality measures. 134
6.1.4. Decomposition of the redistribution process. 136
6.2. Using inequality measures to assess efficiency and effectiveness. 143
6.3. The application of Kakwani's methodology. 144
7. Inequality Reduction in the LIS Countries:
Effectiveness Measures. 147
7.1. The impact of transfer systems on income inequality. 148
7.2. Aggregate income and redistribution. 153
7.3. The relative impact of benefits and taxes on income inequality. 155
7.4. The determinants of redistribution. 158
7.5. Sum m ary. 160
8. Inequality Reduction in the LIS Countries: Efficiency Measures. 161
8.1. Kakwani's efficiency indicators. 162
8.2. The cost-effectiveness of the income transfer system. 166
8.3. Sum m ary. 166
9. The Outcomes of the Redistributive Strategies
of the LIS Countries. 167
9.1. Aggregate effectiveness of income transfers. 168
9.2. Disaggregated effectiveness of income transfers. 173
9.3. Efficiency of income transfers. 173
9.4. Cost-effectiveness of the transfer system. 176
PartII Microdata Studies a n d Comparative Social Policy. 183
10. A New Perspective in Comparative Social Policy? 185
10.1. Comparing income transfer systems: an overview of the
literature. 186
10.1.1. Welfare state comparisons. 187
10.1.2. Social security policy comparisons. 188
10.1.3. Comparisons of the impact of transfer policies. 188
10.2. The comparative literature and the " production" of welfare. 189
10.3. New perspectives on old problems? 193
11. Welfare 'Effort7 and Welfare Outcomes. 195
11.1. A critique of conventional welfare effort approaches. 196
11.2. Should we reject the welfare effort approach? 198
11.3. Can we improve the income transfer component of welfare
effort measures? 201
11.3.1. Accounting for taxes. 202
11.3.2. Accounting for the distribution of transfers. 206
11.3.3. Accounting for the efficiency of transfers. 208
11.3.4. The relationship between aggregate expenditure and the level
of pre-transfer "need". 210
11.4. Using the microdata to explain the gap between inputs and
outcomes. 214
11.4.1. Countries where expenditures under-estimate outcomes. 214 11.4.2. Countries where expenditures over-estimate outcomes. 216
12. Welfare States and Welfare Outcomes. 219
12.1 The division of welfare states based on production characteristics. 221
12.2 Three welfare state typologies compared. 222
12.2.1 Institutional, industrial achievement and residual welfare states. 222 12.2.2 Social welfare, social security and positive states. 223 12.2.3 Social democratic, corporativist and liberal welfare states. 224
12.2.4. The correspondence between typologies. 225
12.3. Comparing Esping-Andersen's typology with outcomes. 227
12.4. Outcomes: does it really matter how you get there? 232 12.5. Using microdata studies to 'inform' welfare state typologies:
some conclusions. 233
12.5.1. Which characteristics are important? 235
References. 24i
Append ices. I
Table of Contents. II
List of Tables. HI
A. Luxembourg Income Study Database Description. A1
B. Poverty Head-counts and Gaps: Detailed Tabulations. B1
C. Inequality Measures: Detailed Tabulations. Cl
D. Welfare Effort Calculations. D1
E. Comparative Measures of Welfare Effort. El
F. Comparable Results from Other LIS Studies. FI
X
L IST o f T A B L E S
C hapter 2.
Table 2.1.
Table 2.2. Table 2.3.
Table 2.4.
Table 2.5.
Table 2.6.
Table 2.7.
A n illustration of the u n it of analysis problem . 25
D escription of family types u sed in the study. 26
Percentage of family types in population, circa 1980. 27
The calculation of equivalent incom es. 27
OECD an d W hiteford geom etric m ean equivalence scales. 28
Zero and negative incom es rep o rted for families. 29
O perational treatm ent of zero an d negative incom es for
this study. 30
C hapter 3.
Table 3.1. The relationship betw een p o verty concepts and
indicators. 40
Table 3.2.
Table 3.3.
Table 3.4.
Table 3.5.
C alculation of the adjusted m ed ian incom e p o verty line. 43
The sensitivity of poverty estim ates. 44
T ransfer sensitivity. 45
R ankings, partial and com plete ordering. 46
C h ap ter 4.
Table 4.1. R eduction in poverty rates for fam ilies , 40% poverty
in te rv a l. 57
Table 4.2. R eduction in poverty rates for fam ilies , 50% poverty
in te rv a l. 57
Table 4.3. R eduction in poverty rates for fam ilies , 60% poverty
in te rv a l. 57
Table 4.4. R ank correlation betw een OECD and W hiteford scales,
Table 4.5.
post-transfer head-count. 58
Rank correlation coefficients for post-transfer
head-counts, Z* range. 59
Table 4.6. P ost-transfer head-count rankings for Z* range,
OECD scale. 59
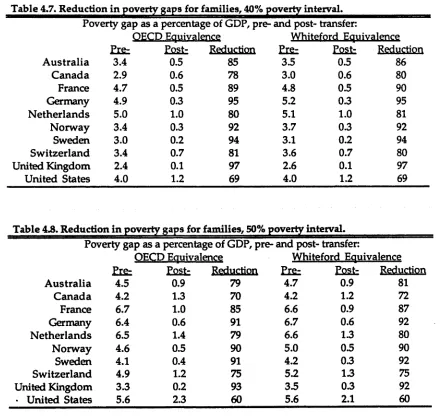
Table 4.7. R eduction in poverty gaps for fam ilies, 40% poverty
in te rv a l. 69
Table 4.8. R eduction in poverty gaps for fam ilies, 50% poverty
in te rv a l. 69
Table 4.9. R eduction in poverty gaps for fam ilies, 60% poverty
in te rv a l. 69
Table 4.10 R ank correlation betw een OECD an d W hiteford scales,
Table 4.11. Correlation coefficients for post-transfer poverty gap
ranks for Z* range. 70
Table 4.12. Ranks on size of the poverty gap at the 40,50 and 60 %
intervals, OECD scale. 70
Table 4.13. Rank correlations for pre-transfer head-count and poverty
gap, Z* range. 75
Table 4.14. Rank correlations for post-transfer head-count and poverty
gap, Z* range. 76
Table 4.15. Rank correlations for reduction in the head-count and
poverty gap, Z* range. 77
Table 4.16. Poverty rates for families using poverty intersection, 40%
poverty interval. 78
Table 4.17. Poverty rates for families using poverty intersection, 50%
poverty interval. 78
Table 4.18. Poverty rates for families using poverty intersection, 60%
poverty interval. 78
Table 4.19. Head-count estimates with variations >1% between
equivalence scales. 79
Table 4.20. Poverty intersection ranks for post-transfer head-count
estimates. 79
Table 4.21. The composition of the pre-transfer poor at 50% poverty
interval, OECD scale. 82
Table 4.22. Representation of family types in poor population pre
transfer. 82
Table 4.23. The composition of the post-transfer poor at 50% poverty
interval, OECD scale. 82
Table 4.24. Representation of family types in poor population post
transfer. 82
Table 4.25. Pre-transfer head-count at the 50% poverty interval,
OECD scale. 84
Table 4.26. Post-transfer head-count at the 50% poverty interval,
OECD scale. 84
Table 4.27. Reduction in the head-count at the 50% poverty interval,
OECD scale. 84
Table 4.28. Rank correlation coefficients post-transfer gap at the 60%
interval, OECD scale. 87
Table 4.29. Average pre-transfer poverty gap at the 60% interval,
OECD scale. 88
Table 4.30. Average post-transfer poverty gap at the 60% interval,
xii
Table 4.31. Reduction in the poverty gap at the 60% interval,
OECD scale. 88
Table 4.32. Effect of taxation on poverty counts at the aggregate
level, OECD scale. 91
Table 4.33. Composition of poor population post- social security,
50% interval OECD scale. 92
Table 4.34. Composition of poor population post- tax,
50% interval OECD scale. 92
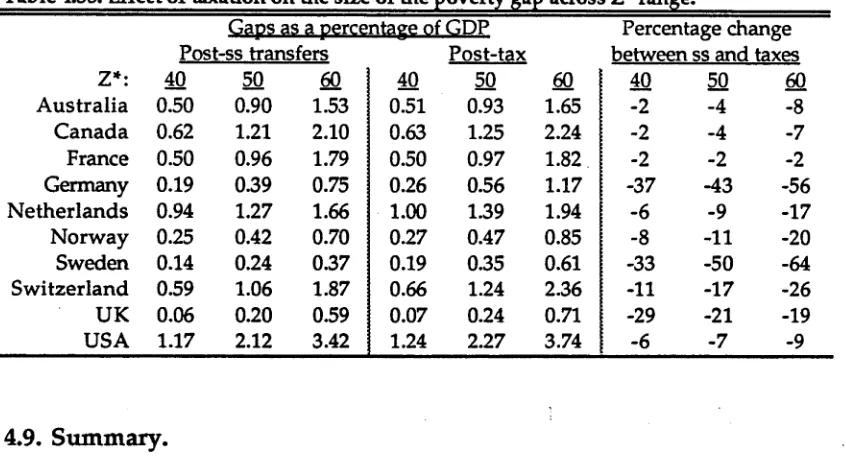
Table 4.35. Effect of taxation on the size of the poverty gap
across Z* range. 93
Chapter 5.
Table 5.1. Targeting efficiency measures using 40% poverty line
and OECD scale. 99
Table 5.2. Targeting efficiency measures using 50% poverty line
and OECD scale. 99
Table 5.3. Targeting efficiency measures using 60% poverty line and
OECD scale. 99
Table 5.4. Distribution of families in the Beckerman model
post-social security, 50% interval. 103
Table 5.5. Social security transfers to families with pre-transfer income above the 50% and 60% poverty intervals, OECD scale. 104 Table 5.6. Composition of non-poor families receiving social security,
60% poverty interval. 105
Table 5.7. Spillover levels at the 50% poverty interval using OECD
equivalence scale. 106
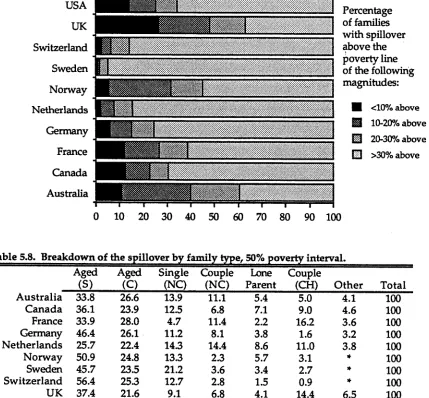
Table 5.8. Breakdown of the spillover by family type, 50% poverty
interval. 107
Table 5.9. Percentage of families whose market income is below
the 50% poverty line and who receive no transfers. 108 Table 5.10. Ratio of primary and secondary expenditure efficiency,
60% poverty interval. 109
Table 5.11. Clawback of social security transfers through the tax
system. 110
Table 5.12. Targeting efficiency measures after clawback, 40% poverty
line and OECD scale. 112
Table 5.13. Targeting efficiency measures after clawback, 50% poverty
line and OECD scale. 112
Table 5.14. Targeting efficiency measures after clawback, 60% poverty
Table 5.15. Distribution of the clawback, 50% poverty interval. 116 Table 5.16. Distribution of families in the Beckerman model after
clawback, 50% interval. 117
Table 5.17. Differences in the distribution of families in the
Beckerman model after clawback, 50% interval. 117 Table 5.18. Net transfers to families with pre-transfer income above
the 50% and 60% poverty intervals, OECD scale. 118 Table 5.19. Non-poor families receiving positive net transfers, 60%
interval. 119
Table 5.20. Spillover levels after clawback at the 50% interval. 120 Table 5.21. Breakdown of the spillover after clawback by family type,
50% poverty interval. 121
Table 5.22. Targeting efficiency measures using 50% poverty interval,
OECD scale. 121
Table 5.23. Ratio of primary and secondary expenditure efficiency,
60% poverty interval. 124
Chapter 6.
Table 6.1. Four examples of income distributions. 129
Table 6.2. Income redistributions around the median. 132
Table 6.3. Atkinson's inequality aversion ranking of income
distributions. 133
Table 6.4. Atkinson's inequality aversion index for distributions
YO to Y3. 134
Table 6.5. Rank of distributions Y° to Y3 based on the Atkinson
index. 134
Table 6.6. Decomposition of inequality by population sub-groups. 135 Table 6.7. Shorrocks’ inequality indices for distributions Y° to Y3. 135 Table 6.8. Kakwani's decomposition of the income distribution
process. 141
Table 6.9. Kakwani's analysis of a change to the tax threshold. 142 Table 6.10. Kakwani's analysis of a change in the targeting of social
security payments. 142
Table 6.11. Kakwani's analysis of further targeting of social security
payments. 143
Chapter 7.
Table 7.1. Correlation coefficients for Kakwani indices, OECD and
W hiteford equivalences. 149
Table 7.2. Gini coefficients and estimated redistribution
Table 7.3. Table 7.4. Table 7.5. Table 7.6. Table 7.7. Chapter 8. Table 8.1. Table 8.2. Table 8.3. Table 8.4. Chapter 9. Table 9.1. Table 9.2. Table 9.3. Table 9.4. Chapter 11. Table 11.1. Table 11.2. Table 11.3. Table 11.4. Table 11.5. Table 11.6.
Gird coefficients and estimated redistribution post- social
xiv
security and taxes. 155
Ranks based on Gini coefficients pre- and post- transfer. 157 Redistributive effects of social security and taxation
systems (%). 157
Percentage share of redistribution accruing to social security
and taxation instruments. 158
Kakwani indices of progressivity, average incidence and
redistribution. 159
Kakwani's progressivity and re-ranking indices for social
security and taxes. 163
Post-social security ranks for progressivity, re-ranking,
incidence and redistribution indices. 163
Post-tax ranks for progressivity, re-ranking, incidence
and redistribution indices. 164
Cost-effectiveness ratios for the social security and
taxation systems. 166
Post-transfer effectiveness rankings, 50% poverty interval
OECD scale. 169
Post-transfer percentage reduction and redistribution
rankings. 170
Correlation coefficients between poverty efficiency and
effectiveness measures. 178
Multiple regression analysis of inequality efficiency and
effectiveness measures. 180
Social security effort in the LIS countries, 1980. 199 Ranking of countries by social security effort, 1980. 199 Comparison of social security effort and outcome
measures by rank, 1980. 200
Simple regressions, (R2) between social security effort
and outcomes measures. 200
Estimating social security effort after taxes, 1980. 205 Comparison of CTE/GDP and outcome measures by
rank, 1980. 205 Table 11.8. Simple regression results - CTE/GDP, NE/GDP and
outcome measures. 205
Table 11.9. Accounting for incidence of social security expenditures
on poor population, 1980. 207
Table 11.10. Comparison of effective SS/GDP and outcome measures
by rank, 1980. 207
Table 11.11. Comparison of effective NE/GDP and outcome measures
by rank, 1980. 208
Table 11.12. Simple regression results: R2 between SS/GDP or NE/GDP
and outcome measures. 208
Table 11.13. Accounting for the efficiency of social security
expenditures, 1980. 209
Table 11.14. Comparison of efficient SS/GDP and outcome measures
by rank, 1980. 209
Table 11.15. Comparison of efficient CTE/GDP and outcome measures
by rank, 1980. 209
Table 11.16. Simple regression results efficient SS and CTE/GDP and
outcome measures. 209
Table 11.17. Simple regressions (R2) for expenditure and need, 1980. 211 Table 11.18. Multiple regression of welfare outcomes on pre-transfer
need and expenditure. 212
Table 11.19. Multiple regression of the post-transfer poverty gap or poverty reduction on the pre-transfer gap and efficient
social security expenditure. 213
Chapter 12.
Table 12.1. The classification of the LIS countries according to the
three typologies. 225
Table 12.2. A comparison of Esping-Andersen's regime-types with
xv i
LIST of DIAGRAMS
Chapter 1.
Diagram 1.1. A model of the production of welfare. 12
Diagram 1.2. The production of welfare: a view of poverty alleviation. 17 Diagram 1.3. The production of welfare: a view of reducing income
inequality. 18
Diagram 1.4. The 'three stage' approach to analysing income transfers. 20
Chapter 3.
Diagram 3.1. Engel curve for "necessities". 35
Diagram 3.2. Engel curve for "luxuries". 35
Diagram 3.3. Quantity-income elasticity function, the 'S-curve'. 37 Diagram 3.4. The determination of the 'Leyden' poverty line. 38
Diagram 3.5. Complete ordering of three LIS countries. 47
Diagram 3.6. Partial ordering of four LIS countries. 48
Diagram 3.7. Partial ordering using two equivalence scales. 49
Diagram 3.8. The poverty intersection. 50
Chapter 4.
Diagram 4.1. Post-transfer head-counts for Z* range, OECD scale. 60 Diagram 4.2. Poverty reduction in the LIS countries (excluding UK)
OECD equivalence scale. 61
Diagram 4.3. Poverty reduction in the LIS countries (including UK)
OECD equivalence scale. 62
Diagram 4.4. Pre- versus post- transfer poverty rates, 50% poverty
interval, OECD scale. 64
Diagram 4.5. Reduction in poverty rate versus pre-transfer head-count,
OECD scale. 65
Diagram 4.6. Reduction in poverty rate versus post-transfer head-count,
OECD scale. 66
Diagram 4.7. Comparison of post-transfer poverty gap with per capita
GDP, 1980. 68
Diagram 4.8. Ordering of the LIS countries based on the poverty gap,
OECD scale. 71
Diagram 4.9. Ordering of countries based on the proportional reduction
in the poverty gap. 72
Diagram 4.12. Head-count versus poverty gap measures of pre-transfer
poverty. 75
Diagram 4.13. Head-count versus poverty gap measures of post-transfer
poverty. 76
Diagram 4.14. Head-count versus poverty gap measures of poverty
reduction. 77
Diagram 4.15. Proportional reductions in the head-count using the
poverty intersection. 80
Diagram 4.16. 'Balanced' poverty reduction across a range of
family types. 85
Diagram 4.17. 'Unbalanced' poverty reduction across a range of
family types. 86
Chapter 5.
Diagram 5.1. Beckerman's efficiency model post- social security
transfers. 97
Diagram 5.2. Post- social security VEE estimates, Z* range. 100 Diagram 5.3. Post- social security Spillover estimates, Z* range. 101 Diagram 5.4. Post- social security PRE estimates, Z * range. 103
Diagram 5.5. The spread of transfers among the non-poor at 60%
interval, OECD scale. 105
Diagram 5.6. Pattern of the spillover at the 50% poverty interval. 107 Diagram 5.7. The extension of the transfer efficiency model post-tax. I l l
Diagram 5.8. Post- taxation VEE estimates, Z* range. 113
Diagram 5.9. Post- tax Spillover estimates, Z* range. 114
Diagram 5.10. Post- tax PRE estimates, Z* range. 115
Diagram 5.11. The spread of net transfers among the non-poor,
60% interval. 118
Diagram 5.12. Pattern of the spillover after clawback at the 50% poverty
interval. 120
Diagram 5.13. A comparison of post-social security and post-tax VEE
ratios, 50% interval. 122
Diagram 5.14. A comparison of post-social security and tax Spillover
ratios, 50% interval. 123
Diagram 5.15. A comparison of post-social security and post-tax PRE
ratios, 50% interval. 123
Chapter 6.
Diagram 6.1. Lorenz curve and line of equality. 129
xviii
Diagram 6.3. The problem of intersecting Lorenz curves. 131
Diagram 6.4. The concentration curve for taxes. 138
Diagram 6.5. The concentration curve for social security
transfers. 139
Chapter 7.
Diagram 7.1. Relationship between pre- and post- transfer
income distributions. 150
Diagram 7.2. Redistribution and pre-transfer inequality. 151
Diagram 7.3. Redistribution and post-transfer inequality. 151 Diagram 7.4. Relationship between GDP per capita and pre
transfer inequality. 153
Diagram 7.5. Relationship between GDP per capita and
post-transfer inequality. 154
Diagram 7.6. Relationship between GDP per capita and net
redistribution. 155
Diagram 7.7. Gini coefficients pre-transfer, post- social security and
post-taxes. 156
Chapter 9.
Diagram 9.1. Post-transfer poverty and inequality measures,
50% poverty interval OECD scale. 171
Diagram 9.2. Post-transfer reduction measures, 50% poverty
interval OECD scale. 172
Diagram 9.3. Primary efficiency measures, 50% poverty interval
OECD scale. 174
Diagram 9.4. Secondary efficiency measures, 50% poverty interval
OECD scale. 175
Diagram 9.5. Cost-effectiveness of social security in relation to the reduction of poverty and inequality, 50% interval OECD scale. 177 Diagram 9.6. Reduction in poverty gap versus poverty reduction
efficiency. 179
Diagram 9.7. Reduction in Gini coefficient versus inefficiency due
to re-ranking for social security. 180
Chapter 10.
An overview of the study.
The aim of this study is to compare the efficiency and effectiveness of the income transfer systems in ten OECD countries. There are several features of the study which distinguish it from previous comparative studies of income maintenance policy:
i. Whereas most studies of income maintenance concentrate exclusively on direct transfers through the social security system, this study takes a comprehensive view of transfer policies by using microdata to examine the incidence and impact of both social security transfers and income taxes.
It does so for two reasons. First, tax 'expenditures' (in the form of deductions, rebates and exemptions) may be used in place of, or in addition to, social security transfers to increase the disposable income of families or households. Second, in many of the countries to be studied, social security policy and policy instruments are specifically designed to interact with taxation policy to produce certain desired outcomes for example, progressive income taxes may 'clawback' universal transfers from high income families or households. Thus to neglect the effects of taxation (other than indirect observation of its effects through disposable income measures) may result in (a) underestimating income transfer expenditures designed to effect redistributive aims and (b) presenting an incomplete view of those transfer systems which crucially depend on the interaction of social security and taxation policy instruments.
The data to be used in the study are part of the Luxembourg Income Study (LIS) microdata set. The outstanding feature of the LIS data is that a number of income and demographic variables have been drawn from reliable, usually government sponsored, survey sources in participating countries and re-coded to form a common framework.
iii. Using the observations from each stage of the redistribution process, the study will draw conclusions about the effectiveness of alternative policy instruments in achieving certain goals of the welfare state in relation to income distribution and poverty alleviation. Alternative policy instruments in this context refers not only to the choice of different social security instruments (eg: universal versus income- tested transfers) but also the choice between direct and indirect transfers (eg: child benefits versus tax deductions for children.)
iv. A key innovation of this study is its attempt to quantify the efficiency with which the poverty reduction and income redistribution outcomes are achieved, for example, the extent to which transfers close the poverty gap, the proportion of transfers which accrue to lower income earners, the amount of redistribution achieved for each social security dollar. This issue has become critical in recent years as governments of many of the OECD countries react to new perceptions of economic scarcity and seek ways to manage the growth of income transfer programs that do not incur disastrous political costs (Heidenheimer et al, 1990:255).
v. Drawing these findings together the study analyses whether there is a trade-off between efficiency and effectiveness goals of income transfer systems.
The first part of this study is essentially empirical in character, using microdata to draw a fairly detailed picture of the transfer systems of the countries under study as they affect income distribution and poverty rates. In addition, the study also looks at how each set of policies affects different family types, thereby allowing the different priorities and emphases of each welfare state to become apparent. The conclusion of Part I summarises and ranks these income transfer systems in terms of their efficiency and effectiveness in relation to the population overall and by family type. In doing so it draws out the differences and similarities in the redistributive strategies of these welfare states.
4
i. Whether the conventional division of countries into welfare leaders
and laggards, based on expenditures, corresponds with the outcomes of transfer processes. In other words, do higher expenditures on social security, for example, necessarily equate with better outcomes?
ii. If not, can the microdata identify and explain the intervening processes which might prevent the "straight line" translation of expenditures to outcomes?
iii. The study examines several well-known typologies of the welfare state which use characteristics of the social security system (eg:
universal versus selective assistance, replacement rates, methods of financing) to identify distinctive models of welfare provision. The study compares the assignment of the LIS countries within each typology to examine the extent to which the selection of different attributes of social security systems may lead to different groupings of countries.
iv. Using one of these typologies, the study examines whether the types of welfare states identified are consistently associated with particular outcomes.
This leads to a more general discussion about the relationship of findings based on microdata to this area of the comparative literature. The discussion is advanced on several fronts:
v. Can the use of microdata 'inform' welfare state typologies? For example, if the validity of these typologies rests on the characteristics of the social security system are there critical characteristics which have been overlooked? One area which the results of Part I points to is taxation. Here, the implications of taking a more comprehensive view of income transfers by presenting a balance between the characteristics of direct transfers (social security payments) and indirect transfers (taxes) is discussed and used to construct an alternative typology of welfare state types.
An overview of the Luxembourg Income Study.
This unique database has been compiled by researchers at the Centre D'Etudes de Populations, Pauvrete et de Politiques Socio-Economiques in Luxembourg and is referred to in the literature as the Luxembourg Income Study (LIS).1 The LIS database is comprised of microdata which have been gathered by government statistical agencies in the participating countries, in the course of regular income, expenditure or tax file surveys. At present, there are fourteen countries participating in the LIS project and two waves of data, collected circa 1980 and 1985, are available. (Appendix A provides a list of the participating countries, details of the surveys from which the LIS data have been drawn and the sample sizes.)
The LIS database consists of approximately 60 income and demographic variables (listed in Appendix A) which have been coded according to a common set of criteria. Each of these variables is identified with the same variable name across the data sets and across the two waves of data. For example, income variable VI "Gross wage and salary income" can be specified for each country and in each wave of the data without the user being familiar with the original data set.
The importance of this facility in relation to this study is immediately apparent: the social security and taxation data relevant to a particular question can be readily identified by the user without a detailed knowledge of the workings of each system. Moreover, researchers can be reasonably confident that they are using comparable demographic variables and definitions of income. Commenting on this feature of the LIS data and its implications for comparative study, Heidenheimer et al (1990:10) note:
Elementary though it seems, one key problem in comparative policy studies is the difficulty of finding truly comparable measurements of the same things in different countries. For example, every major nation produces statistics on the distribution of income. However, income is measured differently in different countries; definitions of household versus individual income are often not the same; methods for estimating the underreporting of income in government statistical surveys vary greatly, and so on. Only in the last few years ... has it been possible to go back to each nation's income surveys, create a common accounting framework, and recalculate the millions of individual household income reports on that common basis. Only then can we begin to address sensibly questions about the distribution of well-being ... and public policy in different nations.
Because of a lack of data of this type many previous attempts at detailed cross-national comparisons of the impact of social security have been confined either to analysing aggregate data - thereby losing detail on the differential impact of transfer systems on beneficiary groups or family types - or to concentrating on a very narrow group of beneficiaries or family types - thereby losing perspective on the relationship of the impact of transfers on the chosen group to the overall population.
The second advantage of the LIS data to this study is that detailed demographic data are also available, allowing the research to be conducted either from the perspective of a beneficiary category (eg: those receiving unemployment benefits) or by some demographic characteristic (eg: lone parent families.)
The ten countries which have been selected from the LIS database for this study are: Australia, Canada, France, (West) Germany, the Netherlands, Norway, Sweden, Switzerland, United Kingdom and United States. It is important to stress here that the analysis presented in this study draws on the first wave of the LIS data (circa 1980). At the time of writing, the coverage of countries in the second wave of data (circa 1985) was considerably smaller. Therefore, income transfer policies may have undergone considerable transformation in the intervening period and the outcomes observed, may well be radically different today. Despite the age of the data, the analysis presented here maintains its relevance for two reasons. First, the expressed aim of the study requires the investigation, and application, of methodologies suited to cross-national comparisons using microdata. From this perspective, the importance of the analysis lies in the sensitivity of the measures to alternative forms of transfer policies and instruments. Second, at a more general level, the study presents a framework which can be used to trace the relationship between government expenditure, transfer instruments and outcomes in a consistent fashion.
There are limitations on the data which are discussed in detail in Chapter 2. The four which most concern this study are: the type of unit for which the original data was reported; the treatment of zero and negative disposable incomes; the under-reporting of income in the original surveys; and the stage of the macro-economic business cycle when the data was collected in each country.
certainly represents the best available data for cross-national comparison of income transfers.
A glossary of terms.
This study draws on the theoretical and methodological work of several disciplines, each of which use the core terms and concepts of this work in slightly different ways. The purpose of this section is to make clear to readers how this study defines and uses these core terms.
Direct transfers refers to payments made through social security and
closely allied programs. For example, it includes veterans' pensions but not education or health benefits. The measurement of direct transfers across the countries in the study are defined by the variable "SOCTRANS" on the LIS database, the detailed composition of this variable is set out in Appendix A. In certain contexts, I will abbreviate "direct transfers" to "transfers" and this will be clear from the context.
Indirect transfers refers to income taxes and allied deductions. For
example, it includes mandatory social insurance contributions for wage earners and the self-employed. The measurement of indirect transfers is given by the variables "PAYROLL" plus "V ll", as described in Appendix A. Indirect transfers will be abbreviated to "taxes" and this usage will also be clear from the context.
Income transfer system refers to the set of policies and policy
instruments used to make direct and indirect transfers. In the course of the study I may refer to it as "the transfer system" or the "tax-transfer system". The combined effect of transfers and taxes is referred to as "net transfers" for the sake of brevity.
Market income refers to income from private sources: wages, property,
8
Gross income
Disposable income
refers to all income from private and public sources. That is, it is post-transfer, pre-tax income. It is labelled as "GI" on the LIS database and is equivalent to market income plus social security transfers plus private transfers such as alimony. It may be referred to as pre tax income.
An e m p ir ic a l i n v e s t i g a t i o n o f
C
h a p t e rO
n eD
e f in in g e f f ic ie n c y a n d e f f e c t iv e n e s s:
1.1. Focusing on outcomes: the use of efficiency and effectiveness criteria.
I noted in the Introduction to the study that its emphasis is on examining the outcomes of the income transfer process in the selected countries. In this chapter I set out the implications of adopting an outcomes perspective; what this means in the context of income transfers; which outcomes will be considered; and how these will be measured.
One way of viewing outcomes is presented in Diagram 1.1 which has been adapted from a model of the 'production of welfare' developed by Hill and Bramley (1986:181). An advantage of using this model is that it shows the relationship of welfare policies to policy instruments, the environment in which they operate and the linkages between program inputs and program outcomes. Applying this to social security transfers, for example, inputs
would include the actual payments; production would refer to the policy instruments used to distribute these payments; outputs would include the size and incidence of the payments; while outcomes might be measured in relation to the level of need or policy goals.
In the course of this study I will touch on each of these four stages individually, as well as linking inputs to outcomes; production to outcomes; and outputs to outcomes.
Diagram 1.1. A model of the production of welfare. Resource
controls
Social, economic and physical / environment Policy -N.
Service Organisation
management
Need
Opportunity
Financial (resources)
Outputs (intermediate)
Production Outcomes (welfare final outputs)
13
and measuring the outcomes of income transfer policies. In large part, the range of possible outcomes is a direct reflection of the diversity of the goals of these policies. This raises two problems for the study: defining the central goals common to each of these systems and establishing a set of criteria to assess the achievement of these goals.
1.1.1. The goals of incom e transfer policies.
The goals of income transfer policies vary considerably among the countries in this study. To give an example of this variation consider the following sample of statements of goals from respectively, Sweden, Germany and the United States:
The aim of this section... is to evaluate the success of the Sw edish W elfare State b y its o w n s ta n d a rd s ... im p ro v ed social security am ong the total p opulation; greater equality betw een social classes a n d betw een single persons an d families, as w ell as betw een retired persons a n d the labour force; and an elim ination of poverty.2 3
Follow ing the policy statem ents of various federal governm ents and the p latfo rm s of the m ajor political p arties, the G erm an incom e m aintenance schem es have three basic aims: to p revent poverty, to p ro v id e social security in th e sense of h elping people to p reserve th e ir social s ta tu s in th e case of lo st earn in g s, a n d to red u ce inequalities in living conditions.^
T he clearest sta te m e n t of goals, w hich d id n o t a p p e a r u n til the early 1970s, outlin ed eight:
1. Provision of a nom inally adequate income level to those w ho c a n n o t w o rk a n d , in ta n d e m w ith social in su ra n c e a n d em ploym ent program s, to those w ho can work.
2 Targeting benefits on those m ost in need.
3. C oordination an d integration of program s to achieve a d m in istra tiv e efficiency.
4. Sim ilar treatm en t of sim ilar in d iv id u als (horizontal equity) ... 5. V ertically eq u itab le treatm en t ...
6. Encouragem ent of self-sufficiency by providing w ork incentives. 7. R eduction or elim ination of incentives for fam ily breakup. 8. A ttention to m aking the system understandable, coherent, and
subject to fiscal control.4
It is possible to detect some common themes in these goals, as well as substantial variations for example, different emphases on the balance of social and private responsibilities. To start with a basic theme, Ringen (1987:7) argues that redistribution policies in general have equality as their immediate goal, that the aim is to make the distribution of welfare more
egalitarian or "fairer" than it would have been in the absence of such policies.
That equality is a goal in the welfare state we know from what politicians say, from what we can read in policy documents, and from the existence of policies that cannot be understood independently of some redistributive intention.
Where welfare states diverge, according to Ringen (1987:8), is in the strength of their commitment to equality:
The goal of equality can be given a weak or strong interpretation. In its weak interpretation, it implies a guaranteed minimum standard for all members of society ... In its strong formulation, the redistributive goal refers not only to the minimum standard but to the entire structure of inequality...
It is on the basis of this division of the goal of equality that the study proposes to examine the outcomes of income transfer policies. In the first instance, all the countries in this study have income transfer policies which are aimed at ensuring that a minimum standard of income is enjoyed by all. In this context it is reasonable to assume, as a first approximation, that this indicates a desire to ensure that poverty is avoided or alleviated. As Ringen (1987:141) argues:
To ask about poverty in the welfare state is to question the elementary effectiveness of social policy... W hile there is disagreement about the responsibility of government with regard to overall inequality, its responsibility in relation to poverty has been accepted for generations and is not seriously contested today.
In addition to this goal there are some countries, as the examples from Sweden and Germany illustrate, whose policies are aimed at decreasing the level of inequality in society. In this context, progress toward this goal would be reflected in the level of income redistribution achieved by transfer policies.
Thus the two goals of income transfer policies on which this study will focus are: the alleviation or reduction of poverty and the reduction of income inequality.
15
the various stages in the production of these outcomes and the relationship between each stage and the outcomes.
In particular, the contribution of various policy instruments to these outcomes is of interest to writers in both these areas. It enables us, for example, to make more informed judgements about whether universal or selective programs are better at achieving one or both of these goals or how taxation contributes to these goals.
In addition to the assessment of the effectiveness of these policy instruments, the study also examines their efficiency in producing the observed outcomes. I indicated in the Introduction that efficiency issues are gaining momentum in the discussion of welfare states, even in those countries where such concerns are of secondary importance in transfer policy (Heidenheimer et al, 1990:255). There are other countries where efficiency questions have always dominated transfer policy and this is demonstrated by the goals of transfer policy in the United States cited earlier. No less than five of the eight goals directly address the efficiency issue in its various guises: targeting, administrative efficiency, disincentive effects, fiscal control. Many of these goals are shared by other countries in this study such as Australia, Canada and the United Kingdom.
As with the effectiveness issue, efficiency questions are of interest to writers in both the general welfare state literature and social policy literature. For example, Ringen (1987:13) raises this issue in debating the pros and cons of different welfare state 'types':
The large and/or universal welfare state may be seen as wasteful and as giving benefits to people who do not need them, at the cost of unnecessarily high taxes, and the small welfare state as more effective because selective and targeted policies give more bang for the buck.
although, as noted above, it is increasingly becoming a primary goal even in those countries where formerly such concerns were not explicit.
1.1.2. Defining efficiency and effectiveness.
The terms efficiency and effectiveness in this study are defined by the relationship between the various stages of production identified in the Hill and Bramley model. Hill and Bramley (1986:182) offer the following definitions of efficiency, effectiveness and cost-effectiveness in the general context of welfare programs:
Efficiency is the relationship between outputs and inputs ... greater
efficiency is achieved by increasing the output from given inputs or by reducing the inputs required to produce a given output.
Effectiveness is the extent to which a service increases welfare ... Cost-effectiveness is the relationship between the cost of inputs and
the increase in welfare achieved ... greater cost-effectiveness is achieved by redudng inputs for a given level of welfare increase or by increasing welfare for a given level of inputs.
Hill and Bramley's definitions are those adopted in this study, with the exception that cost-effectiveness measures are grouped with the efficiency measures for ease of exposition. In the following sections I set out how efficiency and effectiveness are to be measured in relation to each of the two goals and also identify the salient characteristics of each part of the transfer process which influences the outcomes.
1.2. The effectiveness criteria.
The effectiveness of transfer policies in alleviating poverty will be measured in this study by the extent to which they reduce the number of families in poverty and, the extent to which they decrease the poverty gap, measured in aggregate, and for particular family types.
17
individuals or families who are lifted out of poverty, and the size of the poverty gap before and after transfers.5
A critical issue in the assessment of outcomes in terms of poverty alleviation is the specification of the poverty line. There is a considerable literature on how poverty lines can be specified and this is discussed in detail in Chapter 3.
Diagram 1.2. The production of welfare: a view of poverty alleviation. Policy= — . - targeting
- level of payments - eligibility criteria
Need= - no's in poverty - size of the
poverty gap
Targeting efficiency Poverty reduction payments
transfer
Inputs= Outcomes=
poverty reduction Outputs=
size and inddence of
transfers Production=
transfer systems
effidency
The effectiveness of transfer policies in reducing income inequality will be measured by the amount of redistribution achieved by transfers, ie a decrease (or increase) in income inequality and by the progressivity of the transfers.6 The effectiveness of transfer policies in reducing income inequality may be measured by the extent to which indices of inequality such as the Gini coefficient fall during the income transfer process and therefore reflect the amount of redistribution achieved.
Diagram 1.3 adapts the model in relation to the goal of reducing income inequality. The inputs are the average level of transfers received, or taxes paid, by the individual, family or household. Production again refers to the transfer instruments. The outputs are the size and incidence of transfers across the income distribution and are determined by the progressivity of
taxes and social security payments. The assessment of welfare outcomes in this instance relies on measuring the level of beneficiaries' incomes relative to the incomes of non-beneficiaries, or post-transfer inequality to pre- transfer inequality. In other words, the assessment captures how much redistribution is achieved by the transfer process and identifies to whom this redistribution accrues. Again the measurement of redistribution is associated with an extensive literature and this is considered in Chapter 6.
Diagram 1.3. The production of welfare: a view of reducing income inequality.
Policy= ^ - progressiv!ty of
taxes and social security transfers - level of p a y m e n tsv ^
Need= - pre transfer
inequality
.Redistribution Progressivity
Inputs= transfer payments
Production transfer systems
Outputs= size and incidence of
transfers
Outcomes= reduction in income inequality
1.3. The efficiency criteria.
The efficiency of transfer policies in alleviating poverty may be measured by the extent to which the inputs (transfers) accrue to the pre-transfer poor, ie
target efficiency and the amount by which each unit of input reduces the poverty gap, ie poverty reduction efficiency.
Referring to Diagram 1.2, we see that the link between inputs and outputs is the transfer instrument, so that the characteristics of this instrument (eg:
whether it is a universal or selective transfer) will determine target efficiency. In turn, the level of output - the size and incidence of the transfers - in relation to the existing level of need, will determine the amount of poverty reduction achieved per unit of transfer.
19
Referring to Diagram 1.3, we see that it is the progressivity of the transfer instrument which determines how efficiently the inputs are distributed; so that an instrument with low progressivity will require a higher level of inputs to achieve the same output as a more progressive instrument. The final outcome is measured by the difference between the pre- and post transfer levels of inequality and the inputs used to achieve this reduction.
1.4. Discerning the effects of the transfer instruments.
The LIS data file identifies many of the components of the transfer system in a fairly detailed fashion. For each family or household 'case' on the file it is possible to identify its sources of income from either the private sector (eg:
wages, property, self-employment) or the public sector (eg: unemployment benefits, aged pensions, housing benefits, family allowances); as well as deductions in the form of income taxes, property taxes, social insurance contributions.
In order to measure and analyse the transfer process a theoretical division of the formation of income into three stages - market income (MI), gross income (GI) and disposable income (DPI) - is used in the study. In moving from market income to gross income it is the direct transfers (social security payments) which form the first set of inputs to the transfer system. This produces an output in the form of gross income. The movement from gross to disposable income is via indirect transfers (taxes) which form the second set of inputs to the transfer system, with disposable income the resultant output. It is through this division of the transfer process that the separate, as well as net, effects of each instrument can be identified and measured. Diagram 1.4 (overleaf) illustrates this separation and relates each stage to the Hill and Bramley model.
Diagram 1.4. The 'three stage' approach to analysing income transfers. NEED Income taxes INPUTS Post transfer income Post transfer income income Social security transfers INPUTS Pre transfer income Distributional and efficiency characteristics instruments Transfer Distributional and efficiency characteristics Transfer instruments OUTCOMES Analysis o f direct transfer policies
Analysis o f indirect
transfer policies
1.5. Summary.
In this chapter I have identified poverty alleviation and the reduction of income inequality as two goals central to income transfers. In examining the progress of the various welfare states towards these goals, this study will use several measures of efficiency and effectiveness to compare the various policy instruments employed in each country to achieve these goals. Thus, the focus is not just on the outcomes of transfer processes, but also on how the various instruments of policy contribute to these outcomes.
Chapter 2 discusses some of the general problems which arise in microdata analyses, how these have been handled in the LIS database, and the operational solutions which this study has adopted to overcome these problems.
21
accommodate the LIS data. Chapter 4 reports the empirical results of the poverty alleviation effectiveness measures and Chapter 5 the empirical results of the efficiency measures.
Chapter 6 reviews the alternative methods employed in the income inequality field, outlines the methodology adopted by the study and describes the assumptions made to accommodate the LIS data. Chapter 7 reports the empirical results of the effectiveness measures, while Chapter 8 looks at how efficiently the outcomes have been produced.
D a t a c o n s t r a i n t s a n d
2.1. Using the LIS data: some general measurement problems.
While Chapters 3 and 6 discuss measurement issues specific to the poverty and income inequality methodologies, there are several methodological and operational issues common to both which are discussed in this chapter. These issues arise from: the unit of analysis; the use of equivalence scales; the choice between recipient characteristics and family types to analyse the incidence of transfers; and the treatment of zero and negative incomes. In each instance, there is no consensus in the literature as to a "best approach" to solving these problems. This requires the study to make quite critical choices about how these problems will be handled in the empirical analysis.
2.1.1. The unit of analysis.
The LIS data sets are derived from three main sources, either surveys of tax files or specifically designed income or consumption surveys. The surveys cover three main types of units, the tax (administrative) unit; the household unit; and the family unit. For a number of countries in this study it is possible to analyse the data from more than one perspective, in others there may be no choice at all. This poses a first difficulty for the study - that of the choice of the unit of analysis.7
In the LIS database units have been coded in such a way as to allow researchers to identify what type of unit the survey data originally covered. For a majority of countries researchers can select units for analysis on either a family or household basis. Appendix A sets out the availability of data for each type of unit. On balance, the 'family' based definition can be applied more uniformly across the data sets than the 'household.' For this reason the family has been chosen as the unit of analysis for this study. This selection is reinforced by the view that in most of the countries, social security and tax policy is directed toward the family rather than the household unit.* 5
The comparability of the unit of observation in the LIS data has been discussed by Smeeding et al (1985a), Hagenaars (1989) and Coder (1990). The comparability of the unit poses two problems for this study. First, calculating the total amount of income, transfers and taxes which accrues to the unit and
second, in estimating the number of people among whom the unit's income is shared.9
The problem may be demonstrated by the example of a family comprising a married couple together with a student aged 18 years residing at home. In the Swedish data set, this 'family' would be considered as two tax units, ie a married couple and a single taxpayer. In Canada, if the student received some economic support from her/his parents, all three would form a single 'economic family'; if not, then two 'economic families' would be reported. In the UK, the student would form part of a single family household regardless of whether the student was financially dependent or independent.
To illustrate the difference which the unit makes to the analysis consider the situations shown in Table 2.1. The table shows a family of identical composition with identical income in Sweden and in the UK. In Sweden, this family would comprise two tax units with income of $9,000 (married couple) and $5,000 (single person); in the UK, the joint family income is $14,000. Using the poverty lines shown in the table, both tax units in Sweden would be considered as poor, adding three persons (or two families) to the poverty head count, while in the UK the joint income puts the unit above the relevant poverty line with no addition to the poverty head count.
Sw eden UK
$ $
Married couple income: 9000 14000 }
Student incom e 5000 combined}
Poverty line in c o m e : MC = 10,000
S = 6,000
MC + 1 = 13,000
Total poverty gap: 2000 0
Poverty head count: 3 persons or
2 fam ilies 0
While the incidence of units such as the one described above are generally a small part of the survey populations, they do affect the results of a number of the measures and these will be noted where relevant.10
9 As the discussion in the following section makes clear, this estimate is critical for the application of equivalence scales. The study leaves aside the related issue raised by the work of Pahl (1980;1984) and Edwards (1981) which challenges the assumption that income is in fact shared equally among the members of a family/household.
26
An additional consideration in the choice of unit of analysis is the weight given to each unit in the various surveys. Essentially, each survey attempts to weight each observation according to the make up of the unit in the total population. Thus if a family comprising a married couple with two children represents 10% of a country’s family units, then the weight given to each unit in the survey will ensure these units will be counted as 10% of the sample. This weight is reported in the LIS database as the variable HWEIGHT.
A second weighting variable is constructed to reflect the weighted number of persons by unit type reported as PWEIGHT=HWEIGHT X NUMBER OF PERSONS. In
most of the measures used in the study, the sample has been weighted by
HWEIGHT. For several of the inequality measures results will be reported for
both PWEIGHT and HWEIGHT weighted samples.
2.1.2. The analysis of family types.
The results of the analysis undertaken in the following chapters will be reported and analysed on a 'family type' basis. Although there is enough detail in the LIS data to allow analysis from the perspective of beneficiary type - for example, those in receipt of age pensions - this level of analysis is difficult in comparative studies. The reasons for this are: beneficiaries may have several sources of income and could therefore be identified with several groups and/or beneficiary categories may not match, may overlap, or may not exist in some countries. Therefore, the approach adopted by the study is to analyse the incidence of transfers for the family types described in Table 2.2. The table also shows the abbreviated reference for each type which will be used in reporting the results throughout the study.
Table reference Aged (S) Aged (C) Single (NC)
Couple (NC) Lone parent
Couple (Ch)
Other Table 2.2. Description of family
Family type Aged single Aged couple Single person, no children
Couple, no children Lone parent
Couple with children
Other
Description of family Single person of official retirement age
Couple, head has reached official retirement age Single person household, no children, head less than official retirement age
Couple, no children, head less than retirement age Single person less than official retirement age, with one or more children under 18 years
Couple, head less than official retirement age, with one or more children under 18 years
All other units