This is a repository copy of
Switching circuit to improve the frequency modulation
difference-intensity THz quantum cascade laser imaging
.
White Rose Research Online URL for this paper:
http://eprints.whiterose.ac.uk/87942/
Version: Accepted Version
Proceedings Paper:
Saat, NK, Dean, P, Khanna, SP et al. (3 more authors) (2015) Switching circuit to improve
the frequency modulation difference-intensity THz quantum cascade laser imaging. In: AIP
Conference Proceedings. NATIONAL PHYSICS CONFERENCE 2014 (PERFIK 2014),
18-19 Nov 2014, Kuala Lumpur, Malaysia. American Institute of Physics . ISBN
978-0-7354-1299-6
https://doi.org/10.1063/1.4915165
[email protected] https://eprints.whiterose.ac.uk/
Reuse
Unless indicated otherwise, fulltext items are protected by copyright with all rights reserved. The copyright exception in section 29 of the Copyright, Designs and Patents Act 1988 allows the making of a single copy solely for the purpose of non-commercial research or private study within the limits of fair dealing. The publisher or other rights-holder may allow further reproduction and re-use of this version - refer to the White Rose Research Online record for this item. Where records identify the publisher as the copyright holder, users can verify any specific terms of use on the publisher’s website.
Takedown
If you consider content in White Rose Research Online to be in breach of UK law, please notify us by
Difference-Intensity THz Quantum Cascade Laser Imaging
N.K. Saat
a,
P. Dean
bS.P. Khanna
b, M. Salih
b,
E.H. Linfield
band A.G. Davies
ba
Department of Physics, Faculty of Science, University Putra Malaysia
b
School of Electronic and Electrical Engineering, University of Leeds, Woodhouse Lane, Leeds LS2 9JT, UK
Abstract. We demonstrate new switching circuit for difference-intensity THz quantum cascade laser (QCL) imaging by amplitude modulation and lock in detection. The switching circuit is designed to improve the frequency modulation so that it can stably lock the amplitude modulation of the QCL and the detector output. The combination of a voltage divider and a buffer in switching circuit to quickly switch the amplitude of the QCL biases of 15.8 V and 17.2 V is successfully to increase the frequency modulation up to ~100 Hz.
Keywords: difference-intensity THz QCL imaging, switching circuit, frequency modulation, voltage divider, buffer
PACS: 85.35.Be
INTRODUCTION
Application of Terahertz (THz) technology in spectroscopy and imaging has led a great intention in this decade. This demand is attributed THz radiation is non-invasive, non-ionizing and many materials having a unique fingerprint in the THz spectrum. There is a lot of THz imaging have been reported such as time domain spectroscopy [1], THz wave parametric generation [2], and passive imaging system [3]. Dual-frequency THz quantum cascade laser (QCL) imaging was reported previously is potentially used to distinguish explosive PETN from other common household material may also potentially performed in the real-time by amplitude modulation and lock in detection [4] However, the amplitude modulation that used for stably locking of the QCL modulation to the modulating waveform was restricted to low frequency modulation (<12 Hz), resulting in longer time to acquire difference intensity image. (i.e. 1 s per pixel with time constant of 200 ms).
In this work, we report switching circuit to improve the frequency modulation difference-intensity THz QCL Imaging. The new switching circuit (consist of a voltage divider and buffer) is used to quickly switch amplitude of the pulses between two QCL biases of 15.8 and 17.2 V where the amplitude of the pulses is controlled by function generator. The amplitude of pulses is successfully switched between those two biases with frequency modulation is increased up to 100 Hz. However, the lock-in detection signal shows a slight delay in response to the frequency modulation signal as the frequency modulation increased >16.8 Hz.
METHODOLOGY
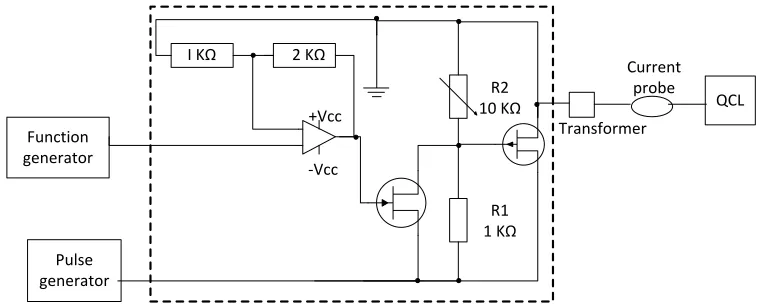
The optical arrangement for difference-intensity THz QCL imaging by amplitude modulation and lock-in detection was described previously in [4]. The switching circuit that used in the imaging system is shown in Figure 1. As shown in Figure 1, the circuit consists of a combination of a voltage divider and a buffer to quickly switch the amplitude of the QCL bias. The input QCL bias was driven in pulsed mode, with a pulse width of 2 s at a repetition rate of 10 kHz at an operating temperature of 15 K, where the amplitude of the pulses was switched between two biases using a function generator. The switching of the pulse amplitude between the two different biases was done using a voltage divider and n-channel MOSFET (metal-oxide-semiconductor field-effect transistor). The n-channel MOSFET was switched by a voltage at the gate, which controlled the current between the source and drain. (In this case, when the gate was ‘off’, the current flow was maximized, so the larger voltage across R2, resulting in the no
voltage potential divider. When the gate was ‘on’, the current flow was minimized, thus the smaller voltage across
PERFIK-2014 Manuscript Template (4-5 pages)
that the current only flowed when the voltage at the collector, Vc was the same as the voltage at the gate, Vg. An
[image:3.612.123.502.117.271.2]operational amplifier (op-amp) was used to double the offset of the amplitude modulation signal so that the switching between two different amplitudes could still occur at higher applied QCL biases.
FIGURE 1. Switching circuit (in dotted box) used to connect the pulse generator for switching the amplitude of two different QCL biases and their amplitude modulation, controlled by the function generator
RESULTS AND DISCUSSION
Characterization of Switching Circuit
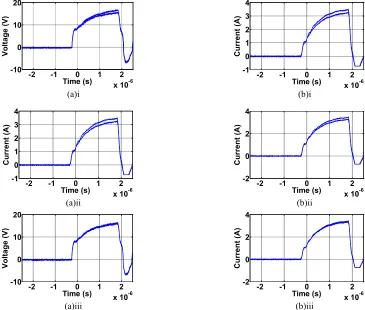
Figure 2 shows oscilloscope traces of the low-amplitude and high-amplitude voltage pulses delivered to the QCL, and the corresponding current pulses obtained using the switching circuit at various frequencies of modulation. As seen in Figure 2, the current and voltage was successfully switched between two different amplitudes as the modulation frequency was increased up to ~100 Hz.
Figure 3 shows the effect of lock-in detector corresponding to the Figure 2. When the frequency modulation was at 16.8 Hz, the detector output shows a slight delay in response, shown as a slope in the rising and falling edges of the detector output (Figure 3 (a)). As the modulation frequency was increased (Figure 3(b) and (c)), the detector output does not match the modulation signal as well. This is attributed to the fact that the bolometer cannot detect the laser power as fast as the rate at which the QCL output is modulated, giving rise to a reduced magnitude of modulation being recorded by the lock-in amplifier.
Imaging Results
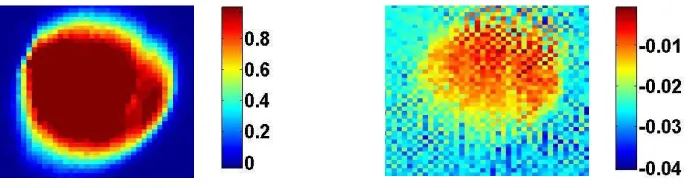
The samples were scanned by raster scanning in two dimensions, without the need to synchronize this scanning with the QCL driving electronics. The QCL was driven by 2- s-long pulses at a rate repetition of 10 kHz, and the bias was switched between two different maximum amplitude bias pulses of 15.8 V and 17.2 V at a modulation frequency of 19 Hz. For this measurement, a 50 ms time constant was used for the lock-in detection, and the measurement time was 2 seconds for each pixel. Figure 4 shows images of the real component from lock in amplifier R cos of the difference-intensity,
I
17.2V
I
15.8V for samples of PETN and lactose monohydrate, respectively. As can be seen, the image of PETN is brighter compared to the lactose monohydrate image, thus demonstrating that PETN can be distinguished from lactose by the magnitude of difference-intensity signal at these biases. The image of lactose monohydrate is not clearly seen. This is attributed to the pulse shape at the two different biases not being perfectly square waves (as seen in Figure 2), together with the low contrast of the attenuation between the two different biases, leads to the small magnitude of the different-intensity for lactose monohydrate. Nevertheless, the real component of the output from the lock-in amplifier still showed different signs, with a positive sign for PETN and a negative sign for lactose monohydrate.Pulse generator Function generator
QCL +Vcc
-Vcc
I K 2 K
R2 10 K
R1 1 K
Transformer Current
probe
(a)i (b)i
(a)ii (b)ii
[image:4.612.117.482.77.387.2](a)iii (b)iii
FIGURE 2 Oscilloscope traces of the minimum and the maximum amplitudes of (a) voltage and (b) current
pulses measured at the QCL using the switching circuit at various switching frequencies of (i) 16.8 Hz, (ii) 75 Hz, and (iii) 167 Hz.
(a) (b)
(c)
FIGURE 3 Effect of the lock-in detection on varied frequency modulation of (a) 16.8 Hz, (b) 75 Hz, and (c) 167 Hz.
-2 -1 0 1 2
x 10-6 -10 0 10 20 Time (s) Vo lta g e (V )
-2 -1 0 1 2
x 10-6 -1 0 1 2 3 4 Time (s) C u rr e n t (A )
-2 -1 0 1 2
x 10-6 -1 0 1 2 3 4 Time (s) C u rr e n t (A )
-2 -1 0 1 2
x 10-6 -2 0 2 4 Time (s) C u rr e n t (A )
-2 -1 0 1 2
x 10-6 -10 0 10 20 Time (s) Vo lta g e (V )
-2 -1 0 1 2
x 10-6 -2 0 2 4 Time (s) C u rr e n t (A )
0 0.02 0.04 0.06 0.08 0.1 -0.3 -0.2 -0.1 0 0.1 0.2 Time (s) O u tp u t d e te c to r (V )
0 0.01 0.02 0.03 0.04 0.05 -0.2 -0.1 0 0.1 0.2 Time (s) O u tp u t d e te c to r (V )
[image:4.612.117.487.463.679.2]PERFIK-2014 Manuscript Template (4-5 pages)
FIGURE 4 Images of output detection using Rcos for samples of 25%-wt PETN (left hand side) and pure lactose monohydrate (right hand side)with their respective colour scale at the modulation frequency of 19 Hz.
CONCLUSION
In summary, we have demonstrated switching circuit to improve the frequency modulation so that it can stably lock the amplitude modulation of the QCL and the detector output. By using switching circuit, the modulation frequency has been improved up to 100 Hz, whereby the voltage and current pulses have successfully been switched between two different amplitudes. We also have demonstrated difference-intensity imaging from this new imaging setup, but with low frequency modulation of 10 Hz due to the slight delay in response of detector output to frequency modulation. The real component of difference-intensity images have been obtained at 17.2 and 15.8 V in a single raster scanning shows their potential in the future for real-time Thz QCL imaging system
ACKNOWLEDGMENTS
We acknowledge support from the EPSRC (UK), EC (NOTES programme), the Government of Malaysia
REFERENCES
1. Z. Yang, Q. Yin and H. Li, "Measurement precision analysis for terahertz absorption spectrum of explosive materials by using terahertz transmissione spectroscopy," in International Symposium on Photoelectronic Detection and Imaging 2013: Terahertz Technologies and Applications, Beijing, China, 2013.
2. S. Hayashi, K. Nawata, H. Sakai, T. Taira, H. Minamide and K. Kawase , "High-power, single-longitudinal-mode terahertz-wave gener ation pumped by amicrochip Nd:YAG laser," Optics Express, vol. 20, no. 3, pp. 2881-2886 , 2012.
3. S. Augustin and H.-W. Hübers, "Phase-Sensitive Passive Terahertz Imaging at 5-m Stand-Off Distance," IEEE Transactions on Terahertz Science and Technology, vol. 4, no. 4, pp. 418 - 424, 2014.