This is a repository copy of
Guidelines for development of indicators, indicator systems
and provide challenges
.
White Rose Research Online URL for this paper:
http://eprints.whiterose.ac.uk/103026/
Version: Published Version
Book:
Becker, Daniel, Schneiderbauer, Stefan, Forrester, John Martin
orcid.org/0000-0002-8730-2671 et al. (1 more author) (2015) Guidelines for development
of indicators, indicator systems and provide challenges. CRED, Louvain , (128pp).
[email protected] https://eprints.whiterose.ac.uk/ Reuse
Items deposited in White Rose Research Online are protected by copyright, with all rights reserved unless indicated otherwise. They may be downloaded and/or printed for private study, or other acts as permitted by national copyright laws. The publisher or other rights holders may allow further reproduction and re-use of the full text version. This is indicated by the licence information on the White Rose Research Online record for the item.
Takedown
If you consider content in White Rose Research Online to be in breach of UK law, please notify us by
i
24-06-2015
Report
Work Package 3
Guidelines for development of
indicators, indicator systems and
provider challenges
Deliverable 3.5
Authors
Daniel Becker EURAC
Stefan Schneiderbauer EURAC
John Forrester SEI-York
Lydia Pedoth EURAC
With contributions from: José M Rodríguez-Llanes (UCL), Hugh
Contract Number: 283201
Project Acronym: emBRACE
Title: Building Resilience Amongst Communities in Europe
Deliverable N°: 3.5
Due date: 31-05-2015
Delivery date: 24-06-2015
Short Description: This deliverable 3.5 discusses indicators and indicator systems
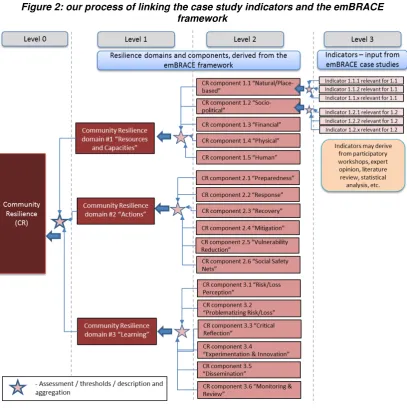
of community resilience by taking into account current research activities and findings obtained from the emBRACE project. We propose to use an integrated approach for assessing community resilience by means of indicators, considering multiple level of measurements, scales and perspectives of community resilience. The emBRACE conceptual framework and the empirical grounded indicators of the emBRACE case studies allow us to derive key-indicators of community resilience that can be applied across different contexts and types of natural hazards.
Lead Beneficiary: EURAC
Partner/s contributed: SEI-York, UCL, UoN
Made available to: all partners
Version Control
Version Date Name, Affiliation
0.1 27-05-2015 Daniel Becker
0.2 22-06-2015 John Forrester, José M Rodríguez-Llanes
ii
Acknowledgements
Funding for this report was made available by the European Commission under the 7th Framework Programme – Grant Agreement No 283201. emBRACE
Contact:
Technical Coordination (Administration)
Centre for Research on the Epidemiology of Disasters (CRED)
Institute of Health and Society Université catholique de Louvain
30 Clos Chapelle-aux-Champs, Bte 30.15
1200 Brussels
Belgium
T: +32-2-764.33.27
E:
[email protected]
W:
www.cred.be
Technical Coordination (Science)
School of the Built and Natural Environment,
University of Northumbria
Newcastle upon Tyne
NE1 8ST,
UK
T: + 44 (0)191 232 6002
E:
[email protected]
W:
www.northumbria.ac.uk
About emBRACE
The primary aim of the emBRACE project is to build resilience to disasters amongst communities in Europe. To achieve this, it is vital to merge research knowledge, networking and practices as a prerequisite for more coherent scientific approaches. This we will do in the most collaborative way possible.
Specific Objectives
Identify the key dimensions of resilience across a range of disciplines and domains
Develop indicators and indicator systems to measure resilience concerning natural disaster events
Model societal resilience through simulation experiments
Provide a general conceptual framework of resilience, tested and grounded in cross-cultural contexts
Build networks and share knowledge across a range of stakeholders
Tailor communication products and project outputs and outcomes effectively to multiple collaborators, stakeholders and user groups
The emBRACE Methodology
The emBRACE project is methodologically rich and draws on partner expertise across the research methods spectrum. It will apply these methods across scales from the very local to the European.
Partners
Université catholique de Louvain (UCL) -
Belgium
University of Northumbria at Newcastle (UoN) -
UK
King’s College London (KCL)
-
UK
United Nations University Institute for Environment and Human
Security (UNU),
Bonn
Accademia Europea per la Ricerca Applicata ed il Per-fezionamento
Professionale Bolzano (EURAC) -
Italy
Helmholtz-Zentrum Fuer Umweltforschung GMBH - UFZ (UFZ) -
Germany
University of York (SEI-Y) -
UK
Stockholm Environment Institute - Oxford Office Limited (SEI-O) -
UK
Swiss Federal Institute for Forest, Snow and Landscape Research -
WSL (WSL) -
Switzerland
Table of Contents
1. Introductory part ... 1
1.1 Aim, target group and structure of the deliverable ... 1
1.2 Research needs and user requirements ... 2
2. Resilience indicators ... 4
2.1 Definitions and terms ... 4
2.2 Potentials and challenges of resilience assessments by means of indicators ... 7
2.3 Relationship between vulnerability indicators and resilience indicators ... 8
2.4 State-of-the-art: indicators for community resilience ... 9
2.4.1 Qualitative indicator-based approaches ... 10
2.4.2 Quantitative indicator-based approaches ... 24
2.5 Summary findings on indicators of community resilience ... 30
3. Community resilience indicators within emBRACE ... 34
3.1 From concept to assessment: emBRACE framework & indicators ... 34
3.1.1 The emBRACE definition of community resilience indicators ... 34
3.1.2 Do we need new set of indicators? ... 36
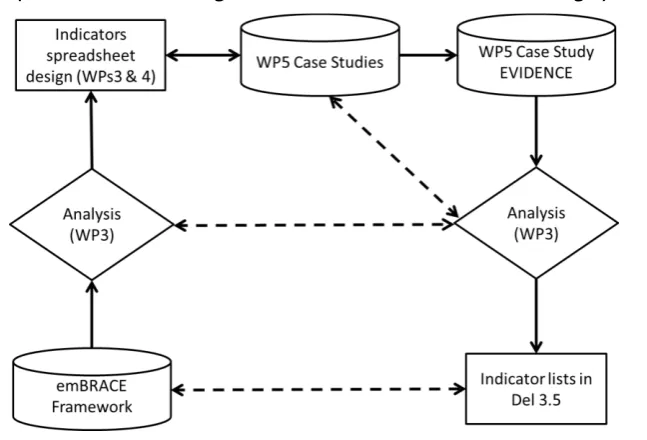
3.1.3 The process of grounding our indicator set ... 38
3.2 Indicators identified by the emBRACE case studies ... 46
3.2.1 Classification of indicators ... 47
3.2.2 Condensed list of indicators ... 55
3.2.3 List of emBRACE key-indicators ... 68
4. Challenges of indicator use in practice ... 73
4.1 Indicator development and application ... 73
4.2 Typical challenges and pitfalls ... 82
5. Conclusions ... 85
6. References ... 87
DRAFT
1. Introductory part
1.1 Aim, target group and structure of the deliverable
Indicators and indicator systems are perceived as important instruments to assess, measure and evaluate resilience. Current research activities focus on developing reliable indicators that apply at different scales and policy realms and address different types of shocks and perspectives of resilience. This deliverable 3.51 aims to
contribute to the research activities by integrating results from latest literature on resilience indicators (state-of-the-art) and the findings obtained from the emBRACE project. We therefore focus on community resilience to natural hazards and rely to a great extent on the conceptual approach and the five case studies within emBRACE. We reveal the potentials and advantages of indicator-based approaches for
assessing community resilience and present indicators that enable transferring theoretical and conceptual considerations into specific applications. At the same time, we underline the challenges and limitations of such approaches considering in particular the conceptual understanding of resilience and case study approaches within emBRACE (cf. emBRACE ‘Description of Work’ document (DoW): 13). The deliverable is composed of one main report (this one) and one additional policy brief. The main report is intended for scientists, who work in applied research as well as practitioners with academic background and/or academic interest. It comprises three main parts. The first part deals with conceptual and theoretical aspects of resilience indicators and summarises current research activities in this field (chapter 2). The second part describes the procedure within emBRACE of developing the ‘emBRACE indicators’ and presents the selected ‘key-indicators’ of community resilience (chapter 3). The last part outlines major challenges of indicator use in practice by pointing out important steps of indicator development and application, as well as typical challenges and potential pitfalls (chapter 4). The shorter ‘policy brief’ is designed for policy makers and advisors and aims at supporting the decision-making process within communities for assessing resilience by means of indicators. The policy brief provides a quick overview of what the full report has to offer including
1 Throughout this document reference will be made to the other emBRACE reports,
whose delivery has underpinned the development of this Del 3.5 output. All these project deliverables are available for download from the project website
practical considerations on resilience indicators, a guideline summary and a collection of key-indicators.
Incorporating previous work in emBRACE, deliverable 3.5 draws upon several work packages and deliverables, especially WP1 (literature review; especially BIRKMANN et al. 2012b and ABELING et al. 2014), WP2 (conceptual framework), WP3 (disaster data review; especially RODRIGUEZ-LLANES et al. 2013 and RODRIGUEZ-LLANES et al. 2015), WP5 (case studies) and WP6 (refinement of the framework).
1.2 Research needs and user requirements
Most researchers in the field emphasise that research on measuring community resilience is still in the early stages of development. Current approaches mainly draw on indicators, however no single or widely accepted method exists so far (CUTTER et al. 2014: 66). This is particularly the case for community resilience to disasters, since this concept raises not only questions related to the measurement of resilience, but also related to the definition and conceptualisations of communities. Whilst in the past few years a couple of articles have been published that present first attempts to consolidate research on community resilience indicators (e.g. TWIGG 2007; NORRIS et al. 2008; CUTTER et al. 2010), academic literature still struggles with developing concrete assessment approaches and reliable indicators (cf. ABELING et al. 2014; BIRKMANN et al. 2012b).
We identified two main research needs/user requirements: One stemming from academic research to advance the conceptual understanding of community resilience and one stemming from practitioners and policy makers/advisors to provide concrete indicators that are applicable in practice. Both are to some extent iteratively related since a clear understanding and definition of the concept is the prerequisite for developing sound indicators.
2. Resilience indicators
2.1 Definitions and terms
The term ‘indicator’ is widely used in research, especially in the interface between science and policy. However, despite its popularity, the term remains often
ambiguous, which is partially due to the different definitions and applications of the concept in many scientific fields (chemistry, medicine, economy, ecology, sociology, etc.). From a basic understanding, an indicator ‘indicates’ something from which conclusions on the phenomenon of interest (indicandum) can be inferred. This indicandum is often difficult to grasp, thus, in the common understanding, indicators communicate simplified information about specific circumstances that are not directly measurable, or can only be measured with great difficulty (MEYER in STOCKMANN 2011: 192). In this sense, we use the definition of FREUDENBERG in this deliverable and understand an indicator as a “quantitative or qualitative measure derived from observed facts that simplify and communicate the reality of a complex situation” (FREUDENBERG 2003 in BURTON 2015: 4).
Indicators may be more or less direct in their relationship to the phenomenon they are intended to measure. An example of a direct indicator is the rainfall amount as an indicator for precipitation. Indirect indicators or so-called proxy indicators are used when direct measurements are unfeasible or inappropriate. Proxy indicators are also applied for highly complex parameters or when no data are available. A widely used example is the GDP (Gross Domestic Product), which has been used as a proxy for economic performance. Proxy indicators can be useful for describing non-tangible factors but their validity, that is, their explanatory power in relation to the factor in question, must be verified and approved (FRITZSCHE et al. 2014: 77).
An increasingly popular role in informing policy making is played by so-called
composite indicators (or indices). They allow for measuring phenomena of interest
that can hardly be captured by one indicator through combining several single
Indicators are often distinguished according to different criteria. One method is to classify/systematise indicators according to their domains/perspectives. In terms of resilience, we could apply for example indicators referring to ecological and social-ecological resilience, psychological resilience, critical infrastructural resilience or organisational and institutional resilience (cf. BIRKMANN et al. 2012b). Another example is the classification according to the indicator content, i.e. in terms of resilience: risk information, hazard experience, risk assessment, disaster preparedness, recovery, etc. This type of classification is simple but as MEYER states “often the content of indicators is less interesting in classifying indicators than criteria related to the measurement of indicators” (MEYER in STOCKMANN 2004: 194). Therefore, a common practice to classify indicators is the distinction between qualitative and quantitative indicators. However, this distinction is not as
straightforward as it might seem, since there is no clear definition of ‘quantitative data’ or ‘qualitative data’ upon which an indicator can rely. Rather, quantitative and qualitative indicators are distinguished according to the so-called ‘level of
measurement’ (see MEYER in STOCKMANN 2011: 201ff.):
- Nominal scales (also called categorical scales): every indicator value can be allocated to exactly one class. The categories differ according to their quality where no ordering or ranking between classes is possible. Nominal scales represent the lowest level of measurement and do not allow statements whether one indicator value is better than another. Examples include ‘gender’ or ‘hazard type’.
- Ordinal scales: they indicate whether one given indicator value is larger or smaller (higher or lower, better or worse, etc.) in comparison with another. Ordinal scales allow a ranking of classes, but the interval between classes is undefined or unknown. Examples include ‘education level’ or the ‘resistance of house types against earthquake events’.
- Interval scales: interval scales allow for creating equal, constant and
quantifiable intervals between the classes. They represent the highest level of measurement. Examples include ‘net income in €/year’ or ‘temperature in °C’2.
2 Some authors also distinguish a fourth level of measurement, the ‘ratio scales’. These
In the strict sense, one can argue whether it is useful to use indicators that apply at the nominal scale, since no interpretation or evaluation of values is possible. Taking the example of ‘gender’, we cannot state whether female or male is the ‘better’, ‘higher’, ‘greater’, etc., but, in combination with other indicators gender is definitely of interest. If you combine ‘gender’ for example with an indicator measuring the ‘social support after a hazard event’, you could draw important inferences about the different usage of social networks of male and female persons (which might be of interest when assessing community resilience). In this case, gender can be used as an additional ‘quality’ to help analysing and interpreting other measures.
One condition of quantitative indicators, in contrast to qualitative indicators, is that they have to be fully operationalised. For example, the indicator ‘% of citizens with access to WAP-enabled mobile phones’ is a fully operationalised
quantitative/objective indicator, whereas ‘trust in authorities’ is an example of a qualitative/subjective indicator covering individual judgements, perceptions and feelings that cannot so easily be represented by numerical constants. However, it is possible to make qualitative indicators ‘quantifiable’. One way of doing so, is to derive proxies, another is the use of a rating scale (e.g. the commonly-used Likert scale), a ‘structured subjective’ method (e.g. see FORRESTER et al. 2015 after EDEN et al. 2005) or coding schemes (e.g. emergent coding through word clouds or content analysis). Each of these can be used to derive a numerical output from subjective, qualitative data. However, it has to be noted that despite transferring qualitative indicators into quantitative metrics, the underlying information remains still subjective. Also, the interpretation of Likert scales for example is always based on the subjective opinion of the person filling in the original questionnaire.
Another (and here last discussed) type of classification that is of interest for resilience indicators, is the distinction between outcome and process indicators. Per
as its rarity or occurrence at some distant time. […] In such a case, measuring processes (linked to the outcome) with process indicators is more useful than measuring the outcome itself” (O’LEARY 2004: 48).
2.2 Potentials and challenges of resilience assessments by
means of indicators
Indicators are used in particular for benchmarking, targeting, monitoring and
evaluating performances and transformation. Also, for measuring resilience indicator-based approaches seem to be promising tools, as they allow – when evaluated at regular intervals – monitoring changes over time in both magnitude and direction, as well as space (CUTTER et al. 2010: 2). They allow for identifying major weaknesses or drawbacks of resilience and in terms of disaster resilience, indicators help setting policy priorities, allocating resources – financial, personal, technical, etc. – before and after a hazard event and evaluating the effectiveness of risk reduction efforts or emergency activities (OECD 2008: 13; GALL 2013: 15).
However, the purpose and intention of using indicator-based approaches differs. Most applications focus on prioritising and targeting of activities or performances, but with different emphasis on the need to compare and monitor indicator values. For example, the use of qualitative indicators for constant comparison and evaluation of changes in the spatial and temporal term is very much more difficult (albeit not impossible) than with quantitative indicators. That is – because the data is subjective – any change observed is less generalisable. Of course, the same caveat applies to some interval scale quantitative indicators, for example ‘net income in €’. However, the critical difference is that with straight-quantitative interval scale indicators the figures can be adjusted to take externalities (i.e. the passage of time or national average incomes) into account, the same cannot be done so relatively simply with qualitative ordinal scales3.
BIRKMANN et al. 2012b: state, that the “fundamental challenge of assessing resilience is to answer the question of why this is intended, in the first place”
(BIRKMANN et al. 2012b: 14). Being explicit about the objectives and motivations of
3 There are attempts to come up with scales for comparing very subjective phenomena (e.g.
measuring resilience is of critical importance for choosing the right assessment approaches (see chapter 4.1). Also, it requires a clear design of the assessment study (scale of application, target group, conceptualisation of resilience, policy realm, etc.), since in contrast to concepts and frameworks, studies are always case-specific. As former emBRACE deliverables concluded, resilience is a multidimensional and transformative concept that seems to be difficult to measure (cf. BIRKMANN et al. 2012b: 13). ARMITAGE et al. noted that “resilience is complex, context-specific, and highly dynamic – all characteristics that make it hard to operationalize and measure through simple proxies” (ARMITAGE et al. 2012: 6). Developing a comprehensive, standardised set of resilience indicators is obviously very difficult for such a dynamic, constantly re-shaping and context-dependent concept. However, taking into account these challenges, we believe that indicator-based approaches provide valuable tools for measuring resilience, since indicators offer means to evaluate transformation (and transformative capacity) and provide flexibility in terms of data collection, as well as levels of measurement and scales to be chosen. The key-challenge seems to be to select/develop the right indicator approach that integrates current conceptualisations and operationalisations of resilience. Within emBRACE the basic preconditions for deriving indicators are a conceptual framework and indicators that are empirically grounded within the case studies and local research.
2.3 Relationship between vulnerability indicators and
resilience indicators
Resilience and vulnerability are related terms, even though the relationship between both concepts is not clearly defined (GALL 2013, CUTTER et al. 2014). Both are perceived as multi-faceted concepts which require trans-disciplinary research approaches (DEEMING et al. 2013: 4). They focus on adaptive capacities, which can be viewed as a set of socio-economic, natural, institutional, et al. resources and capacities that allow systems (e.g. communities) to be better prepared and capable of mitigating negative impacts. But, while vulnerability focuses more on static stressors such as the exposure and sensitivity (IPCC definition4), and, respectively,
4
“Vulnerability is the degree to which a system is susceptible to, and unable to cope with,
the hazard, exposure and disaster risk (UNISDR definition5) of the system, resilience
is a dynamic concept. Thus, resilience adds – somehow as a unique characteristic – transformative aspects such as learning, critical reflection or re-organisation. In terms of the assessment methodologies, both concepts differ. Whereas research efforts on vulnerability indicators have increasingly provided useful indicators that are being applied in different fields of application, such as climate change vulnerability, food security, hazard mitigation planning or social vulnerability (cf. for example ADGER et al. 2004), indicators represent a rather new approach for assessing (community) resilience. This might be due to the challenges that occur when
implementing operational frameworks of resilience or because of the transformative nature of resilience. GALL in this context notes that “given the novelty of resilience frameworks and the challenges associated with their implementation, researchers tend to rely on approaches and methodologies developed elsewhere – such as in the vulnerability community” (GALL 2013: 21). In fact, many approaches of measuring resilience rely on similar methods and indicators as they have been used, for example, in vulnerability assessments, even though the differences between both concepts are clearly emphasised by all presented studies. This suggests that, rather than relying on existing indicator systems, we should focus on trying to integrate the achievements developed in previous adjacent concepts (such as social vulnerability, social sustainability or adaptive management) into recent resilience assessment approaches and methodologies (see also KELMAN et al. 2015).
2.4 State-of-the-art: indicators for community resilience
In this chapter we summarise the latest research activities on indicators ofcommunity resilience. We considered in particular literature identified by WP1 and WP3 (especially BIRKMANN et al. 2012b; ABELING et al. 2014 and RODRIGUEZ-LLANES et al. 2013) and conducted our own non-systematic literature review (limited
system is exposed, its sensitivity, and its adaptive capacity”
(http://www.ipcc.ch/publications_and_data/ar4/wg2/en/annexessglossary-p-z.html) 5“The characteristics and circumstances of a community, system or asset that make it susceptible to the damaging effects of a hazard”
in extend) that included both, academic and non-academic literature6. The literature
review revealed broadly two main techniques of resilience assessments by means of indicators that are further discussed in the following:
(1) Qualitative indicator-based approaches that focus on identifying important characteristics of community resilience and self-assessments, and
(2) Quantitative indicator-based approaches that focus on developing composite indicators (‘resilience indices’) and quantifying resilience.
2.4.1 Qualitative indicator-based approaches
One of the most cited papers addressing community resilience indicators is the guidance note of John TWIGG‚ Characteristics of a Disaster Resilient
Community’ (TWIGG 2007), which summarises from his perspective the most
important components that shape community resilience. TWIGG understands
community resilience as a multi-faceted concept that goes beyond isolated capacities and views communities not only in spatial terms, but recognises also common
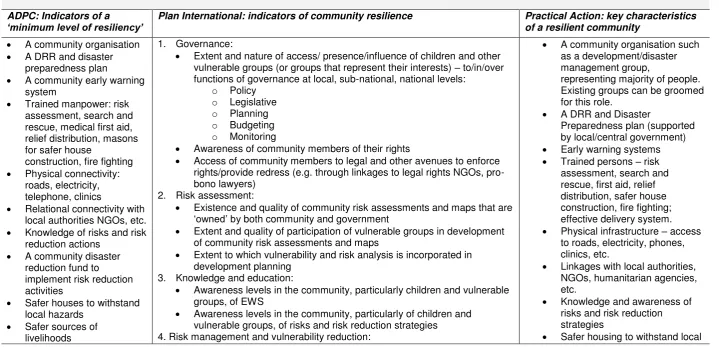
interests, values, activities and social structures (TWIGG 2007: 6). The disaster resilient community in this sense is defined as an ideal state, which in reality is never achievable. TWIGG’s guidance note includes a list of ‘key indicators of community resilience’, which has been assembled based on reports of three non-governmental organisations involved in DRR and international development cooperation:
Table 1: collection of key-indicators of community resilience by TWIGG 2007 (TWIGG 2007: 12-13) Key indicators of community resilience
Some organisations and researchers are beginning to think about the most important indicators of resilience with a view to setting priorities for DRR interventions. No consensus has been reached on this but recent suggestions include the following:
ADPC: Indicators of a
‘minimum level of resiliency’ Plan International: indicators of community resilience Practical Action: key characteristics of a resilient community
A community organisation A DRR and disaster
preparedness plan
A community early warning system
Trained manpower: risk assessment, search and rescue, medical first aid, relief distribution, masons for safer house
construction, fire fighting Physical connectivity:
roads, electricity, telephone, clinics
Relational connectivity with local authorities NGOs, etc. Knowledge of risks and risk
reduction actions A community disaster
reduction fund to implement risk reduction activities
Safer houses to withstand local hazards
Safer sources of livelihoods
1. Governance:
Extent and nature of access/ presence/influence of children and other vulnerable groups (or groups that represent their interests) – to/in/over functions of governance at local, sub-national, national levels:
o Policy o Legislative o Planning o Budgeting o Monitoring
Awareness of community members of their rights
Access of community members to legal and other avenues to enforce rights/provide redress (e.g. through linkages to legal rights NGOs, pro-bono lawyers)
2. Risk assessment:
Existence and quality of community risk assessments and maps that are
‘owned’ by both community and government
Extent and quality of participation of vulnerable groups in development of community risk assessments and maps
Extent to which vulnerability and risk analysis is incorporated in development planning
3. Knowledge and education:
Awareness levels in the community, particularly children and vulnerable groups, of EWS
Awareness levels in the community, particularly of children and vulnerable groups, of risks and risk reduction strategies 4. Risk management and vulnerability reduction:
A community organisation such as a development/disaster management group,
representing majority of people. Existing groups can be groomed for this role.
A DRR and Disaster
Preparedness plan (supported by local/central government) Early warning systems Trained persons – risk assessment, search and rescue, first aid, relief distribution, safer house construction, fire fighting; effective delivery system. Physical infrastructure – access
to roads, electricity, phones, clinics, etc.
Linkages with local authorities, NGOs, humanitarian agencies, etc.
Knowledge and awareness of risks and risk reduction strategies
Extent and nature of social capital Health status
Sustainable livelihoods/natural resource management Extent of climate change adaptation
Food security
Extent of diversity of livelihood options Extent to which DRR has been integrated into development planning
Access to social protection mechanisms e.g. social insurance 5. Disaster preparedness and response:
Existence and quality of early warning systems
Existence, practice and revision of preparedness and contingency plans Extent and nature of participation of vulnerable groups in development,
practice and revision of preparedness and contingency plans Extent and quality of linkages with local authorities, NGOs, etc.
Extent of diversity of physical and communications infrastructure and assets, e.g. roads, boats, mobile phones, etc.
Access to resources for mitigation, response and recovery activities
hazards
Safer/appropriate/more diverse sources of livelihoods including protection of assets most at risk. Access to resources for
mitigation, response and recovery activities
Source: ADPC 2006, Critical Guidelines: Community-based Disaster Risk Management (Bangkok: Asian Disaster Preparedness Center; www.adpc.net) p.25
The indicators include both outcome and process indicators and cover a broad range of topics ranging from risk assessments, risk knowledge and information, disaster preparedness, participation, social and economic capital, physical infrastructure, insurance, funding, etc. TWIGG stresses the need to adapt the indicators to the specific local context of the resilience assessment, the applied methods and involved stakeholders.
An interesting approach of assessing community resilience is provided by UNISDR and their ‘Making Cities Resilient’ initiative (UNISDR 2012). They have developed their ‘local government self-assessment tool’ to enable urban communities to set baseline scenarios for measuring disaster resilience, to measure advancements over time and to argue for priority settings and budget allocation within city councils and national governments (UNISDR 2012: 78). Their assessment should be undertaken in a multi-stakeholder process comprising local government authorities, civil society organisations, local academia, business community and community-based
organisations. As part of the Making Cities Resilient initiative, UNISDR developed the ‘Ten Essentials for Making Cities Resilient’ that are aligned to the Hyogo
Framework’s priorities for Action and core indicators (see UNISDR 2012: 25). It includes also a so-called ‘Disaster Resilience Scorecard for Cities’that identifies eighty-five ‘disaster resilience evaluation criteria’ which are divided again in several ‘local-context indicators’ (UNISDR 2014). The following table shows the ten essentials and the associated key questions underpinning the UNISDR approach (the entire list of indicators is too large for this report, but can be accessed through the Disaster Resilience Scorecard for Cities7):
DRAFT
Table 2: key questions for self-assessment based on the “Ten Essentials for Making Cities Resilient” (UNISDR 2012: 80-82)
Ten Essentials for Making Cities Resilient
Key Questions per Essential
ESSENTIAL 1:
Put in place organization and coordination to clarify
everyone’s roles and
responsibilities
1. How well are local organizations (including local government) equipped with capacities (knowledge, experience, official mandate) for disaster risk reduction and climate change adaptation?
2. To what extent do partnerships exist between communities, private sector and local authorities to reduce risk? 3. How much does the local government support vulnerable local communities (particularly women, elderly, infirmed, children) to actively participate in risk reduction decision making, policy making, planning and implementation processes? 4. To what extent does the local government participate in national DRR planning?
ESSENTIAL 2:
Assign a budget and provide incentives for homeowners, low-income families and the private sector to invest in risk reduction
5. To what extent does the local government have access to adequate financial resources to carry out risk reduction activities?
6. To what degree does the local government allocate sufficient financial resources to carry out DRR activities, including effective disaster response and recovery?
7. What is the scope of financial services (e.g. saving and credit schemes, macro and micro-insurance) available to vulnerable and marginalised households for pre-disaster times?
8. To what extent are microfinancing, cash aid, soft loans, loan guarantees, etc. available to affected households after disasters to restart livelihoods?
9. How well established are economic incentives for investing in disaster risk reduction for households and businesses (e.g. reduced insurance premiums for households, tax holidays for businesses)?
10. To what extent do local business associations, such as chambers of commerce and similar, support efforts of small enterprises for business continuity during and after disasters?
ESSENTIAL 3:
Update data on hazards and vulnerabilities, prepare and share risk
assessments
11. To what degree does the local government conduct thorough disaster risk assessments for key vulnerable development sectors in your local authority?
12. To what extent are these risk assessments regularly updated, e.g. annually or on a bi-annual basis?
14. How well are local government risk assessments linked to, and supportive of, risk assessments from neighbouring local authorities and state or provincial government risk management plans?
15. How well are disaster risk assessments incorporated into all relevant local development planning on a consistent basis?
ESSENTIAL 4:
Invest in and maintain risk reducing infrastructure, such as storm drainage
16. How far do land use policies and planning regulations for housing and development infrastructure take current and projected disaster risk (including climate related risks) into account?
• housing • communication • transportation • energy
17. How adequately are critical public facilities and infrastructure located in high-risk areas assessed for all hazard risks and safety?
18. How adequate are the measures being taken to protect critical public facilities and infrastructure from damage during disasters?
ESSENTIAL 5:
Assess the safety of all schools and health facilities and upgrade these as necessary
19. To what extent have local schools, hospitals and health facilities received special attention for “all hazard” risk
assessments in your local authority?
20. How safe are all main schools, hospitals and health facilities from disasters so that they have the ability to remain operational during emergencies
21. To what degree do local government or other levels of government have special programs in place to regularly assess schools, hospitals and health facilities for maintenance, compliance with building codes, general safety, weatherrelated risks etc.?
22. How far are regular disaster preparedness drills undertaken in schools, hospitals and health facilities?
ESSENTIAL 6:
Enforce risk compliant building regulations and land use planning, identify safe land for low-income
23. How well enforced are risk-sensitive land use regulations, building codes, and health and safety codes across all development zones and building types?
citizens
ESSENTIAL 7:
Ensure education programmes and training on disaster risk reduction are
in place in schools and communities
25. How regularly does the local government conduct awareness-building or education programs on DRR and disaster preparedness for local communities?
26. To what extent does the local government provide training in risk reduction for local officials and community leaders? 27. To what degree do local schools and colleges include courses, education or training in disaster risk reduction (including climate-related risks) as part of the educational curriculum?
28. How aware are citizens of evacuation plans or drills for evacuations when necessary?
ESSENTIAL 8:
Protect ecosystems and natural buffers to mitigate hazards, adapt to climate change
29. How well integrated are the DRR policies, strategies and implementation plans of local government into existing environmental development and natural resource management plans?
30. To what degree does the local government support the restoration, protection and sustainable management of ecosystems services?
31. To what degree do civil society organizations and citizens participate in the restoration, protection and sustainable management of ecosystems services?
32. To what degree does the private sector participate in the implementation of environmental and ecosystems management plans in your local authority?
ESSENTIAL 9:
Install early warning systems and emergency management capacities
33. To what degree do local institutions have access to financial reserves to support effective disaster response and early recovery?
34. To what extent are early warning centres established, adequately staffed (or on-call personnel) and well resourced (power back ups, equipment redundancy etc.) at all times?
35. How much do warning systems allow for adequate community participation?
36. To what extent does the local government have an emergency operations centre (EOC) and/or an emergency communication system?
37. How regularly are training drills and rehearsals carried out with the participation of relevant government, non-governmental, local leaders and volunteers?
evacuation routes and contingency plans at all times?
ESSENTIAL 10:
Ensure that the needs and participation of the affected population are at the centre of reconstruction
39. How much access does the local government have to resources and expertise to assist victims of psycho-social (psychological, emotional) impacts of disasters?
40. How well are disaster risk reduction measures integrated into post-disaster recovery and rehabilitation activities (i.e. build back better, livelihoods rehabilitation)?
The UNISDR approach represents a very comprehensive collection of ‘key-questions’ and indicators related to disaster resilience. Since the focus is set on urban
communities, many indicators of the Scorecard address critical infrastructures that gain importance in the case of a disaster event, such as the healthcare system, electricity, transportation, sanitation, water and gas networks or the supply networks of food, shelter, staple goods and fuel. However, the indicators cover also
governmental aspects such as the coordination of local government institutions involved in disaster related activities or the participation and engagement of local citizens, vulnerable groups and grass-root organisations. Other essential indicators encompass disaster risk assessment (awareness, knowledge of hazard risks, exposure and vulnerability, etc.), early warning systems, building codes, land use planning, financial planning (contingency, insurance, etc.), as well as training drills and education. Through further guidance on how to best measure the identified indicators, the Scorecard becomes a valuable source of information.
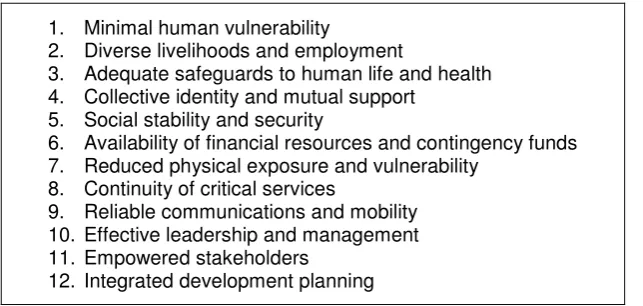
The ‘City Resilience Framework’ developed by Arup International Development
[image:25.595.141.463.592.745.2]and the Rockefeller Foundation should support municipal governments in making their cities resilient (ARUP & ROCKEFELLER FOUNDATION 2014). The intention is to create a ‘City Resilience Index’ based on different single indicators allowing to measure resilience at the city scale. The report provides 12 ‘key indicators’ that should in future be further divided into 48-54 ‘sub-indicators’ and 130-150 ‘variables’. However, until now, the report provides merely these 12 key-indicators that reveal important components of a resilient urban community. The sub-indicators and variables are not yet provided. The 12 key-indicators of the City Resilience Framework are:
Table 3: the 12 key-indicators of the City Resilience Framework (ARUP & ROCKEFELLER
FOUNDATION 2014: 7)
1. Minimal human vulnerability
2. Diverse livelihoods and employment
3. Adequate safeguards to human life and health 4. Collective identity and mutual support
5. Social stability and security
6. Availability of financial resources and contingency funds 7. Reduced physical exposure and vulnerability
8. Continuity of critical services
9. Reliable communications and mobility 10. Effective leadership and management 11. Empowered stakeholders
According to the ARUP & ROCKEFELLER FOUNDATION, the intention of the initiative is to help cities allocating their investment decisions and to engage in urban planning practices that ensure a resilient city (independently to the shock they encounter). The objective of the city resilience index is not to rank or compare cities, but rather to “better understand what it is that makes a city resilient” (ARUP & ROCKEFELLER FOUNDATION 2014: 21). Hence, this approach can be regarded as conceptual, that requires support for operational application.
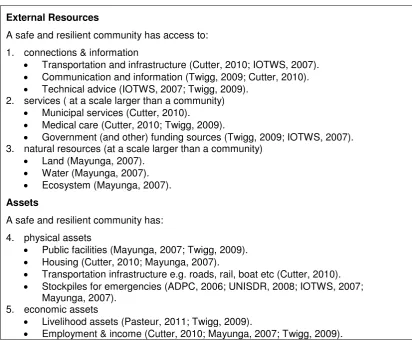
Another noteworthy paper is the report of the International Federation of Red Cross and Red Crescent Societies in 2012 about ‘Characteristics of a Safe and Resilient
Community’ (IFRC 2012), which has been developed in order to mainstream
[image:26.595.84.497.406.757.2]community resilience in all ‘community-based disaster risk reduction programs’ of the Red Cross. Without identifying its own indicators of community resilience, the report includes a valuable and very comprehensive collection of characteristics of a safe and resilient community. The characteristics are justified by important literature on community resilience indicators:
Table 4: characteristics of a safe and resilient community (IFRC 2012: 14-16)
External Resources
A safe and resilient community has access to: 1. connections & information
Transportation and infrastructure (Cutter, 2010; IOTWS, 2007). Communication and information (Twigg, 2009; Cutter, 2010). Technical advice (IOTWS, 2007; Twigg, 2009).
2. services ( at a scale larger than a community) Municipal services (Cutter, 2010).
Medical care (Cutter, 2010; Twigg, 2009).
Government (and other) funding sources (Twigg, 2009; IOTWS, 2007). 3. natural resources (at a scale larger than a community)
Land (Mayunga, 2007). Water (Mayunga, 2007). Ecosystem (Mayunga, 2007).
Assets
A safe and resilient community has: 4. physical assets
Public facilities (Mayunga, 2007; Twigg, 2009). Housing (Cutter, 2010; Mayunga, 2007).
Transportation infrastructure e.g. roads, rail, boat etc (Cutter, 2010). Stockpiles for emergencies (ADPC, 2006; UNISDR, 2008; IOTWS, 2007;
Mayunga, 2007). 5. economic assets
Livelihood assets (Pasteur, 2011; Twigg, 2009).
Savings and contingency fund (Mayunga, 2007, UNISDR, 2008; Twigg, 2009). Investment (Mayunga, 2007).
Insurance (Twigg, 2009).
Business/industry (CRPT, 2000; Mayunga, 2007). 6. environmental assets
Ownership of natural resources (Bahadur, 2010; Twigg, 2009). 7. human assets
Local and traditional knowledge (Bahadur, 2010; Mayunga, 2007; IFRC, 2008; ADPC, 2006; Twigg, 2009).
Skills (Pasteur, 2011; Mayunga, 2007; Twigg, 2009). Language competency (Cutter, 2010).
Health (Cutter, 2010; Mayunga, 2007; Twigg, 2009).
Education (CRPT, 2000; Mayunga, 2007; Twigg, 2009; IOTWS, 2007). 8. social assets
Community cohesion and cooperation (Bahadur, 2010; Mayunga, 2007; Twigg, 2009).
Religion (Cutter, 2010).
Community organisations with collaborative/partnership relationships eg. Economic development organisations (Bahadur, 2010; CRPT, 2000; Mayunga, 2007).
9. political assets
Effective and flexible governance and institutional structures (Bahadur, 2010, Cutter, 2010, Twigg, 2009).
Representative governance and institutional structures (Twigg, 2009; Bahadur, 2010; Pasteur, 2011; Cutter, 2010).
Capacities
A safe and resilient community has the capacity to: 10. be resourceful
Mobilise resources and services when needed (O’Rouke, 2008; Arup, 2010;
Pasteur, 2010; CDRT, 2000). Visualise and act (Arup, 2010).
Identify problems and establish priorities (Arup, 2010). Innovate (Cutter, 2010).
Coordinate and provide emergency relief (Twigg, 2009). 11. be adaptive/flexible
Adapt to long term trends (organise and re-organise) (Pasteur, 2011; Arup, 2010). Convert assets (Arup, 2010).
Accept uncertainty and proactively respond to change (Bahadur, 2010; Pasteur, 2011).
12. learn
Build on past experiences and integrate it with current knowledge (Arup, 2010; IFRC, 2008; ADPC, 2006; Bahadur, 2010; Twigg, 2009).
Assess, manage and monitor risks (IFRC, 2008; Pasteur, 2011; Bahadur, 2010). Build back after a disaster in such a way that reduces vulnerability (IFRC, 2008;
Pasteur, 2011).
Qualities
A safe and resilient community has assets /resources that are: 13. strong/robust
Robust to withstand external pressure /demands without loss of Function (O’Rouke, 2008).
Strong (UNISDR, 2008; Twigg, 2009; IOTWS, 2007).
Increased size e.g. community contingency fund (Twigg, 2009); local employers (CRPT, 2000).
Geographically distributed so that they are not all affected by a single event (Arup, 2010) e.g. decentralised government (Bahadur, 2010).
Located outside of high risk areas (Twigg, 2009; IOTWS, 2007). 15. diverse
Able to meet its needs in a variety of ways e.g. social (variety of internal organisations), economic (multiple employers and employment opportunities), environmental (different groups in an ecosystem) (Arup, 2010; Bahadur, 2010; Cutter, 2010; Pasteur, 2011; CRPT, 2000; Twigg, 2009; IOTWS, 2007). 16. redundant
Able to offer spare capacity to accommodate extreme pressure so that alternate
options and substitutions are available under stress (O’Rouke, 2008; Arup, 2010;
Bahadur, 2010; Twigg, 2009). 17. equitable
Equal and allow inclusive access and ownership (Cutter, 2010; CRPT, 2000; Twigg, 2009; Bahadur, 2010).
There were also a number of qualities that were associated with human behavior and attitude that emerged:
18. Commitment to reducing risk in the long-term (IFRC, 2008; Twigg, 2009; CRPT, 2000). 19. Self-sufficiency (IFRC, 2008; CRPT, 2000; ADPC, 2006).
The list incorporates many other important papers dealing with community resilience indicators (the specific indicators cannot be shown in this report, but can accessed via the reports). Examples are the first discussion paper of the ‘Strengthening
Climate Resilience’ initiative by DFID (BAHADUR et al. 2010)8 that assembled ten
main characteristics and many other potential indicators of a resilient system (mostly related to disasters and climate change in the developing world), the ‘critical
guidelines of community-based disaster risk management’ by the Asian Disaster
Preparedness Center (ADPC 2006)9 that describes the main characteristics of a resilient community, divided into characteristics before, during and after a disaster event or the ‘Framework for Analysis and Action to Build Community
Resilience’ (PASTEUR 2011)10 that sets out key-factors contributing to individual, household and community resilience.
At this point, we want to highlight also psychological research activities on resilience indicators – without naming specific studies – although they can hardly be allocated to either quantitative or qualitative indicator-based assessment approaches.
Psychological perspectives of community resilience are well addressed in current
8 See: http://opendocs.ids.ac.uk/opendocs/handle/123456789/2368#.VWVxH2M-d0Z
9 See: http://www.preventionweb.net/files/9440_ADPCCriticalGuidelines.pdf
literature and seem to be very advanced in identifying indicators. Deliverable 3.3 (RODRIGUEZ-LLANES et al. 2013) identified in its literature review on indicators of psychological resilience for example fifty-eight resilience indicators. These were then evaluated by pointing out those indicators that were mentioned by a majority of studies and that show the same effect on resilience. According to this evaluation, the most consistent and robust indicators of psychological perspectives of community resilience are gender (female gender was found as a higher risk group of suffering after a disaster) and social support (high levels of social support from relatives and friends increase resilience). Probable indicators are disaster exposure level, previous traumatic experiences, resource loss, human loss and the physical and mental health status of individuals. Potential indicators include substance abuse, being insured, event-related worry, education, income, marital status, age, being religious and ethnicity.
Further, Deliverable 4.1 (KARANCI et al. 2015), focussing on “archetypes of personal attributes and cognition for psycho-social resilience”, uses narratives from emBRACE case studies (mainly German flooding and Turkish earthquakes) to derive and
assess indicators to capture individual experience of risk and vulnerability. It relates this to indicators of household resilience (KARANCI et al. 2015: 16-17) based on the same associated case study data that was fed into the process to produce this report. It concludes that: “mitigation actions seems to be not that sufficient in general to build at least the psychological and physical resilience of households that suffered from repetitive flooding. The usual socio-economic indicators like age, gender, employment and also income do not play that expected important role to build resilience. Existing vulnerability and resilience assessment indicators in flood risk management should be therefore critically scrutinized” (KARANCI et al. 2015: 19). Thus, Del.4.1 “aimed to discover if there were additional indicators of [individual psychological] resilience not covered in existing models and theories” (KARANCI et al. 2015: 26); a process which this deliverable broadens out. However, Del.4.1 produced a list of 12 indicators of psychological resilience which include: individual socio-demography, religiousness, disaster exposure, personality, optimism, social capital (including social support), life satisfaction, domain-specific self-efficacy, damage attributions, coping, posttraumatic stress symptoms, stress-coping ability and suggest assessment tools to measure these. The conclude that “from the
the rider that “regarding individual psychological resilience, belief in God and religion, financial resources, social networks, health, and personality characteristics were the most pronounced indicators of psychological resilience. Moreover, coping also included diverse strategies, social networks and religion appearing prominent among them” (KARANCI et al. 2015: 24-25). Of course all this data has also fed into this deliverable in a systematic manner through the process described in chapter 3. A valuable source of information is also the systematic literature review of
OSTADTAGHIZADEH et al. concerning assessment models and tools for measuring community disaster resilience with focus on public health (OSTADTAGHIZADEH et al. 2015). According to their literature review (17 papers), major elements of community disaster resilience include: religious affiliation, place of residence (place attachment), spirituality, ethnicity, culture, social trust, community education, community
empowerment, practice, social networks, familiarity with local services, physical and economic security, economic development, social capital, information and
communication, and community competence (OSTADTAGHIZADEH et al. 2015: 2). Their study confirmed also the difficulties and limitations of current approaches of measuring community resilience that were identified also in this report, i.e. complexity of operationalisation and the development of measurable frameworks of the concept, lack of accepted definitions of community resilience (and community resilience indicators), lack of concrete assessment tools, etc. They revealed a considerable disparity between papers referring to community resilience and those actually attempting to measure the concept. “This disparity provides a tangible indication of the proliferation in the use of the concept of community resilience, the limited attention paid to its definition and systematic study, and the consequent need to identify a set of predictors that can inform the systematic assessment process” (OSTADTAGHIZADEH et al. 2015: 4). One suggestion of the authors is to use similar terms when addressing community resilience indicators (e.g. domain instead of component or dimension; indicator instead of factor, variable or criteria; index instead of composite indicator), which is an interesting point and is worthy of further
2.4.2 Quantitative indicator-based approaches
The approach pursued by Susan CUTTER and her colleagues from the Hazard & Vulnerability Research Institute of the University of South Carolina is one of the most cited quantitative indicator-based approaches in current literature. They have
published several papers dealing with disaster resilience indicators for communities, as for example the ‘Disaster Resilience of Place (DROP) model in 2008 (CUTTER et al. 2008) that served as the framework for developing ‘Baseline Resilience Indicators for Communities’ and the ‘Disaster Resilience Index’ in 2010 (CUTTER et al. 2010), which was further refined in a paper about ‘Geographies of Community Disaster Resilience’ in 2014 (CUTTER et al. 2014).
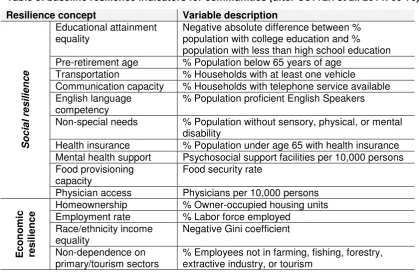
[image:31.595.84.504.410.682.2]CUTTER et al. use empirically-based indicators to measure the disaster resilience of communities in the United States. The paper published in 2014 proposes forty-nine indicators (called ‘variables’), which are aligned to six different domains of community resilience: social resilience, economic resilience, community capital, institutional resilience, housing/infrastructural resilience and environmental resilience11:
Table 5: baseline resilience indicators for communities (after CUTTER et al. 2014: 69-70)
Resilience concept Variable description
S
o
cia
l r
e
sil
ience
Educational attainment
equality Negative absolute difference between % population with college education and % population with less than high school education Pre-retirement age % Population below 65 years of age
Transportation % Households with at least one vehicle
Communication capacity % Households with telephone service available English language
competency
% Population proficient English Speakers
Non-special needs % Population without sensory, physical, or mental disability
Health insurance % Population under age 65 with health insurance Mental health support Psychosocial support facilities per 10,000 persons Food provisioning
capacity Food security rate
Physician access Physicians per 10,000 persons
E
con
o
mic
res
il
ienc
e Homeownership Employment rate % Owner-occupied housing units % Labor force employed
Race/ethnicity income
equality Negative Gini coefficient Non-dependence on
primary/tourism sectors
% Employees not in farming, fishing, forestry, extractive industry, or tourism
Gender income equality Negative absolute difference between male and female median income
Business size Ratio of large to small businesses Large
retail-regional/national geographic distribution
Large retail stores per 10,000 persons
Federal employment % Labor force employed by federal government
Co mm u n it y c apit a l Place attachment-not recent immigrants
% Population not foreign-born persons who came to US within previous five years
Place attachment-native
born residents % Population born in state of current residence Political engagement % Voting age population participating in
presidential election Social capital-religious
organizations Persons affiliated with a religious organization per 10,000 persons Social capital-civic
organizations
Civic organizations per 10,000 persons
Social capital-disaster
volunteerism Red cross volunteers per 10,000 persons Citizen disaster
preparedness and response skills
Red cross training workshop participants per 10,000 persons Inst it u tion al res ilie n ce
Mitigation spending Ten year average per capita spending for mitigation projects
Flood insurance coverage % Housing units covered by National Flood Insurance Program
Jurisdictional coordination Governments and special districts per 10,000 persons
Disaster aid experience Presidential disaster declarations divided by number of loss-causing hazard events from 2000 to 2009
Local disaster training % Population in communities with Citizen Corps program
Performance
regimes-state capital Proximity of county seat to state capital Performance
regimes-nearest metro area Proximity of county seat to nearest county seat within a Metropolitan Statistical Area Population stability Population change over previous five year period Nuclear plant accident
planning
% Population within 10 miles of nuclear power plant
Crop insurance coverage Crop insurance policies per square mile
Ho u sing /inf ras tr u ctu ral r e sil ienc
e Sturdier housing types % Housing units not manufactured homes
Temporary housing
availability % Vacant units that are for rent Medical care capacity Hospital beds per 10,000 persons
Evacuation routes Major road egress points per 10,000 persons Housing stock
construction quality % Housing units built prior to 1970 or after 2000 Temporary shelter
availability Hotels/motels per 10,000 persons School restoration
potential
Public schools per 10,000 persons
Industrial re-supply
potential Rail miles per square mile High speed internet
infrastructure % Population with access to broadband internet service
Supported Agriculture per 10,000 persons Natural flood buffers % Land in wetlands
Efficient energy use Megawatt hours per energy consumer Pervious surfaces Average percent perviousness Efficient Water Use Inverted water supply stress index
The indicators identified by CUTTER et al. cover a broad range of resources and capacities that shape the disaster resilience of communities. These range from social capital (e.g. income and educational equality, presence of civic organisations,
disaster volunteering) and community capital (e.g. place attachment, political
engagement) to institutional (e.g. insurance coverage, disaster aid experiences, local disaster trainings) and infrastructural capacities (e.g. housing types, healthcare facilities, communication and transportation networks). The required data are derived from national census or statistical surveys at the administrative level (national to county level).
These baseline indicators are used to calculate a disaster resilience index including several steps of composite indicator development such as normalisation and
aggregation (see also chapter 4.1): As a first step, CUTTER et al. used the ‘min-max’ normalisation technique to convert all indicator values into the same reference scale. Then, they calculated sub-indices for the six above mentioned domains of resilience (with equal weights for each domain) and in a final step aggregated them to the final disaster resilience index. The index allows mapping of results and comparing
community resilience not only between different US counties, but also between different domains of resilience (sub-indices). Furthermore, the single indicators serve as a reference unit (baseline) for constant measurements of community resilience in the future.
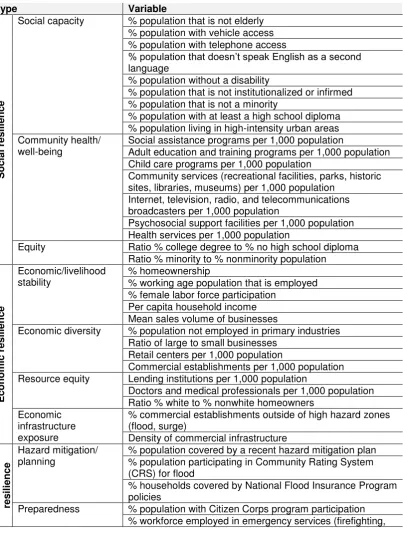
institutional resilience, infrastructure resilience, community capital and environmental systems12:
Table 6: potential indicators for resilience assessment (after BURTON 2015: 6-7)
Type Variable
S
o
cia
l r
e
sil
ience
Social capacity % population that is not elderly % population with vehicle access % population with telephone access
% population that doesn’t speak English as a second
language
% population without a disability
% population that is not institutionalized or infirmed % population that is not a minority
% population with at least a high school diploma % population living in high-intensity urban areas Community health/
well-being Social assistance programs per 1,000 population Adult education and training programs per 1,000 population Child care programs per 1,000 population
Community services (recreational facilities, parks, historic sites, libraries, museums) per 1,000 population
Internet, television, radio, and telecommunications broadcasters per 1,000 population
Psychosocial support facilities per 1,000 population Health services per 1,000 population
Equity Ratio % college degree to % no high school diploma Ratio % minority to % nonminority population
E
con
o
mic
re
sil
ien
ce
Economic/livelihood
stability % homeownership % working age population that is employed % female labor force participation
Per capita household income Mean sales volume of businesses
Economic diversity % population not employed in primary industries Ratio of large to small businesses
Retail centers per 1,000 population
Commercial establishments per 1,000 population Resource equity Lending institutions per 1,000 population
Doctors and medical professionals per 1,000 population Ratio % white to % nonwhite homeowners
Economic infrastructure exposure
% commercial establishments outside of high hazard zones (flood, surge)
Density of commercial infrastructure
Inst
it
u
tion
al
res
il
ienc
e
Hazard mitigation/ planning
% population covered by a recent hazard mitigation plan % population participating in Community Rating System (CRS) for flood
% households covered by National Flood Insurance Program policies
Preparedness % population with Citizen Corps program participation % workforce employed in emergency services (firefighting,
law enforcement, protection)
Number of paid disaster declarations
Development % land cover change to urban areas from 1990 to 2000
Inf
ras
tr
u
ctu
re r
es
il
ienc
e
Housing type % housing that is not a mobile home % housing not built before 1970; after 1994 Response and
recovery % housing that is vacant rental units Hotels and motels per square mile
Fire, police, emergency relief services, and temporary shelters per 1,000 population
% fire, police, emergency relief services, and temporary shelters outside of hazard zones
Schools (primary and secondary education) per square mile Access and
evacuation Principal arterial miles Number of rail miles Infrastructure
exposure Density of single-family detached homes % building infrastructure not in flood and storm surge inundation zones
% building infrastructure not in high hazard erosion zones
Co
mm
u
n
it
y c
apit
a
l
Social capital Religious organizations per 1,000 population Social advocacy organizations per 1,000 population Arts, entertainment, and recreation centers per 1,000 population
Civic organizations per 1,000 population
Creative class % workforce employed in professional occupations Professional, scientific, and technical services per 1,000 population
Research and development firms per 1,000 population Business and professional organizations per 1,000 population
Cultural resources National Historic Registry sites per square mile
Sense of place % population born in a state and still residing in that state % population that is not an international migrant
E
n
vir
o
n
m
ent
al
s
ys
tem
s r
es
ili
ence
Risk and exposure % land area that does not contain erodible soils
% land area not in an inundation zone (100/500-year flood and storm surge combined)
% land area not in high landslide incidence zones Number of river miles
Sustainability % land area that is nondeveloped forest % land area with no wetland decline
% land area with no land-cover/land-use change, 1992–
2001
% land area under protected status % land area that is arable cultivated land
Protective resources % land area that consists of windbreaks and environmental plantings
% land area that is a wetland, swamp, marsh, mangrove, sand dune, or natural barrier
% land area that is developed open space Hazard event
frequency Frequency of loss-causing weather events (hail, wind, tornado, hurricane)