Quantifying global dust devil occurrence
from meteorological analyses
Bradley C. Jemmett-Smith1, John H. Marsham1,2, Peter Knippertz3, and Carl A. Gilkeson4
1
Institute for Climate and Atmospheric Science, School of Earth and Environment, University of Leeds, Leeds, UK,
2National Centre for Atmospheric Science, Leeds, UK,3Institute for Meteorology and Climate Research, Karlsruhe Institute
of Technology, Karlsruhe, Germany,4Institute of Thermofluids, School of Mechanical Engineering, University of Leeds, Leeds, UK
Abstract
Dust devils and nonrotating dusty plumes are effective uplift mechanisms forfine particles, but their contribution to the global dust budget is uncertain. By applying known bulk thermodynamic criteria to European Centre for Medium-Range Weather Forecasts (ECMWF) operational analyses, we provide thefirst global hourly climatology of potential dust devil and dusty plume (PDDP) occurrence. In agreement with observations, activity is highest from late morning into the afternoon. Combining PDDP frequencies with dust source maps and typical emission values gives the best estimate of global contributions of 3.4% (uncertainty 0.9–31%), 1 order of magnitude lower than the only estimate previously published. Total global hours of dust uplift by dry convection are ~0.002% of the dust-lifting winds resolved by ECMWF, consistent with dry convection making a small contribution to global uplift. Reducing uncertainty requires better knowledge of factors controlling PDDP occurrence, source regions, and dustfluxes induced by dry convection.1. Introduction
Mineral dust is a key constituent in the Earth’s system [Knippertz and Stuut, 2014] with implications for the global energy, carbon, and water cycles [Shao et al., 2011]. TheIntergovernmental Panel on Climate Change (IPCC) [2013, chapter 7] suggests that airborne dust forms the largest component of the global aerosol budget, contributing roughly one third of the total natural aerosol mass annually. Total global emission of natural mineral dust is estimated to be between around 1000 and 4000 Tg yr1[Huneeus et al., 2011]; anthropogenic contributions are largely unknown [IPCC, 2013, chapter 7].
Dust emission can be caused by a wide range of small-scale meteorological features that are unresolved by weather and climate models and whose relative importance is unclear [Marsham et al., 2009;Knippertz and Todd, 2012]. Dry boundary layer convection can enhance near-surface winds [Marsham et al., 2008] and serves as an effective mechanism for dust uplift in its own right: typically, through dry convective vortices and nonrotating larger, longer-lived convective plumes that are made visible when dust and sand are uplifted from the surface and drawn into their core (dust devils and dusty plumes) [Sinclair, 1969]. These
meteorological phenomena occur over length scales of several hundred meters or less and are hard to model [Raasch and Franke, 2011] and observe [Balme and Greeley, 2006] in sufficient detail.
The ideal characteristics for dust devil breeding grounds are (1) intense surface heating through insolation and a strong near-surface superadiabatic temperature lapse rate; (2) smooth arid terrain with some rock cover but few trees, buildings, or grassy areas; and (3) relatively level to gently sloping topography [Balme and Greeley, 2006;Kurgansky et al., 2011]. Dust devils are typically observed between 10:00 and 17:30 local time (LT) [Balme and Greeley, 2006], during clear to fair weather conditions [Sinclair, 1969] and under relatively weak ambient winds [Oke et al., 2007]. Several observational studies show that dust devil and dusty plume (DDP) occurrence significantly depends on the local meteorology, defined using thresholds of near-surface temperature lapse rate [Ryan, 1972;Oke et al., 2007;Ansmann et al., 2009] and boundary layer scaling parameters [Deardorff, 1978;Hess and Spillane, 1990;Lyons et al., 2008;Kurgansky et al., 2011].
Lyons et al.[2008] suggest two key factors that govern the formation and development of dry convective vortices: the availability of convective buoyancy and the frictional dissipation, quantified usingw*andu*,
Geophysical Research Letters
RESEARCH LETTER
10.1002/2015GL063078Key Points:
•Global potential dust devil occurrence quantified from meteorological analyses
•Climatology shows realistic diurnal cycle and geographical distribution
•Best estimate of global contribution of 3.4% is 10 times smaller than the previous estimate
Supporting Information: •Supporting Information S1
Correspondence to: B. C. Jemmett-Smith,
Citation:
Jemmett-Smith, B. C., J. H. Marsham, P. Knippertz, and C. A. Gilkeson (2015), Quantifying global dust devil occurrence from meteorological analyses,Geophys. Res. Lett.,42, doi:10.1002/2015GL063078.
Received 8 JAN 2015 Accepted 28 JAN 2015
Accepted article online 2 FEB 2015
respectively. The significance ofw*as a scaling parameter for convective boundary layers wasfirst defined by Deardorff[1970] as
w¼ Tgh ωT0
1
3
(1)
whereg=Tis the buoyancy parameter for an ideal gas,his the boundary layer height (of the convective region), and ωT0is the kinematic heatflux near the surface.Lyons et al.[2008]find that dust devil occurrence is favored during hours whenw*/u*>5.0 but emphasize that this critical value implies a general case for the occurrence of dust devils over a mesoscale domain. In addition, thew*/u*>5.0 criterion satisfies the ambient wind condition proposed byOke et al.[2007], with ambient winds not exceeding 7 m s1whenw*/u*>5.0. Deardorff[1978] andHess and Spillane[1990] useh/L, whereLis the Obukhov length scale (a measure of height above ground, where the mechanical and buoyant productions of turbulence approximately equal). They suggest threshold values ofh/L≥100 andh/L≥50, respectively, as necessary conditions for dust devil activity. Similarly,Kurgansky et al.[2011] propose threshold values ofL≅20 to 30 m. The results ofDeardorff [1978],Hess and Spillane[1990],Lyons et al.[2008], andKurgansky et al.[2011] can be compared using the equivalentw*/u*criteria yielding threshold limits of 5.0 to 6.3.
Ryan[1972] andOke et al.[2007] suggest that an unstable near-surface lapse rate is a necessary condition that controls dust devil formation. This is consistent withAnsmann et al.[2009], who only observe DDPs when strong surface heating by solar irradiation leads to sufficiently large temperature lapse rates of 8.5 to 10 K m1between the surface and 2 m air temperature. The combinedw*/u*and lapse rate criteria provide the basis for all known measures of local meteorology that define when and where strong dry convective winds capable of dust uplift occur (termed“potential dust devil and dusty plume”(PDDP) occurrence). The contribution of DDPs to the global dust budget is largely unknown.Koch and Renno[2005] (hereafter KR05) estimate that DDPs contribute 34 ± 19% to the global budget of mineral dust (dust devils 26 ± 18% and dusty plumes 8 ± 6%). With the exception of sea spray, these estimates suggest that the mass contribution of mineral dust uplift through dry convection (DDPs) is potentially greater than all other natural aerosol sources [IPCC, 2013, chapter 7 and Figure 7.1]. Despite this, DDPs and dry convection are not mentioned in the recentIPCC[2013] Fifth Assessment Report and are not included in global models. To the authors’best knowledge, KR05 remains the only published quantification of global dust uplift by dry convection, and global DDP occurrence has not yet been quantified. KR05’s estimate is based on assumptions concerning (1) dustflux per DDP, (2) the fractional updraft area occupied by DDPs in a convectively active region, (3) that DDPs occur 8 h/d, 72 d/yr, and (4) across 40% of all global arid and semiarid regions.
This paper builds on the work of KR05 to produce a new climatology of global dust uplift from DDPs (i.e., dry convective winds), mainly by improving the accuracy of assumptions (3) and (4) above. This is achieved by (a) applying thermodynamic criteria to new high-resolution global meteorological analyses generating hourly gridded estimates of PDDP occurrence, (b) using a dust source map to identify suitable locations for DDP occurrence, and (c) applying KR05’s estimate of individual DDP dustflux and fractional updraft areas to results from (a) and (b) to generate new estimates of global dustflux contributions by DDPs. Section 2 describes the methods, section 3 describes the results, and conclusions are given in section 4.
2. Data and Method
capture strong winds associated with convective cold pools [Knippertz et al., 2009;Marsham et al., 2011; Heinold et al., 2013], but only a small fraction of the domain is directly affected by such winds (on the order of 1.5% over summertime West Africa; F. Pantillon, personal communication, December 2014).
To estimate the values ofw*/u*and near-surface temperature lapse rates from ECMWF data, grid point values of temperature, wind, boundary layer heighth, surface sensible heatfluxQH, andu*were used. Calculations ofw*are achieved using methods consistent withDeardorff[1970] and 925 hPa potential temperature to approximate a boundary layer mean value. Near-surface lapse rate is determined by taking the difference between the air temperature at 2 m and the skin temperature as inAnsmann et al.[2009]. Afiner vertical resolution, as given in the observational studies byRyan[1972] andOke et al.[2007], is not possible using ECMWF data.
When only applying thew*/u*>5.0 criterion suggested byLyons et al.[2008] to ECMWF data, the number of PDDP hours per year (referred to as PDDPhoursin the future) exceeds 250 across the majority of the world’s landmasses with peaks in the tropics, where values often equal or exceed the total number of daytime hours per year (Figure S1 in the supporting information). Activity decreases with increasing latitude, and maxima often occur in mountain regions. Results suggest thatw*/u*>5.0 is a necessary rather than sufficient condition that is therefore unable to constrain global DDP activity. The main reason for this is that the criterion can be met during situations with weak convection (loww*) and low values ofu*, conditions unlikely to produce DDPs.Kurgansky et al.[2011] suggest that dust devil activity peaks whenw*≈2.8 m s1but give no lower threshold that can be used.
In order to restrict results to times and areas with hot surfaces and daytime dry convection, in section 3.1, we test different lapse rate criteria based on thefindings byRyan[1972],Oke et al.[2007], andAnsmann et al. [2009]. As levels other than 2 m are used in some of these studies, we estimated the surface to 2 m lapse rate by linear extrapolation. Threshold values of 8.5 K m1and 10 K m1are fromAnsmann et al.[2009], taken at the same heights used in our analyses and are representative of results byRyan[1972] (Figure S2 in the supporting information). A lower 4 K m1threshold value is tested, based on results fromOke et al.[2007] and Ryan[1972] (Figure S2 in the supporting information).
To account for nondust source regions and terrain not favored for DDP occurrence, we apply a global mask defined byGinoux et al.[2001] (Dmask), which quantifies dust source locations in topographical lows with bare soil surface as a fractional area of 0.25° × 0.25° grid boxes. These regions are expected to serve as a source of loose particles (typically alluvial deposits) that can easily be uplifted into the atmosphere and are characteristic of locations where DDPs are typically observed [Sinclair, 1969;Balme and Greeley, 2006;Oke et al., 2007].
To quantify total dust uplift by dry convection, we use the DDP fractional updraft areas (σ) and dustfluxes (Fd) estimated by KR05 (based onfield measurements and theory): dusty plumes and dust devils have an average dustflux of 0.1 g m2s1and 0.7 g m2s1and cover a fractional area of 5 × 10⁵and 3 × 10⁵, respectively, within an active region. The total mineral dust uplift (Ftot) from dry convection (DDPs) is subsequently quantified usingFtot= PDDPhours×Dmask×σ×Fd. The emphasis here is to quantify the meteorological constraints on the contribution of DDPs to the global dust budget. Variations in source areas, fractional updraft area, and dustflux remain as sources of uncertainty, but are discussed later in the paper. This approach provides a detailed highly resolved climatology (geographical, seasonal, and diurnal variations) and allows for a direct comparison to the global mineral dust calculations given by KR05.
3. Results
3.1. Meteorological Threshold Selection
significant (Figure 1b). The stronger lapse rates reduce peaks by more than 1 order of magnitude and further reduce contributions before 10:00 LT to give a better agreement with observations [Balme and Greeley, 2006]. The peak activity at ~12:30 LT is slightly earlier than some observational studies: this is likely due to the quick response of lapse rate to solar irradiance, therefore, underlines the lack of knowledge and dependence of DDPs onw*or any minimumw*threshold. The 8.5 K m1lapse rate criterion gives ~7 h of activity consistent with observations [Balme and Greeley, 2006] using 10 K m1results in less activity. Increasing the w*/u*threshold to 6.3 has little effect on results when using 8.5 and 10 K m1lapse rates (Figure 1b). Based on this, we consider the criteriaw*/u*>5.0 and lapse rate>8.5 K m1to be most appropriate for use in determining the meteorological potential of DDP occurrence and apply these to give our“best estimate” results throughout the rest of the paper.
3.2. Climatology of Occurrence Frequency
Figure 2 shows the global distribution of PDDPhoursand its variation by season. Potential activity is found in all arid areas in both hemispheres with peaks up to 2500 h yr1(corresponding to ~7 h on average per day). As expected, there is a marked seasonal cycle with a clear peak in each hemisphere’s summer, when insolation is highest. Activity is seen through the transition seasons, but only the most active regions along the Red Sea coast of the Arabian Peninsula and in the Atacama and Sechura Deserts of South America show significant activity throughout the year (Figures 2b–2e). The total area of PDDP activity in Figure 2a is ~3.7 × 10⁷km2with a mean active period of ~205 h yr1. This is approximately 3 times larger than the active DDP dust source region and one third of the hours per year used by KR05 (1.3 × 10⁷km2and 576 h yr1, respectively). In addition, PDDP activity is not always limited to spring and summer months in contrast to assumptions made in KR05.
3.3. Estimates of Dust Uplift
Applying the dust source mask byGinoux et al.[2001] (Figure 3a) and mean emission efficiency as detailed in section 2 allows for generation of horizontal distributions of total dust uplift estimates by DDPs in key dust source regions (Figures 3b–3f ). There are vast regions that contribute less than 4 t km2yr1; most notably, these include the desert regions of the Sahara, Arabia, and Australia. There are many regions where dust uplift by DDPs exceeds 20 t km2yr1, including the coastal regions of the Red Sea, the eastern part of the Rub’al Khali region of the Arabian Desert, the coastal region in southeast Iran/southwest Pakistan (Figure 3b), the Namib Desert in South Africa (Figure 3c), and the Sechura Desert in South America (Figure 3e). Notable hot spots where values exceed 60 t km2yr1are seen within the Sechura Desert (~14°S, ~76°W) and in the northeast Afar Region of Ethiopia (~13°N, ~41°E). Using the lower 4 K m1lapse rate increases the signal and spatial extent of activity, while the higher 10 K m1criterion gives spatially similar results but a reduced signal from active regions (Figure S3 in the supporting information).
[image:4.612.202.546.90.234.2]less than KR05’s best estimate (34 ± 19%). Varying thermodynamic thresholds as in Figure 1 gives a range from 192 × 105to 6710 × 105t (0.9–31% total contribution and dust devils 0.8–25%). However, recall that a lapse rate criterion≤4 K m1gives unrealistic results in terms of the diurnal cycle of DDP occurrence (Figure 1a).
Averaged over the same dust source area, the mean ratio of our best estimate DDP hours (PDDPhours×σ) to hours when ECMWF 10 m winds exceed 7 m s1(a typical emission threshold [Chomette et al., 1999]) is 2.3 × 10⁵or 0.002% (8 m s1gives 5.7 × 10⁵). An advantage of this approach is that this“DDP fraction”ratio is independent from global and DDP dustflux values. This small value supports the hypothesis that DDPs play a small role within the global mineral dust cycle. For this ratio to be consistent with the ~3.4% estimate of global DDPflux, the dustflux per DDP needs to be 700 to 1400 times the dustflux per area caused by resolved winds. This is large, but may be conceivable, given the (i) uncertainty in this value from the uncertainty inσ discussed below and (ii) that dust devil cores have updrafts collocated with intense emission and thus provide good conditions to lift large particles, which affect massfluxes considerably [Rosenberg et al., 2014].
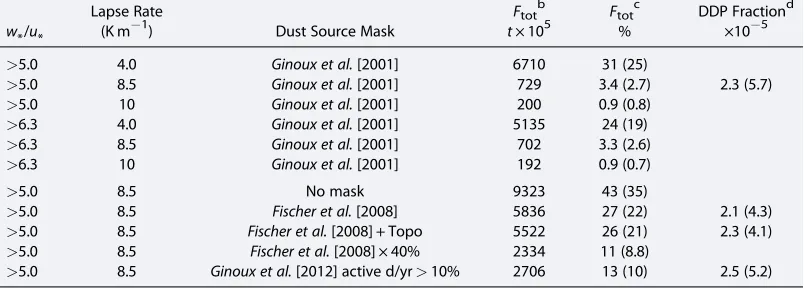
[image:5.612.179.573.91.429.2]3.3.1. Uncertainty From Source Mask (Dmask) and DDP Fractional Areas and Fluxes (σandFd) There exists considerable uncertainty about the land-surface characteristics that determine dust source regions globally, as well as the fractional area covered by DDPs and their dustfluxes. Table 1 shows the effects onFtot applying different source masks (Figure S4 in the supporting information). Estimates ofFtotare only comparable to KR05 when“no mask”or“barren/sparsely vegetated land”[Fischer et al., 2008] are applied (Ftot= 43 or 27%), but these masks will likely overestimate source areas. Removing mountainous regions (barren/sparsely vegetated land + Topo) has little impact on results (26%). Using a KR05 equivalent mask (barren/sparsely vegetated land × 40% = 1.0 × 10⁷km2) yields 11%.Ginoux et al.[2012] identify seasonal dust sources with different origins: for dust source active>10% yr1,Ftot= 13%, a factor of 4 greater than obtained withGinoux et al.’s [2001] mask.
Figure 2.Climatology of PDDPhours(mean of 2012 and 2013) usingw*/u*>5.0 [Lyons et al., 2008] and 8.5 K m 1
VaryingσandFd,fixed in time, simply scales the values ofFtotin Table 1 linearly. To the authors’best knowledge, KR05 give the only known published quantitative estimate of the uncertainty inσfor both DDPs (σ= 8 × 10⁵± 6 × 10⁵), which is based on theory [Renno and Ingersoll, 1996] andfield data [Sinclair, 1966, 1969; Snow and McClleland, 1990;Metzger, 1999];field data giveσ≅2 × 10⁵± 9 × 10⁶for dust devils [KR05] and no value for plumes. Furthermore,σcan vary within seasonal, daily, and episodic cycles of DDP activity and across terrain types [Sinclair, 1969;Oke et al., 2007]. The range in sigma from KR05 can therefore reduce estimated contribution from DDPs by a factor of 4 or increase it by a factor of 2. Recentfield experiments byMetzger et al. [2011] give typical mean dust devilfluxes between 0.9 and 7.5 mg m2s1(at 0.5 m and 4.5 m, respectively), which are consistent with laboratory experiments [Neakrase and Greeley, 2010]. These are ~100 times less than the value used by KR05 (700 mg m2s1± 300) and in investigations here. If applied, they reduce our estimates of DDP global mineral dust contributions considerably, withFtot<1% for all scenarios in Table 1.
[image:6.612.191.559.91.486.2]The ratio of DDP hours to hours when ECMWF 10 m winds exceed a threshold of 7 or 8 m s1(“DDP ratio”) gives similar results irrespective of the mask, another advantage of this approach (Table 1). Using a DDP fraction of 2.4 × 10⁵and assuming that DDPs contribute>30% of mineral dust emission on Earth suggest that DDPs are >12,500 times more efficient at dust uplift than resolved winds (8 m s1gives>700), which seems unrealistic, but this fraction depends linearly onσ, and DDPs are efficient uplift mechanisms as discussed.
4. Conclusions
In this paper we have formulated a new method that provides thefirst estimates of hourly global potential DDP occurrence and location. By applying thew*/u*>5.0 criterion fromLyons et al.[2008] and the 0 to 2 m temperature lapse rate criterion of 8.5 K m1fromAnsmann et al.[2009] to bulk meteorological quantities from hourly global ECMWF analyses, we achieve results that have a diurnal variation of DDP occurrences similar to that observed. Results show geographical, diurnal, seasonal, and annual variations in the conditions required for DDP formation and confirm that arid regions have by far the highest frequency of occurrence with maxima in summer. The most active regions, with modest levels of activity throughout the year, are the Atacama and Sechura Deserts of South America and the land areas surrounding the Red Sea.
Combining our measure of when and where DDPs occur with KR05’s fractional areas and dustfluxes, we provide a best estimate of global DDP dustflux of 729 × 105t (3.4% of global dust emission and range of 0.9–31%), which is 1 order of magnitude less than the estimates by KR05. This difference from KR05 results from (1) the dust sources fromGinoux et al.[2001] having an area of 5.1 × 10⁶km2, ~2.5 times smaller than KR05’s value of 1.3 × 10⁷± 2 × 10⁶km2and (2) mean annual hours of PDDP activity over source regions around 2.5 times lower than that used by KR05, but over strong sources (area fraction>0.5; Figure 3a), these are more than 5 times lower. The lower hours over strong sources may be a consequence of their typical location in windy regions (e.g., Bodélé Depression and east coast of Arabia), with strong winds inhibiting DDPs. Although results suggest smaller contributions than KR05 globally, they also suggest that DDPs can be significant contributors over particular regions, such as in the Sechura Desert. The ratio of DDPs hours to hours when ECMWF 10 m winds exceed a typical uplift threshold (the DDP fraction) is around 2 × 10⁵, supporting the hypothesis that DDPs play a minor role in the global dust budget.
We quantify uncertainty from the source mask used, with choice between two realistic masks affecting values ofFtotby a factor of ~4, but hardly affecting the DDP fraction. Identifying global dust sources is an active area of research [Knippertz and Stuut, 2014, chapter 7], where large uncertainties remain despite recent advances using satellite observations [Schepanski et al., 2009;Ginoux et al., 2012]. Better identification of dust sources will aid future estimates of DDP contributions, especially with regards to arid/semiarid areas that are sensitive to vegetation change [Cowie et al., 2013], where reduced vegetation may increase dust devil potential [Lyons et al., 2008]. Generally, higher spatial resolutions are required, and terrain not favored for DDP occurrences needs to be accounted for.
[image:7.612.174.576.105.249.2]To reduce uncertainty in future estimates of dust uplift from dry convective sources, more research into meteorological and surface conditions controlling DDPs is required as well as into the size and intensity of the resulting DDPs. This is most likely to be achieved through the use of high-resolution large-eddy model simulations [Balme and Greeley, 2006] and will allow the development of DDP parameterizations for use in weather and climate models [seeKlose and Shao, 2011].
Table 1. Global Dust Uplift by DDPs for Differentw*/u*, Near-Surface Lapse Rate Criteria, and Source Masksa
w*/u*
Lapse Rate
Dust Source Mask
Ftotb Ftotc DDP Fractiond
(K m1) t× 105 % ×105
>5.0 4.0 Ginoux et al.[2001] 6710 31 (25)
>5.0 8.5 Ginoux et al.[2001] 729 3.4 (2.7) 2.3 (5.7)
>5.0 10 Ginoux et al.[2001] 200 0.9 (0.8)
>6.3 4.0 Ginoux et al.[2001] 5135 24 (19)
>6.3 8.5 Ginoux et al.[2001] 702 3.3 (2.6)
>6.3 10 Ginoux et al.[2001] 192 0.9 (0.7)
>5.0 8.5 No mask 9323 43 (35)
>5.0 8.5 Fischer et al.[2008] 5836 27 (22) 2.1 (4.3)
>5.0 8.5 Fischer et al.[2008] + Topo 5522 26 (21) 2.3 (4.1)
>5.0 8.5 Fischer et al.[2008] × 40% 2334 11 (8.8)
>5.0 8.5 Ginoux et al.[2012] active d/yr>10% 2706 13 (10) 2.5 (5.2) a
DDP fraction is the ratio of DDP hours (PDDPhours×σ) to hours when resolved ECMWF 10 m winds exceed 7 m s1. bTotal dust uplift by DDPs.
c
Dust uplift by DDPs as a percentage of global emissions based onIPCC[2001] estimate of 2.15 × 10⁹t; dust uplift by dust devils only are in parentheses.
d
References
Ansmann, A., M. Tesche, P. Knippertz, E. Bierwirth, D. Althausen, D. Müller, and O. Schulz (2009), Vertical profiling of convective dust plumes in southern Morocco during SAMUM,Tellus, Ser. B,61, 340–353.
Balme, M., and R. Greeley (2006), Dust devils on Earth and Mars,Rev. Geophys.,44, RG3003, doi:10.1029/2005RG000188.
Bauer, P., et al. (2013),Model Cycle 38r2: Components and Performance,Tech. Memo. 704, 58 pp., European Centre for Medium-Range Weather Forecasts (ECMWF), Reading, U. K.
Chomette, O., M. Legrand, and B. Marticorena (1999), Determination of the wind speed threshold for the emission of desert dust using satellite remote sensing in the thermal infrared,J. Geophys. Res.,104, 31,207–31,215, doi:10.1029/1999JD900756.
Cowie, S. M., P. Knippertz, and J. H. Marsham (2013), Are vegetation-related roughness changes the cause of the recent decrease in dust emission from the Sahel?,Geophys. Res. Lett.,40, 1868–1872, doi:10.1002/grl.50273.
Deardorff, J. W. (1970), Convective velocity and temperature scales for the unstable planetary boundary layer and for Rayleigh convection, J. Atmos. Sci.,27, 1211–1213.
Deardorff, J. W. (1978), Observed characteristics of the outer layer, inShort Course on the Planetary Boundary Layer, edited by A. K. Blackadar, 101 pp., Am. Meteorol. Soc., Boston, Mass.
Fischer, G., F. Nachtergaele, S. Prieler, H. T. van Velthuizen, L. Verelst, and D. Wiberg (2008),Global Agro-Ecological Zones Assessment for Agriculture (GAEZ 2008), IIASA, Laxenburg, Austria and FAO, Rome.
Ginoux, P., M. Chin, I. Tegen, M. Prospero, B. Holben, O. Dubovic, and S. J. Lin (2001), Sources and distributions of dust aerosols simulated with the GOCART model,J. Geophys. Res.,106, 20,255–20,273, doi:10.1029/2000JD000053.
Ginoux, P., J. M. Prospero, T. E. Gill, N. C. Hsu, and M. Zhao (2012), Global-scale attribution of anthropogenic and natural dust sources and their emission rates based on MODIS deep blue aerosol products,Rev. Geophys.,50, RG3005, doi:10.1029/2012RG000388.
Heinold, B., P. Knippertz, J. H. Marsham, S. Fiedler, N. Dixon, K. Schepanski, B. Laurent, and I. Tegen (2013), The role of deep convection and low-level jets for dust emissions in West Africa,J. Geophys. Res. Atmos.,118, 4385–4400, doi:10.1002/jgrd.50402.
Hess, G. D., and K. T. Spillane (1990), Characteristics of dust devils in Australia,J. Appl. Meteorol.,29, 498–507.
Huneeus, N., et al. (2011), Global dust model intercomparison in AeroCom phase I,Atmos. Chem. Phys.,11(15), 7781–7816.
Intergovernmental Panel on Climate Change (IPCC) (2001),Climate Change 2001: The Scientific Basis: Contribution of Working Group I to the Third Assessment Report of the Intergovernmental Panel on Climate Change, edited by J. T. Houghton et al., Cambridge Univ. Press, New York. Intergovernmental Panel on Climate Change (IPCC) (2013),Climate Change 2013: The Physical Science Basis. Contribution of Working Group I to
the Fifth Assessment Report of the Intergovernmental Panel on Climate Change, edited by T. F. Stocker et al., Cambridge Univ. Press, U. K., and New York.
Klose, M., and Y. Shao (2011), Stochastic parameterization of dust emission and application to convective atmospheric conditions,Atmos. Chem. Phys.,12, 7309–7320.
Knippertz, P., and J.-B. Stuut (Eds.) (2014),Mineral Dust: A Key Player in the Earth System, 509 pp., Springer Science, Dordrecht, Netherlands. Knippertz, P., and M. Todd (2012), Mineral dust aerosols over the Sahara: Meteorological controls on emission and transport and implications
for modeling,Rev. Geophys.,50, RG1007, doi:10.1029/2011RG000362.
Knippertz, P., et al. (2009), Dust mobilization and transport in the northern Sahara during SAMUM 2006: A meteorological overview,Tellus, Ser. B,61, 12–31.
Koch, J., and N. O. Renno (2005), The role of convective plumes and vortices on the global aerosol budget,Geophys. Res. Lett.,32, L18806, doi:10.1029/2005GL023420.
Kurgansky, M. V., A. Montecinos, V. Villagran, and S. M. Metzger (2011), Micrometeorological conditions for dust-devil occurrence in the Atacama Desert,Boundary Layer Meteorol.,138, 285–298.
Lyons, T. J., U. S. Nair, and I. J. Foster (2008), Clearing enhances dust devil formation,J. Arid Environ.,72, 1918–1928.
Marsham, J. H., D. J. Parker, C. M. Grams, B. T. Johnson, W. M. F. Grey, and A. N. Ross (2008), Observations of mesoscale and boundary layer scale circulations affecting dust transport and uplift over the Sahara,Atmos. Chem. Phys.,8, 6979–6993.
Marsham, J. H., C. M. Grams, and B. Mühr (2009), Photographs of dust uplift from small-scale atmospheric features,Weather,64, 180–181. Marsham, J. H., P. Knippertz, N. S. Dixon, and D. J. Parker (2011), The importance of the representation of deep convection for modeled
dust-generating winds over West Africa during summer,Geophys. Res. Lett.,38, L16803, doi:10.1029/2011GL048368.
Metzger, S. M. (1999), Dust devils as aeolian transport mechanisms in southern Nevada and the Mars Pathfinder landing site, PhD dissertation, Univ. of Nev., Reno.
Metzger, S. M., M. R. Balme, M. C. Towner, B. J. Bos, T. J. Ringrose, and M. R. Patel (2011), In situ measurements of particle load and transport in dust devils,Icarus,214, 766–772, doi:10.1016/j.icarus.2011.03.013.
Neakrase, L. D., and R. Greeley (2010), Dust devil sedimentflux on Earth and Mars: Laboratory simulations,Icarus,206(1), 306–318. Oke, A. M. C., N. J. Tapper, and D. Dunkerley (2007), Willy willies in the Australian landscape: The role of key meteorological variables and
surface conditions in defining frequency and spatial characteristics,J. Arid Environ.,71, 201–215.
Raasch, S., and T. Franke (2011), Structure and formation of dust devil-like vortices in the atmospheric boundary layer: A high-resolution numerical study,J. Geophys. Res.,116, D16120, doi:10.1029/2011JD016010.
Renno, N. O., and A. P. Ingersoll (1996), Natural convection as a heat engine: A theory for CAPE,J. Atmos. Sci.,53, 572–585. Rosenberg, P. D., et al. (2014), Quantifying particle size and turbulent scale dependence of dustflux in the Sahara using aircraft
measurements,J. Geophys. Res. Atmos.,119, 7577–7598, doi:10.1002/2013JD021255.
Ryan, J. A. (1972), Relation of dust devil frequency and diameter to atmospheric temperature,Geophys. Res. Lett.,77, 7133–7137, doi:10.1029/ JC077i036p07133.
Schepanski, K., I. Tegen, M. C. Todd, B. Heinold, G. Bönisch, B. Laurent, and A. Macke (2009), Meteorological processes forcing Saharan dust emission inferred from MSG-SEVIRI observations of subdaily dust source activation and numerical models,J. Geophys. Res.,114, D10201, doi:10.1029/2008JD010325.
Shao, Y., K.-H. Wyrwoll, A. Chappell, J. Huang, Z. Lin, G. H. McTainsh, M. Mikami, T. Y. Tanaka, X. Wang, and S. Yoon (2011), Dust cycle: An emerging core theme in Earth system science,Aeolian Res.,2, 181–204.
Sinclair, P. C. (1966), A quantitative analysis of the dust devil, PhD thesis, Univ. of Ariz., Tucson. Sinclair, P. C. (1969), General characteristics of dust devils,J. Appl. Sci.,30, 1599–1619.
Snow, J. T., and T. M. McClleland (1990), Dust devils at White Sands Missile Range, New Mexico: 1. Temporal and spatial distributions, J. Geophys. Res.,95, 13,707–13,721, doi:10.1029/JD095iD09p13707.
Acknowledgments
The authors would like to acknowledge funding from the European Research Council grant 257543“Desert Storms.”
We would like to thank the ECMWF for providing the forecast, analysis, and terrain data. We would like to thank Paul Ginoux for providing the dust source data relevant toGinoux et al.[2012]. Ginoux et al.’s [2001] dust source fraction data were provided by NOAA/GFDL, APCD, USA (http://www. gfdl.noaa.gov/atmospheric-physics-and-chemistry_data). Barren/sparsely vegetated land data [Fischer et al., 2008] were provided by the Harmonized World Soil Database IIASA, Laxenburg, Austria (http://webarchive.iiasa.ac.at/ Research/LUC/External-World-soil-database). We would also like to thank both reviewers for their helpful comments and suggestions, which led to improvements of this paper.

![Figure 2. Climatology of PDDPhours (mean of 2012 and 2013) using w*/u* > 5.0 [Lyons et al., 2008] and 8.5 K m�1 near-surfacelapse rate [Ansmann et al., 2009] criteria for (a) annual total and (b–e) seasonal totals.](https://thumb-us.123doks.com/thumbv2/123dok_us/7888322.185568/5.612.179.573.91.429/figure-climatology-pddphours-lyons-surfacelapse-ansmann-criteria-seasonal.webp)
![Figure 3. (a) Dust source fraction from Ginoux et al. [2001]. Dust uplift from DDPs using w*/u* > 5.0 [Lyons et al., 2008] and8.5 K m�1 near-surface lapse rate [Ansmann et al., 2009] criteria for regions (b) Northern Hemisphere dust belt, (c) Namiband Kalahari Deserts of southern Africa, (d) North America, (e) Atacama and Sechura Deserts of South America, and (f) Australia.](https://thumb-us.123doks.com/thumbv2/123dok_us/7888322.185568/6.612.191.559.91.486/northern-hemisphere-namiband-kalahari-deserts-southern-sechura-australia.webp)