promoting access to White Rose research papers
White Rose Research Online eprints@whiterose.ac.uk
Universities of Leeds, Sheffield and York
http://eprints.whiterose.ac.uk/
This is an author produced version of a paper published in Journal of Cleaner
Production (In press).
White Rose Research Online URL for this paper:
http://eprints.whiterose.ac.uk/77500/
Paper:
Figge, F, Young, CW and Barkemeyer, R (2014) Sufficiency or efficiency to
achieve lower resource consumption and emissions? The role of the rebound effect. Journal of Cleaner Production (in press).
Sufficiency or efficiency to achieve lower resource consumption
and emissions? The role of the rebound effect
Professor Frank Figge*
Kedge Business School Domaine de Luminy 13288 Marseille Cedex 9, France
Email:frank.figge@kedgebs.com
Tel: 0033-7 61 52 52 18
Professor William Young
Sustainability Research Institute School of Earth & Environment University of Leeds
Leeds LS2 9JT UK
Email:c.w.young@leeds.ac.uk
Dr Ralf Barkemeyer
Sustainability Research Institute School of Earth & Environment University of Leeds
Leeds LS2 9JT UK
Email:r.barkemeyer@leeds.ac.uk
* Corresponding author
Abstract
A frequent criticism of eco-efficiency strategies is that an increase in efficiency can be offset
by the rebound effect. Sufficiency is discussed as a new strategy involving self-imposed
restriction of consumption but can also be subject to the rebound effect. We show that the
range of possible secondary effects of efficiency and sufficiency strategies goes beyond the
rebound effect. The rebound effect can indeed also be linked to eco-sufficiency strategies but
there are further secondary effects of both eco-efficiency and eco-sufficiency strategies, such
as double dividend effects. We develop an ‘Eco-efficiency-sufficiency matrix’ to logically
order eco-efficiency and sufficiency measures to attain lower resource consumption and
emissions.
Keywords
1 Introduction
The absolute reduction of environmental pressures from resource consumption and emissions
should be the end goal of eco-efficiency and (more recently defined) eco-sufficiency
strategies. Eco-efficiency [1-4] can be put forward as a “win-win” strategy to arrive at a more
sustainable use of resources. However it is criticised for its limited ability to lower resource
consumption and emissions due to the rebound effect [5-9]. If an increase in efficiency does
not reduce resource use then an overall reduction in economic activity is called for.
Consequently, more recently eco-sufficiency (see Table 1) has gained attention as a possible
alternative to lower environmental pressures through self-imposed restriction of consumption
[10-18]. While the rebound effect has previously been primarily discussed in relation to
eco-efficiency it is now also linked to eco-sufficiency and the existence of the rebound effect in
the context of individual eco-sufficiency has even been called a certainty [14].
____________________________________________________
TABLE 1 ABOUT HERE
____________________________________________________
If a reduction in resource use is required for society to become sustainable and neither
eco-efficiency increases nor voluntary eco-sufficiency on a micro level can reduce resource use,
then an overall reduction of economic activity on the macro level appears to be the ultimate
choice. Whether and how this can be achieved democratically is being discussed [16, 19-22].
In this context van Griethuysen [23, p. 595] comes to the conclusion that “aiming at the
reduction of the economic throughput and promoting responsible consumption and voluntary
simplicity as demand-side alternatives to consumerism, degrowth proposals are
unsurprisingly confronted by systematic and systemic discrimination.” This hints at
This article makes two contributions in this context.
Firstly, we argue that the secondary effects of eco-efficiency and eco-sufficiency strategies
have been prematurely limited to the rebound effect. Much attention has been given to the
rebound effect of eco-efficiency strategies. This article shows that a range of secondary
effects, including but not limited to the rebound effect, can occur in the case of eco-efficiency
strategies. In contrast to the great interest in eco-efficiency strategies only little attention has
been paid to the secondary effects of eco-sufficiency strategies. In particular the attention has
concentrated on consumers limiting their own consumption [e.g. 12, 24, 25] with only some
very preliminary investigation of eco-sufficiency on the production side [e.g. 26, 27]. This
article therefore conducts a systematic analysis of secondary effects of eco-sufficiency
strategies on the demand and supply side. It finds that rebound effects occur as well as double
sufficiency effects.
Secondly, we show that on the basis of some assumed societal preferences that we make
explicit there is a logical order to the strategies society can choose to lower resource
consumption and emissions in the presence of the secondary effects that we discuss.
We develop an ‘Eco-efficiency-sufficiency matrix’ to order logically eco-efficiency and
sufficiency measures to achieve lower resource consumption and emissions. As we build on,
criticize and expand upon existing literature on the rebound effect we also closely follow the
typical presentation of the rebound effect. We acknowledge that it is deeply rooted in classical
economics. We argue that even from and within the perspective of classical economics the
rebound effect is not a certainty as claimed by some [14]. Further criticisms of the existing
literature with regards to the assumptions made are of course possible but not subject of this
paper.
The article is structured as follows. The next chapter discusses eco-efficiency strategies and
strategies. The third chapter then moves on to discuss sufficiency strategies, starting with the
demand-side analysis of the link between eco-sufficiency and the rebound effect, which is
discussed in the literature. In this chapter we then move the debate further to address demand
and supply side and the rebound and double sufficiency effect. The findings are then
discussed in chapter 4 with the development of our ‘Eco-efficiency-sufficiency matrix’ as a
policy decision-making tool. The final section presents the conclusions of this paper.
2 Eco-efficiency strategies
Eco-efficiency reflects the output or return that is created relative to the harm or burden that is
caused. A higher return or output and a lower harm or burden is desired. Strategies aiming at
a higher eco-efficiency can therefore result in a higher output at a constant burden or a lower
burden at a constant output or combinations thereof. These alternatives are dominant and it
can therefore be concluded that, if these alternatives can be realized, there is a positive
contribution to sustainability as they have a higher performance in one dimension and an at
least unchanged performance in the other dimension. Efficiency-driven strategies are quite
common in the corporate context and it is therefore not surprising that they are often
portrayed as a business contribution to sustainability [2, 28, 29].
However, it has long been argued that there is a risk that eco-efficiency could become a
victim of its own success [for example 5, 9, 30]. In other words, there is a risk that increased
eco-efficiency leads to increased resource use. In such a situation a ‘rebound effect’ occurs
where the additional resources used exceed the resources saved through eco-efficiency. This
situation is also referred to as Jevons’ paradox.
Jevons [31] showed among others that the increase of the efficiency of the steam engine
between the middle of the 18thand the middle of the 19thcentury resulted in its increased use.
“Now, if the quantity of coal used in a blast-furnace, for instance, be diminished in
comparison with the yield, the profits of the trade will increase, new capital will be attracted,
the price of pig-iron will fall, but the demand for it increase; and eventually the greater
number of furnaces will more than make up for the diminished consumption of each. And if
such is not always the result within a single branch, it must be remembered that the progress
of any branch of manufacture excites a new activity in most other branches, and leads
indirectly, if not directly, to increased inroads upon our seams of coal.” [31, p. 124-5]
Today the rebound effect is intensely discussed in energy economics, management and policy
[e.g. 6, 32-35] and in a general environment context [e.g. 5, 9, 30, 36, 37]. A reason for this
rebound effect could be for example that a higher eco-efficiency has reduced the cost of
production, which in turn results in more demand for the good produced and thus more (rather
than less) resources being used. A more efficient company might therefore end up using more
rather than fewer resources. It can be argued that in such a situation some other mechanism
that restricts the total amount of environmental resources used is needed. Figge and Hahn [38]
continue this discussion in more detail.
The question whether the rebound effect compensates some, all or even outweighs the
reduction gains that can theoretically be attained due to efficiency strategies is of particular
interest and intensely debated [e.g. 6, 39, 40-46].
In the following we will discuss two extreme cases of two products that are perfect substitutes
and the case of two products that are perfect complements to show that the rebound effect
depends on the shape of the indifference curves.
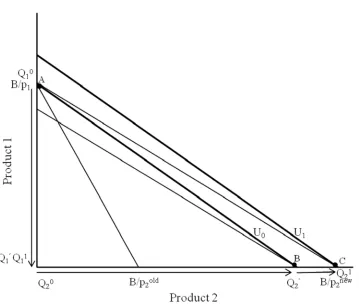
Perfect substitutes
In the case of perfect substitutes the consumer is indifferent about the composition of his or
her portfolio of products 1 and 2. This can be the case when both products serve the same
renewable energy (product 2) can serve as an example in this context. From the perspective of
the consumer there is no limit to the degree to which one can be substituted by the other. In
Figure 1 the indifference curves are therefore straight lines.
Initially consumption takes place at point A, i.e. only product 1 is consumed while there is no
consumption of product 2. As a result all of the electricity that is consumed is based on fossil
fuels. Analogously to Figure 1 renewable energy now becomes more efficient, which impacts
the budget line. With the overall budget more of product 2 and the same amount of product 1
could now be bought.
____________________________________________________
FIGURE 1 ABOUT HERE
____________________________________________________
Initially only product 1 was bought. This corresponds to a situation where electricity based on
fossil fuels is cheaper than electricity based on renewable energy and therefore preferred by
consumers.
Through the increase in efficiency product 2 has now become cheaper than product 1. We
discuss once again the substitution and the income effect. Consumption of product 1 is now
reduced to zero and consumption of product 2 increases to point B through the substitution
effect and further to point C through the income effect. All of the electricity consumed in our
example is now based on renewable energy.
There is no income effect of the consumption of product 1 but a substitution effect of product
2 at the expense of product 1. If we assume that the efficiency gain is exclusively due to a
more efficient use of energy or environmental resources and that product 2 is more
environment-friendly than product 1 then we can conclude that the overall effect on the
the efficiency-induced effect if the positive environmental effect due to substitution exceeds
the negative income effect. We refer to this as a double-dividend effect. The efficiency gain
results not only in a better environmental performance of product 2 but also of product 1.
Under the continued assumption that the efficiency effect is exclusively due to a more
efficient use of energy or environmental resources, the positive environmental effect due to
substitution will not exceed the negative income effect and the overall effect will therefore
still be positive. This is due to the fact that the income effect will at most compensate the
positive effect due to the increase of efficiency.
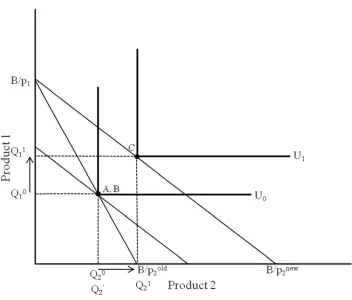
Perfect complements
We now assume that the products are perfect complements. There is for example a
complementary relationship, albeit not perfect, between planes and kerosene or household
appliances and electricity use. We assume for our example that product 1 is more polluting
(e.g. kerosene) than product 2 (e.g. production of planes).
In the case of perfect complementarity two products are used in a given ratio. This is reflected
by the indifference curves in Figure 2. An additional unit of one product does not add any
utility unless more of the other product is also consumed at the same time.
We assume once again that the efficiency of product 2 increases. In the case of perfect
complementarity we observe no substitution but only an income effect. Through the increase
in efficiency the slope of the budget line changes. The change in slope of the budget line in
isolation does not lead to a change in consumption; points A and B are identical. This is due
to the fact that consumption of the two goods must be in a given ratio. There is therefore no
substitution of product 1 by product 2.
There is however an income effect. Consumption moves from point A to point C. The
Interestingly, for the income effect it does not matter whether product 1 or 2 becomes more
efficient. In both cases the consumption of both goods increases to the same degree.
If we continue to assume that the increase in efficiency is due to a more efficient use of
energy or environmental resources, then we can conclude that the positive environmental
effect due to a higher efficiency of product 2, i.e. the less polluting one, will be more than
compensated by the negative environmental consequences of the income effect, i.e. we will
observe a backfire effect. We speak of backfire when more environmental resources are used
as a result of an efficiency increase [39].
____________________________________________________
FIGURE 2 ABOUT HERE
____________________________________________________
As the examples above show an increase of eco-efficiency of one product can have varying
effects on the lowering of resource consumption and emissions. The extremes reach from
backfiring to results that go beyond the effect that is caused by an increase in eco-efficiency
(double dividend effect). Between the two extremes there can of course be a rebound effect to
different degrees. The shape of the indifference curves and therefore the relationship between
different products play a key role in this context.
The examples above relate to consumption. It can be argued analogously for production.
Production factors can be complements or substitutes, which will determine the shape of the
isoquants.
The rebound effect is discussed later in this article in the context of eco-sufficiency strategies
[14]. A rebound effect occurs in this context when voluntary reduction of resource use is
3 Eco-sufficiency strategies
The previous section has shown that there are a range of possible secondary effects of
eco-efficiency strategies. Eco-eco-efficiency strategies cannot guarantee lower resource consumption
and emissions. Sufficiency is therefore increasingly discussed as a strategy to achieve this
[11-17, 26]. At first sight sufficiency strategies appear to guarantee lower resource
consumption and emissions. As Alcott [14] shows this is not necessarily the case. A
self-imposed restriction of consumption can lead to lower prices, which entices other consumers
to consume more, which leads, similar to the efficiency case above, to a rebound effect.
While such a sufficiency rebound effect can certainly exist we disagree with Alcott that the
sufficiency rebound is a certainty [14, p. 777]. In the following we address two limitations
and one imprecision. Alcott concentrates on consumers when discussing sufficiency
strategies; we believe that sufficiency strategies must not be restricted to consumers but can
also apply to producers. Alcott furthermore concentrates on the existence of a rebound effect.
We show that there can even be a double sufficiency effect, i.e. a sufficiency effect that goes
beyond the initial reduction associated with following a sufficiency strategy. In the following
we discuss all four cases, i.e. demand and supply side with both rebound and double
sufficiency effects. Table 2 summarises the underlying rationales of the four cases that are
explained in more detail below.
____________________________________________________
TABLE 2 ABOUT HERE
____________________________________________________
In our analysis we also correct an imprecision in Alcott’s analysis. Alcott uses a classical
demand and supply analysis for his analysis and we follow him in this regard. However,
Alcott models sufficiency strategies by a parallel translation of the demand curve suggesting
compatible with the idea of sufficiency that proposes an absolute limit irrespective of the
price. Put differently, sufficiency presupposes that the additional demand or supply is not a
matter of a lower (demand) or higher (supply) price but that the decision to limit demand or
supply is taken irrespective of market considerations.
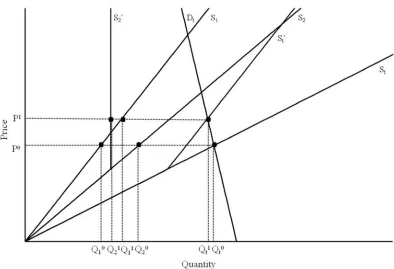
3.1 Demand-side sufficiency rebound effect
In the following the sufficiency rebound effect is shown using a classical analysis based on
demand and supply curves. As outlined above, our analysis differs from earlier analyses with
regard to the shape of the demand curves. When a consumer follows a sufficiency strategy the
demand curve changes. Earlier analysis models this by shifting the demand curve to the left
[14]. This does, however, not reflect a sufficiency strategy but rather a lower willingness to
pay for a given quantity. Any given quantity can still be attained as long as the price is low
enough. In our analysis the demand curve becomes a vertical line at a given quantity. This
reflects that the consumer would not demand more than a given quantity whatever the price.
Figure 3 shows our analysis. In this figure there are two consumers or consumer groups (1, 2).
Both consumers show the usual demand curves (D1, D2), i.e. they demand higher quantities as
the price decreases. There is furthermore one supply curve (St). The supply curve also has the
usual shape, i.e. as the price increases higher quantities are offered. Suppliers are passive, i.e.
their behaviour does not change and they do not follow a sufficiency strategy. They are in
particular interested in selling higher quantities when the price increases and they will sell less
when the price decreases.
Consumer 2 adopts a sufficiency strategy. Above a given quantity the demand curve (D2’) for
this consumer therefore becomes a vertical line. This also has an impact on the total demand
curve (Dt). The total demand curve describes the combined demand curves of consumers 1
determine the overall price and quantities consumed in the market. We furthermore
distinguish between t0 (situation before the sufficiency strategy) and t1 (situation after the
sufficiency strategy). We can now observe the following effects.
Before the adoption of the sufficiency strategy by consumer 2 a quantity of Qt0at price P0is
demanded. This is where total supply (St) and demand (Dt) curves intersect. The total quantity
of Qt0corresponds to the sum of Q10and Q20, i.e. the sum of the quantities demanded by
consumers 1 and 2. Similar to Alcott we now make the assumption that consumer 2 decides to
unilaterally restrict its consumption. We assume, also in line with Alcott, that the consumer
decides to work less at the same time, i.e. the consumer reduces its available budget. In
principle the quantity demanded goes down from Qt0total to Qt0’. Qt0’ describes the quantity
that would be demanded by all consumers had the price not changed. A reduction of the
demand will however also lead to a decrease of the price. The new price (P1) can be found by
looking at the intersection of the new total demand curve (Dt’) and the supply curve (St). At
price P1a quantity of Qt1is demanded. As can be easily seen the reduction of the total
quantity (Qt1-Qt0) is less than the reduction of quantity demanded by consumer 2 (Q21-Q20).
This is due to an increase of quantity demanded by consumer 1. Consumer 1 profits from the
lower price and demands a higher quantity (Q11rather than Q10). Consumer 2 therefore
creates a positive externality for consumer 1. This can be considered a typical positive
externality as consumer 2 incurs the private cost and consumer 1 benefits from the public
benefit. The additional quantity demanded by consumer 1 corresponds to the sufficiency
rebound effect.
____________________________________________________
FIGURE 3 ABOUT HERE
The size of the rebound effect will depend on the shape of the demand and supply curves [14,
p. 776]. A lower elasticity of demand of consumer 2 will lead to a larger fall in price when the
sufficiency strategy is followed. This will increase the attractiveness for consumer 1 to
consume more. By how much the price changes will also depend on the elasticity of supply.
The lower the elasticity of supply the higher the price drop as consumer 1 changes the
quantity demanded. Finally, the size of the rebound effect will depend on the reaction of
consumer 1 to the price changes. Consumer 1 will create the more additional demand the
higher his elasticity of demand.
That lower demand leads to lower prices and lower supply on the one hand and an increase of
demand by other consumers and thus a higher demand on the other hand is a standard
assumption in economics. We find this situation in particular when we have a situation of
perfect competition where there are many suppliers and consumers. Commodity markets are a
good example here. Commodity markets trade products with little differentiation. A fall in
demand of one consumer of a product like gold, orange juice or natural gas that leads to a
price drop is likely to be partly or fully compensated by an increase of demand of other
consumers. We expect to observe a rebound effect. A unilateral reduction of demand will
therefore risk being ineffective on the level of total demand at least in the medium to long
term.
3.2 Demand-side double sufficiency effect
The sufficiency rebound effect is only one of several possible effects. To show this point we
introduce in the following the demand-side double sufficiency effect. The demand-side
double sufficiency effect describes a situation in which the sufficiency strategy of one
consumer leads to a reduction in consumption of another consumer. This can for example
similar to the sufficiency rebound effect. Figure 4 illustrates the situation of the double
sufficiency effect. In this figure the supply curve now has a different shape. The supply curve
represents a situation in which higher quantities are linked to lower rather than higher
marginal costs. This can for example be the case when production is linked to high fixed and
low variable costs. In such a case economies of scale exist (almost) indefinitely.
____________________________________________________
FIGURE 4 ABOUT HERE
____________________________________________________
We continue to assume that there are two consumers and that consumer 2 follows a
sufficiency strategy. As in the previous example this does not only have an impact on the
demand function of consumer 2 but also on the total demand function. Before consumer 2
follows a sufficiency strategy there is a demand of Qt0Total at a price of P0. This is where the
total demand curve and the supply curve intersect. What is different in this case here is that
when consumer 2 reduces his demand to Q21’the price increases rather than decreases. This is
due to the fact that a large block of fixed costs must be distributed across a smaller quantity.
In contrast to the example above the quantity of Qt0’, i.e. the quantity that would be demanded
at an unchanged price, exceeds the quantity of Qt1’, i.e. the quantity that is demanded at the
new price. Interestingly, it is not only consumer 2, who makes a contribution to the reduction
of the quantity demand. As the price increases consumer 1 also reduces his consumption (Q10
bigger than Q11).
We therefore observe a demand-side double sufficiency effect, which consists of the
autonomous reduction in demand of consumer 2 and the price-induced reduction of demand
of consumer 1. At first sight this example might sound rather hypothetical. Natural
monopolies are however not uncommon for example in the airline industry [47]. Flying an
same route. As the average load factor of the plane decreases the fixed costs must be
distributed across a smaller number of passengers. This can result in higher prices and
discourage further passengers from flying. A few passengers that decide not to fly on a
particular route any more might drive up the price for the remaining passengers, which in turn
discourages the remaining passengers to fly on this route, leading to a collapse of the route
altogether. Interestingly, when the closure of plane routes is announced insufficient load
factors are usually given as a justification. Other examples have in common that they refer to
products with high fixed costs of production. Uncongested toll roads, electricity production or
hotels are other examples of natural monopolies in this context. A reduction of demand can in
these cases drive up prices for all consumers, which can lead to a further reduction of demand.
3.3 Supply-side sufficiency rebound effect
Sufficiency is usually discussed in the context of consumption. It is widely accepted that there
are consumers, who – rather than maximising – limit their consumption. Sufficiency
strategies must not be limited to consumers but can also extend to the supply side. There is an
increasing amount of evidence that there are decision makers, who pursue more than a single
objective and are willing to compromise on an economic objective at the benefit of an
environmental or social objective. The literature on social entrepreneurship and the role of
social issues in SMEs is a good example in this context [see e.g. 48, 49, 50]. Alternatives to
the model of economic man are indeed discussed in the literature not only with regards to
consumers but also to firms [51]. For the supply side an analysis similar to the analysis for the
demand-side can be conducted and due to the analogy this can be done more succinctly.
We now distinguish between two suppliers and a single demand curve. In the supply-side
analysis it is now the consumers, who are passive, while supplier 2 is active. Supplier 2
a given quantity. This reflects that the supplier will not offer more of his product after a given
quantity regardless of the price offered. We are now interested in the impact this will have on
the total supply curve. Analogously to the analysis of the demand side the total supply curve
will bend upwards (rather than downwards) from a given point.
____________________________________________________
FIGURE 5 ABOUT HERE
____________________________________________________
Figure 5 shows the different effects. Before the implementation of supplier 2’s sufficiency
strategy a total of Qt0at a price of P0is sold. Supplier 2 decides to limit production to Q21’.
This results in an increase of the price to P1and a reduction of the total quantity offered to
Qt1. The reduction from Qt0to Qt1is less than the self-inflicted reduction of supplier 2 (Q20to
Q21’). This is due to the fact that supplier 1 profits from the price increase and offers Q11
rather than Q10. This constitutes a positive externality from the perspective of supplier 1. We
observe a supply-side rebound effect. The reduction of supply of supplier 2 is partially offset
by an increase of supply of supplier 1.
The size of the rebound effect will, analogously to the rebound effect on the demand side,
depend on the shape of the demand and supply curves. The lower the elasticity of demand and
the higher the elasticity of supply of supplier 1 the more pronounced will be the rebound
effect.
We would expect to see such an effect in cases that are similar to the demand-side sufficiency
rebound effect. Where there is perfect competition on commodity markets we would expect
other suppliers to take advantage of a reduction of supply by another supplier. A unilateral
reduction of supply will therefore risk being ineffective on the level of total supply. This
applies for example to orange juice, natural gas or gold. A unilateral reduction of supply of
This effect might not be immediate but will happen over time. The much-cited pork cycle
effect [52] is a good example in this context. Suppliers will react to market changes even if it
takes some time and might result in temporary under- or overshooting of supply.
3.4 Supply-side double sufficiency effect
In the case of the supply-side effects it is supplier 2 who is active and consumers are passive.
Consumers will therefore not work more or less to have the same purchasing power as a
reaction to the sufficiency strategy of supplier 2.
The following example will show that there can be a double sufficiency effect as a result of an
autonomous reduction of supply by supplier 2. The double sufficiency effect consists on the
one hand of an overall reduction of consumption of the good of which supplier 2 reduces the
supply and on the other hand of a reduction of the budget that consumers have available after
the consumption of this good.
In Figure 6 we see the usual two suppliers 1 and 2 where 2 follows a sufficiency strategy in
t1. Demand for this product is less elastic (in absolute terms) than the total supply. By
restricting supply of this product the price goes up from P0to P1. Supply of this product by
supplier 2 goes down from Q20to Q21. We observe yet again that supplier 1 will increase
production from Q10to Q11, i.e. we observe a rebound effect. As long as this rebound effect of
supplier 1 is less pronounced than the sufficiency effect of supplier 2 we observe a net single
sufficiency effect. This is the case here as Qt0exceeds Qt1.
Due to the inelastic demand the prices increase drastically. This leads to the second
sufficiency effect. At t0 consumers spend a total budget of P0*Qt0on this product. After the
reduction of supply the budget increases as consumers must now spend P1* Qt1. The
additional budget, i.e. P1* Qt1- P0*Qt0, cannot be spent on other products and the sufficiency
____________________________________________________
FIGURE 6 ABOUT HERE
____________________________________________________
At this stage and without an analysis of the demand for other products we can only say that
the budget that is available for other products will be reduced. The demand for which
products will be reduced will depend on the shape of the individual demand curves.
We expect this effect to occur whenever the demand for and the supply of a product is very
inelastic. In such a case reductions of supply will lead to higher prices even in the long run
and will require consumers to spend a higher proportion of their budget on that product at the
expense of the consumption of other products.
Veblen [53] and Giffen [54] goods are extreme examples in this context. In the case of these
goods demand even increases as prices go up. In the case of Veblen goods they become more
attractive as they become more expensive. This can be the case of luxury products that are
considered to be more exclusive as they become more expensive. Giffen goods are consumed
more as their prices increases as they remain the cheapest way of satisfying a basic need and
will therefore not be substituted by other goods despite the higher price. Fossil fuels for
heating purposes can serve as an example here. Heating houses is a basic need. As fuel prices
go up the money spent on fossil fuels at an unchanged or even lower consumption of fossil
fuels increases. Other fuels are even more expensive. Consumers therefore have no choice but
to increase the share of their budget they spend on fossil fuels and to decrease the
consumption of other products. This is also being discussed as the problem of fuel poverty
4 Prioritising eco-efficiency and sufficiency strategies forlower resource consumption
and emissions
The fundamental premise of this paper is that lowering resource consumption and emissions
is the broad societal aim when eco-efficiency and eco-sufficiency strategies are promoted and
implemented. As shown above neither eco-efficiency strategies nor eco-sufficiency strategies
can guarantee lower resource consumption and emissions. However, the picture is not as
bleak as it is sometimes painted. Neither eco-efficiency nor eco-sufficiency will necessarily
result in a rebound effect. The challenge is to prioritize eco-efficiency and eco-sufficiency
strategies to aid decision-making on environmental policy that needs to balance economic
growth and lower resource consumption and emissions such as greenhouse gases [56].
In our ‘Eco-efficiency-sufficiency matrix’ in Figure 7 we start by addressing this challenge by
bringing eco-efficiency, eco-sufficiency and other forms of collective restraint into a logical
order. This Figure illustrates the logic of the relationship, which exists between eco-efficiency
and eco-sufficiency in the pursuit of lower resource consumption and emissions.
____________________________________________________
FIGURE 7 ABOUT HERE
____________________________________________________
The figure reflects two sets of normative assumptions that we make.
On the one hand we assume that anything that does not require any restraint, i.e. any kind of
optimisation, is preferred to restraint and that individual restraint is preferred to collective
restraint. An eco-efficiency strategy that allows producing the same output with fewer
resources would be an example for an optimisation that does not require any restraint. This
reflects an individualistic worldview, i.e. that actions taken voluntarily by individuals are
On the other hand we assume that anything that preserves utility is better than something that
reduces utility. An eco-efficiency strategy that produces a higher output at a constant resource
use would be an example of a strategy that is preferred to a strategy that reduces output to
keep resource use constant. This can be considered obvious as it follows the standard
assumption that a higher utility is preferred to a lower utility.
Eco-efficiency increases the ratio of desired output to undesired resource use. By increasing
eco-efficiency the use of resources is optimised. Eco-efficiency can deliver reductions
whenever the increase of eco-efficiency is not outstripped by the growth of demand.
Eco-efficiency strategies then have the potential to reduce the burden on the environment at no
cost, i.e. not requiring any restraint. Eco-efficiency strategies are therefore a first priority.
Where eco-efficiency strategies do not deliver reductions, some kind of restraint is necessary.
We now distinguish between four cases of restraint.
The first case is individual eco-sufficiency. It is based on the voluntary decision of a single
decision maker to reduce his or her resource consumption such as electricity use knowing that
it will entail a net-reduction of his utility. This frees up resources at a net cost to the
decision-maker. These resources can be used by another decision-maker, which leads to a rebound
effect.
The second case is collective restraint to counter the rebound effect of individual
eco-sufficiency. This is for example the case when emissions are reduced by an individual
decision maker and the equivalent amount of emission permits are taken from the market.
This is to make sure that the resources saved through the eco-sufficiency of a single
decision-maker are not used by another decision-decision-maker. It ensures that the lower resource consumption
and emissions intended by the decision-maker on the individual level is also reached on the
there is therefore no loss of utility of other decision-makers compared to the initial situation,
i.e. prior to the eco-sufficiency initiative of one decision-maker, who bears the full cost.
The third case takes into consideration that a widely recognized reason for environmental
degradation is the existence of externalities. Externalities occur when the cost and the benefit
of a decision are not borne by the same decision-maker. The relevant consequence in this
context “is not that one person pays for what someone else gets but that nobody pays and
nobody gets, even though the good is worth more than it would cost to produce” [57, p. 278].
In the presence of externalities society therefore risks to attain a suboptimal level of utility. In
the environmental context it is usually assumed that too many resources are used due to
externalities. Collective restraint in the form of a Pigouvian tax [58], the assignment of
property rights [59] or command and control measures are therefore the third case. They make
sure that the societal optimum, i.e. a higher level of utility is reached. This higher utility on
the societal level can come at a net-cost to individual decision-makers.
A fourth case is a collective commitment to eco-sufficiency such as an individual carbon
budget within a capped societal budget. Following the definition of eco-sufficiency above and
in analogy to individual eco-sufficiency there will be a net loss of utility.
Case one is preferred to the other cases as it reflects our preference of individual over
collective restraint. Case two is preferred over cases three and four as it comes at no cost to
the collectivity. Case three is preferred to case four as it increases or at least preserves utility
on the societal level. The fourth case will come at a net cost to society.
We can now bring eco-efficiency, eco-sufficiency and other forms of collective restraint into
a logical order as outlined in our ‘Eco-efficiency-sufficiency matrix’ in Figure 7. This figure
illustrates the logic of the relationship, which exists between efficiency and
are not achieved or the rebound effect reaches a threshold at which it outweighs the initial
action the next step is required. Whether the disutility of eco-sufficiency strategies is justified
in the light of the possible environmental benefits is a separate question.
Hence our ‘Eco-efficiency-sufficiency matrix’ could be used to inform policy
decision-making to maximize the potential for lower resource consumption and emissions by avoiding
the rebound effect. This can be incorporated into existing policy assessments, e.g. the UK
Government ‘Sustainable Development Specific Impact Test’ [60]: “The role of the
Sustainable Development Specific Impact Test is to enable government departments
conducting policy appraisal to identify key impacts of their policy options relevant to
sustainable development and to give informed advice to ministers on sustainability-related
issues.” The matrix is a simple method to logically work through where a particular policy
has rebound effects and how these can be eliminated.
5 Conclusions
Eco-efficiency and eco-sufficiency strategies are frequently discussed as possible
contributions to lower resource consumption and emissions. This article has aimed to provide
a thorough analysis of the relationship of eco-efficiency and eco-sufficiency in the pursuit of
lower resource consumption and emissions from both the supply- and demand-side. This
article shows that both eco-efficiency and eco-sufficiency can be linked to the rebound effect
but that this is not a certainty. It does become clear though that the link between
eco-efficiency and eco-sufficiency strategies in our ‘Eco-eco-efficiency-sufficiency matrix’ cannot be
assessed in isolation but must take into account the reaction of other market participants.
An interesting question in this context is whether eco-efficiency strategies or eco-sufficiency
strategies should be preferred in a given situation. We interpret the rebound effect as positive
different levels of societal restraint. Based on an individualistic and utilitarian worldview we
can then prioritize eco-efficiency and eco-sufficiency strategies. On this basis we can
determine which sufficiency strategy should be chosenwhensufficiency strategies are taken.
A limitation of this article is that this does not tell us,ifsufficiency strategies should be taken.
Again following a utilitarian perspective, to be able to take this decision the environmental
benefit would have to be compared to the disutility of the sufficiency strategy. Further
research on how to deal with this trade-off is urgently needed. While cause and effects of
sufficiency strategies are difficult to establish under real world conditions it would
nevertheless be most insightful to see empirical studies on the impact of eco-sufficiency
References
[1] World Business Council for Sustainable Development. Eco-Efficiency and Cleaner Production: Charting the Course to Sustainability. Geneva: WBCSD; 1996.
[2] DeSimone LD, Popoff F. Eco-efficiency. The business link to sustainable development. 2nd printing. ed. Cambridge, Mass.: MIT Press; 1998.
[3] Hukkinen J. Eco-efficiency as abandonment of nature. Ecological Economics. 2001:311-5. [4] McIntyre RJ, Thornton JR. On the environmental efficiency of economic systems. Soviet Studies. 1978;30(2):173-92.
[5] Berkhout PHG, Muskens JC, Velthuijsen JW. Defining the rebound effect. Energy Policy. 2000;28(6-7):425-32.
[6] Greening LA, Greene DL, Difiglio C. Energy efficiency and consumption - the rebound effect - a survey. Energy Policy. 2000;28(6-7):389-401.
[7] Binswanger M. Technological progress and sustainable development: what about the rebound effect? Ecological Economics. 2001;36(1):119-32.
[8] Herring H, Roy R. Technological innovation, energy efficient design and the rebound effect. Technovation. 2007;27(4):194-203.
[9] Herring H, Roy R. Sustainable services, electronic education and the rebound effect. Environmental Impact Assessment Review. 2002;22(5):525-42.
[10] Jakobsen M. The Relation of Eco-effectiveness and Eco-efficiency - An Important Goal in Design for Environment. 10 Symposium "Fertigungsgerechtes Konstruieren".
Schnaittach1999. p. 101-4.
[11] Princen T. The logic of sufficiency. 2005.
[12] Princen T. Principles for sustainability: from cooperation and efficiency to sufficiency. Global Environmental Politics. 2003;3(1):33-50.
[13] Lamberton G. Sustainable sufficiency–an internally consistent version of sustainability. Sustainable Development. 2005;13(1):53-68.
[14] Alcott B. The sufficiency strategy: Would rich-world frugality lower environmental impact? Ecological Economics. 2008;64(4):770-86.
[15] Calwell C. Is Efficient Sufficient? The Case for Shifting Our Emphasis in Energy Specifications to Progressive Efficiency and Sufficiency. Report to the European Council for an Energy Efficient Economy (ECEEE) March. 2010.
[16] Alexander S. Voluntary simplicity and the social reconstruction of law: degrowth from the grassroots up. Environmental Values. 2013;22(2):287-308.
[17] Demaria F, Schneider F, Sekulova F, Martinez-Alier J. What is Degrowth? From an activist slogan to a social movement. Environmental Values. 2013;22(2):191-215.
[18] Bernard M, Cheynet V, Clémentin B. Objectif décroissance: vers une société viable. Lyon: Parangon; 2003.
[19] Deriu M. Democracies with a future: Degrowth and the democratic tradition. Futures. 2012;44:553-61.
[20] Fournier V. Escaping from the economy: the politics of degrowth. International Journal of Sociology and Social Policy. 2008;28(11/12):528-45.
[21] Schneider F, Kallis G, Martinez-Alier J. Crisis or opportunity? Economic degrowth for social equity and ecological sustainability. Introduction to this special issue. Journal of Cleaner Production. 2010;18(6):511-8.
[22] van Griethuysen P. Bona diagnosis, bona curatio: How property economics clarifies the degrowth debate. Ecological Economics. 2012;84:262-9.
[24] Herring H. Energy efficiency—a critical view. Energy. 2006;31(1):10-20.
[25] Mont O, Plepys A. Sustainable consumption progress: should we be proud or alarmed? Journal of Cleaner Production. 2008;16(4):531-7.
[26] Huber J. Towards industrial ecology: sustainable development as a concept of ecological modernization. Journal of Environmental Policy and Planning. 2000;2(4):269-85.
[27] Dyllick T, Hockerts K. Beyond the business case for corporate sustainability. Business Strategy and the Environment. 2002;11(2):130-41.
[28] World Business Council for Sustainable Development. Eco-Efficiency. Creating more value with less impact. Geneva: WBCSD; 2000.
[29] Callens I, Tyteca D. Towards indicators of sustainable development for firms:: A productive efficiency perspective. Ecological Economics. 1999;28(1):41-53.
[30] Mayumi K, Giampietro M, Gowdy JM. Georgescu-Roegen/Daly versus Solow/Stiglitz Revisited. Ecological Economics. 1998;27(2):115-7.
[31] Jevons WS. The Coal Question. 2nd edition ed. London: Macmillan; 1866.
[32] Glomsrød S, Taoyuan W. Coal cleaning: a viable strategy for reduced carbon emissions and improved environment in China? Energy Policy. 2005;33(4):525-42.
[33] Herring H. Does energy efficiency save energy? The debate and its consequences. Applied Energy. 1999;63(3):209-26.
[34] Spielmann M, de Haan P, Scholz RW. Environmental rebound effects of high-speed transport technologies: a case study of climate change rebound effects of a future
underground maglev train system. Journal of Cleaner Production. 2008;16(13):1388-98. [35] Rood G, Ros J, Drissen E, Vringer K. A structure of models for future projections of environmental pressure due to consumption. Journal of Cleaner Production. 2003;11(5):491-8.
[36] Jevons F. Greenhouse - a paradox. Search. 1990;21(5):171-2.
[37] Mauerhofer V. Lose less instead of win more: the failure of decoupling and perspectives for competition in a degrowth economy. Environmental Values. 2013;22(1):43-57.
[38] Figge F, Hahn T. Sustainable Value Added - Measuring Corporate Contributions to Sustainability Beyond Eco-Efficiency. Ecological Economics. 2004;48(2):173-87.
[39] Saunders HD. A view from the macro side: rebound, backfire, and Khazzoom–Brookes. Energy Policy. 2000;28(6):439-49.
[40] Schipper L, Grubb M. On the rebound? Feedback between energy intensities and energy uses in IEA countries. Energy Policy. 2000;28(6):367-88.
[41] Schipper L. On the rebound: the interaction of energy efficiency, energy use and economic activity. An introduction. Energy Policy. 2000;28(6-7):351-3.
[42] Brännlund R, Ghalwash T, Nordström J. Increased energy efficiency and the rebound effect: Effects on consumption and emissions. Energy economics. 2007;29(1):1-17. [43] Dimitropoulos J. Energy productivity improvements and the rebound effect: An overview of the state of knowledge. Energy Policy. 2007;35(12):6354-63.
[44] Ouyang J, Long E, Hokao K. Rebound effect in Chinese household energy efficiency and solution for mitigating it. Energy. 2010;35(12):5269-76.
[45] Gillingham K, Kotchen MJ, Rapson DS, Wagner G. Energy policy: The rebound effect is overplayed. Nature. 2013;493(7433):475-6.
[46] Frondel M, Vance C. Energy efficiency: Don't belittle the rebound effect. Nature. 2013;494(7438):430-.
[47] Hurdle GJ, Johnson RL, Joskow AS, Werden GJ, Williams MA. Concentration, Potential Entry, and Performance in the Airline Industry. The Journal of Industrial Economics.
[48] Mair J, Marti I. Social entrepreneurship research: A source of explanation, prediction, and delight. Journal of World Business. 2006;41(1):36-44.
[49] Tan W-L, Williams J, Tan T-M. Defining the ‘social’in ‘social entrepreneurship’: Altruism and entrepreneurship. The International Entrepreneurship and Management Journal. 2005;1(3):353-65.
[50] Jenkins H. Small Business Champions for Corporate Social Responsibility. Journal of Business Ethics. 2006;67(3):241-56.
[51] Van Den Bergh JC, Ferrer-i-Carbonell A, Munda G. Alternative models of individual behaviour and implications for environmental policy. Ecological Economics. 2000;32(1):43-61.
[52] Rosen S, Murphy KM, Scheinkman JA. Cattle Cycles. Journal of Political Economy. 1994;102(3):468-92.
[53] Leibenstein H. Bandwagon, Snob, and Veblen Effects in the Theory of Consumers' Demand. The Quarterly Journal of Economics. 1950;64(2):183-207.
[54] Marshall A. Principles of Economics. An introductory volume. third edition ed. London: Maxmillan; 1895.
[55] Boardman B. Fixing fuel poverty: challenges and solutions: Routledge; 2013. [56] IPPC. Climate Change 2007: The Physical Science Basis. Contribution of Working Group I to the Fourth Assessment Report of the Intergovernmental Panel on Climate Change [Solomon, S., D. Qin, M. Manning, Z. Chen, M. Marquis, K.B. Averyt, M.Tignor and H.L. Miller (eds.)]. . Cambridge, United Kingdom and New York, NY, USA.: Cambridge University Press; 2007.
[57] Friedman DD. Hidden Order: The Economics of Everyday Life New York: Harper Business; 1997.
[58] Baumol WJ. On taxation and the control of externalities. The American Economic Review. 1972;62(3):307-22.
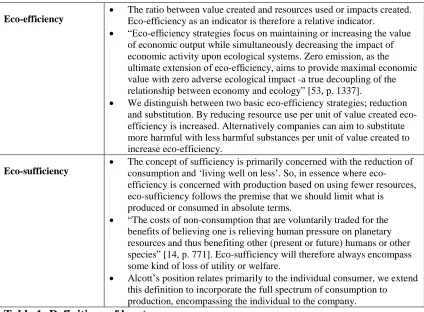
Eco-efficiency
The ratio between value created and resources used or impacts created. Eco-efficiency as an indicator is therefore a relative indicator.
“Eco-efficiency strategies focus on maintaining or increasing the value
of economic output while simultaneously decreasing the impact of economic activity upon ecological systems. Zero emission, as the
ultimate extension of eco-efficiency, aims to provide maximal economic
value with zero adverse ecological impact -a true decoupling of the relationship between economy and ecology” [53, p. 1337].
We distinguish between two basic eco-efficiency strategies; reduction and substitution. By reducing resource use per unit of value created eco-efficiency is increased. Alternatively companies can aim to substitute more harmful with less harmful substances per unit of value created to increase eco-efficiency.
Eco-sufficiency
The concept of sufficiency is primarily concerned with the reduction of consumption and ‘living well on less’. So, in essence where eco-efficiency is concerned with production based on using fewer resources, eco-sufficiency follows the premise that we should limit what is produced or consumed in absolute terms.
“The costs of non-consumption that are voluntarily traded for the benefits of believing one is relieving human pressure on planetary resources and thus benefiting other (present or future) humans or other species” [14, p. 771]. Eco-sufficiency will therefore always encompass some kind of loss of utility or welfare.
[image:28.595.67.491.96.408.2] Alcott’s position relates primarily to the individual consumer, we extend this definition to incorporate the full spectrum of consumption to production, encompassing the individual to the company.
Demand side Supply side
Rebound effect
Lower demand leading
to lower prices, resulting
in more demand by other
consumers (3.1)
Lower supply leading to
higher prices, resulting in
an increased supply of
other producers (3.3)
Double
Eco-sufficiency
effect
Lower demand leading
to higher prices for and
lower demand of
remaining consumers
(3.2)
Lower supply leading to
a price increase, resulting
in a reduction of the
purchasing power of
consumers, decreasing
overall consumption
[image:29.595.75.432.98.385.2](3.4)