http://eprints.whiterose.ac.uk/130197/ Version: Accepted Version
Article:
Gudjónsdóttir, SR, Ilyinskaya, E orcid.org/0000-0002-3663-9506, Hreinsdóttir, S et al. (5 more authors) (2018) Gas emissions and crustal deformation from the Krýsuvík high temperature geothermal system, Iceland. Journal of Volcanology and Geothermal Research. ISSN 0377-0273
https://doi.org/10.1016/j.jvolgeores.2018.04.007
© 2018 Elsevier B.V. This manuscript version is made available under the CC-BY-NC-ND 4.0 license http://creativecommons.org/licenses/by-nc-nd/4.0/
eprints@whiterose.ac.uk Reuse
This article is distributed under the terms of the Creative Commons Attribution-NonCommercial-NoDerivs (CC BY-NC-ND) licence. This licence only allows you to download this work and share it with others as long as you credit the authors, but you can’t change the article in any way or use it commercially. More
information and the full terms of the licence here: https://creativecommons.org/licenses/
Takedown
If you consider content in White Rose Research Online to be in breach of UK law, please notify us by
Gas emissions and crustal deformation from the Krýsuvík high temperature geothermal system, Iceland
Sylvía Rakel Gudjónsdóttir, Evgenia Ilyinskaya, Sigrún
Hreinsdóttir, Baldur Bergsson, Melissa Ann Pfeffer, Karolina Michalczewska, Alessandro Aiuppa, Audur Agla Óladóttir
PII: S0377-0273(17)30335-9
DOI: doi:10.1016/j.jvolgeores.2018.04.007
Reference: VOLGEO 6350
To appear in: Journal of Volcanology and Geothermal Research
Received date: 24 May 2017
Revised date: 19 February 2018
Accepted date: 9 April 2018
Please cite this article as: Sylvía Rakel Gudjónsdóttir, Evgenia Ilyinskaya, Sigrún Hreinsdóttir, Baldur Bergsson, Melissa Ann Pfeffer, Karolina Michalczewska, Alessandro Aiuppa, Audur Agla Óladóttir , Gas emissions and crustal deformation from the Krýsuvík high temperature geothermal system, Iceland. The address for the corresponding author was captured as affiliation for all authors. Please check if appropriate. Volgeo(2017), doi:10.1016/j.jvolgeores.2018.04.007
ACCEPTED MANUSCRIPT
Gas emissions and crustal deformation from the
Krýsuvík high temperature geothermal system,
Iceland.
Sylvía Rakel Gudjónsdóttir (1,2), Evgenia Ilyinskaya (3,4,5), Sigrún Hreinsdóttir (1,6), Baldur Bergsson (3), Melissa Ann Pfeffer (3), Karolina Michalczewska (1), Alessandro Aiuppa (7), Audur
Agla Óladóttir (2)
(1) Institute of Earth Sciences, University of Iceland, Sturlugata 7, Askja, 101 Reykjavík, Iceland
(2) Iceland GeoSurvey, Grensásvegur 9, 108 Reykjavík, Iceland (3) Icelandic Meteorological Office, Bústaðarvegi 7-9, 108 Reykjavík, Iceland
(4) School of Earth and Environment, University of Leeds, Leeds, LS7 4LR, United Kingdom (5) British Geological Survey, The Lyell Centre, Edinburgh, EH14 4AP, United Kingdom
(6) GNS Science, PO Box 30368, Lower Hutt 5040, New Zealand (7) Università di Palermo DiSTeM, Palermo, Italy
Abstract
The Krýsuvík volcanic system is located on the oblique spreading Reykjanes Peninsula, SW Iceland. Since early 2009 the region has been undergoing episodes of localized ground uplift and subsidence. From April-November 2013, we operated near-real time monitoring of gas emissions in Krýsuvík, using a Multi-component Gas Analyzer System (Multi-GAS), collecting data on gas composition from a fumarole (H2O, CO2, SO2, H2S). The
dataset in this study, comprises a near-continuous gas composition time series, the quantification of diffuse CO2 gas flux, analytical results for direct samples of dry gas,
seismic records, and GPS data. Gas emissions from the Krýsuvík geothermal system were examined and compared with crustal deformation and seismicity.
The gas emissions from the Krýsuvík system are H2O-dominated, with CO2 as the most
abundant dry gas species, followed by smaller concentrations of H2S. The average
subsurface equilibrium temperature was calculated as 278 °C. This is consistent with previous observations made through sporadic spot sampling campaigns. In addition, the semi-continuous Multi-GAS dataset reveals higher variations in gas composition than previously reported by spot sampling.
The diffuse soil CO2 flux is found to be variable between the three studied degassing areas
in Krýsuvík, ranging from 10.9-70.9 T/day, with the highest flux in Hveradalir where the Multi-GAS station is located. The total flux is estimated as 101 T/day.
Comparison between Multi-GAS and geophysical data shows that peaks of H2O-rich
emissions appears to follow crustal movements. Coinciding with the H2O-rich peaks, SO2
is detected in minor amounts (~0.6 ppmv), allowing for calculations of H2O/SO2, CO2/SO2
and H2S/SO2 ratios. This is the first time SO2 has been detected in the Krýsuvík area.
The large variations in H2O/CO2 and H2O/H2S ratios are considered to reflect variable
degassing activity in the fumarole. The activity of the fumarole appears less intense during intervals of low or no recorded seismic events. The H2O/CO2 and H2O/H2S ratios are
lower, presumably due to H2O condensation affecting the steam jet before reaching the
ACCEPTED MANUSCRIPT
Keywords: Krýsuvík, volcanic gas, volcano monitoring, geothermal gas, crustal
deformation, volcanic CO2 flux
1
Introduction
Monitoring volcanic and geothermal gases, along with seismicity and ground deformation, can lead to better understanding of volcano behavior, and provide an early warning of volcanic activity. Several studies have focused on quiescent degassing from active volcanic and geothermal systems, detecting peaks of increased gas emissions prior to eruptions (e.g., Young et al., 1998, Aiuppa et al., 2010). It has been shown that, under certain conditions, seismicity and ground deformation may help in releasing gases into these systems and increase fumarolic emissions (e.g., Watson et al., 2000, Italiano et al., 1998, Toutain and Baubron, 1999, Chiodini et al., 2012, 2015, and references therein). Monitoring of soil CO2 diffuse degassing in geothermal areas has also proven to give
reliable information on the mass/energy budget of utilized and non-utilized geothermal systems
(
Brombach et al., 2001; Chiodini et al., 2001, Fridrikson et al., 2006, Óladóttir, 2012). In Iceland, there has been limited research on the relationship between degassing from high temperature geothermal areas (where temperature at 1 km depth is greater than 200°C) and seismic energy release and ground deformation. The Krýsuvík volcanic system, located on the oblique spreading Reykjanes Peninsula (RP), is characterized by abundant degassing through soil and fumaroles within a high-temperature geothermal area. It has high seismic activity, characterized by swarms of micro-earthquakes as well as main-shock/aftershock sequences (Klein et al., 1977 and references therein, Ward and Björnsson, 1971, Kristjánsdóttir, 2013). In the last decade the region has undergone episodes of uplift and subsidence, with high seismic activity occurring during periods of uplift (Michalczewska et al., 2012).Here we present semi-continuous, near-real time gas measurements in the Krýsuvík geothermal system (April-November 2013). Such measurements are relatively new in Iceland with the first station installed on top of Mt. Hekla volcano in 2012 (Ilyinskaya et al., 2015; Di Napoli et al., 2016). We evaluate the composition of the gas emitted from the Krýsuvík geothermal system and interpret its origin. This is done through analysis of a semi-continuous time series of gas composition (Multi-GAS sensor system, e.g., Aiuppa et al., 2009), direct steam sampling of fumaroles, and quantification of the diffuse CO2 flux
from the geothermally active areas (accumulation chamber method, e.g., Fridriksson et al., 2006). The gas time series are compared to observations of ground deformation and seismicity in Krýsuvík.
1.1 Regional settings
ACCEPTED MANUSCRIPT
(Saemundsson and Sigurgeirsson, 2013). Krýsuvík currently hosts a high-temperature geothermal system, the heat source of which is considered to be dyke intrusions (Arnórsson et al., 1975, Arnórsson, 1987). Recent resistivity measurements within the Krýsuvík system indicate a conductive body at approximately 2 to 5 km depth (Didana, 2010, Hersir et al., 2013). This body is located near the central part of the Krýsuvík geothermal area, with an approximate size of 10 km2,and coincides with the source of the inflation and deflation observed with GPS and InSAR measurements (Michalczewska et al., 2012, Hersir et al., 2013). The lack of S-wave attenuation in the region has been used as an argument against the presence of large volumes of molten materials, with Adelinet et al., (2011) suggesting the presence of a gaseous or supercritical fluid at 6 km depth from the analysis of tomography data.
The Krýsuvík geothermal system is usually divided into six subareas: Sandfell, Trölladyngja, Köldunámur, Seltún, Hveradalir, and Austurengjar (Figure 2). This study is focused on the last three, which have the highest and most continuous geothermal surface activity including hot and altered ground with mud pools, fumaroles, and solfataras. The main surface activity is confined to the Vesturháls and Sveifluháls hyaloclastite ridges, including Seltún and Hveradalir, and Austurengjahver, east of the Sveifluháls ridge (Markússon and Stefánsson, 2011). The results of resistivity measurements indicate that the geothermal subareas within Krýsuvík, originate from one and the same system of an approximate size of 40-60 km2 (Gudmundsson et al., 1975, Saemundsson and Sigurgeirsson, 2013) (Figure 2).
2
Methodology and data processing
2.1 Gas compositon analysis using MultiGAS and direct fumarole sampling
A Multi-component Gas Analyzer System station (Multi-GAS, INGV-type, see e.g., Aiuppa et al., 2009 and references therein, Ilyinskaya et al., 2015) was installed on 26 April 2013 at Hveradalir in Krýsuvík (Figure 3), next to a fumarole in an area of high and persistent surface geothermal activity. Data collection was discontinued over a short period from 27 June – 5 July 2013 when the station was needed for another project. The sampling inlet was ~20 cm above ground level (Figure 3), which was necessary to avoid saturation of the CO2 sensor.
The inlet was tested at several heights above the ground, and this height gave the most reliable data. The setup of the station can vary between sampling sites. The site in Krýsuvík has much more steam coming from the ground, than the site at e.g., Mt. Hekla, where saturation problems with the sensors were not an issue, and the station was located inside a small hut (Ilyinskaya et al. 2015).
ACCEPTED MANUSCRIPT
regression lines (Aiuppa et al., 2009, 2010) and calculations were restricted to intervals when measured concentrations showed a substantial excess relative to ambient air (see e.g., Ilyinskaya et al., 2015). Overall uncertainty in the derived ratios is ≤20% (Aiuppa et al., 2009).
A total of eight samples of dry gas were collected in two campaigns with an eight week interval (Figure 2) from fumaroles with a focussed steam flow (four samples in Hveradalir, two in Seltún, and two in Austurengjar). The samples were collected into evacuated double port bottles with 25 ml of a 10M NaOH solution. The ground temperature next to the fumarole was recorded and was in all cases >97°C.
The dry gas samples were analysed for gas composition using standard procedures at the Iceland GeoSurvey (ÍSOR), Reykjavík, Iceland. Headspace gases (N2, CH4, Ar, H2, and
O2) were analysed for using gas chromatography in a Perkin-Elmer Arnel 4019 gas
chromatograph. CO2 and H2S were analysed for by titration of the caustic solution and the
gas to condensate ratio determined by weighing.
2.2 Soil temperature and diffuse CO2 flux through soil
The soil CO2 flux was measured using a West Systems fluxmeter in the three sub-areas of
Krýsuvík studied using the accumulation chamber method (e.g., Fridriksson et al., 2006). The method has proven to be an accurate way to measure soil CO2 fluxes in volcanic and
geothermal areas, since it does not require assumptions or corrections that depend on soil characteristics (Chiodini et al., 1998). The measurements were carried out on an approximately 25×25 meter grid, where possible. The total number of measurement points was 435; 217 in Hveradalir, 136 were in Seltún, and the remaining 82 were in Austurengjar. Most of the measurements were taken in late summer or autumn, during dry and calm weather conditions to avoid the influence of weather factors and water saturation of the soil. The average time of each measurement was 1-2 minutes, depending on the time the rate of CO2 concentration increase stabilized. To evaluate the total CO2 emission from
the areas measured the Kriging algorithm (Cardellini et al., 2003, and references therein) was used for interpolation. The soil temperature was measured with a handheld digital thermometer with a 15 cm long probe.
2.3 Geophysical data
The gas measurements was compared to seismic and GPS data from Krýsuvík. The seismic data were provided by the Icelandic Meteorological Office (IMO) from the SIL seismic network and included 217 events in the Krýsuvík region from late April through November 2013. The seismic moment was used to estimate the moment magnitude, MW
(Hanks and Kanamori, 1979):
(1)
The largest recorded seismic event for the study period was MW 2.2 on 11 July 2013. The
frequency-magnitude distribution (Gutenberg and Richter, 1944) for the Krýsuvík catalogue gives a magnitude of completeness, MW 0.75 and the slope or b-value of 1.6. All
ACCEPTED MANUSCRIPT
The global average b-value is around 1 but ranges locally from 0.5-2 depending on factors like the type of tectonic environment and stress. Keiding et al., (2009) used data spanning from 1997 to 2006 to evaluate the b-value for the Krýsuvík region, giving the considerably lower value of 0.9. The dataset used here (172 events) is considerably smaller which could bias the estimate. However, high b-values are often observed in volcanic and geothermal regions and are assumed to be related to heterogeneous crust as well as local stress perturbations and fluids (Wyss, 1973, Schorlemmer et al., 2005).
The daily cumulative seismic moment was estimated showing several peaks of increased seismic activity over the study period, with the largest one occurring in mid-July 2013.
The GPS station MOHA started continuous operation in 2010 to monitor crustal deformation in the Krýsuvík region. The station is located just north of the center of uplift observed from 2010 to 2011 (Figure 1) (Michalczewska et al., 2012).
GPS data was analysed using GAMIT/GLOBK version 10.4 using over 100 continuous global GPS stations to evaluate average daily site positions in the ITRF08 reference frame. In the processing we solve for station coordinates, satellite orbit and earth rotation parameters, atmospheric zenith delay every two hours, and three atmospheric gradients per day. The IGS08 azimuth and elevation dependent absolute phase center offsets were applied to all antennas and ocean loading was corrected for using the FES2004 model. To minimize the common mode signal in the time series the de-trended time series from the GPS station NYLA, outside the deforming region, were subtracted from the data. Figure 4 shows the local inflation/deflation periods from the last decade of vertical GPS data (2007-2016) at station MOHA. During the year of 2013 the estimated total subsidence was 21 mm. We used a running weighted average of seven days for the dataset when comparing to gas data.
3
Results
3.1 Assessment of the influence of meteorological conditions on the MultiGAS data
Before interpreting the MultiGAS data, we assessed the influence of meteorological conditions on the measurements. The gas ratios (H2O/CO2, H2O/H2S, H2O/SO2, CO2/H2S,
CO2/SO2, H2S/SO2) were compared to wind speed (m/s) and precipitation (mm/day) data.
ACCEPTED MANUSCRIPT
(09:00 and 18:00). The representative precipitation is the total accumulated precipitation per day (where one day is defined from 18:00-18:00 UTC), which is used to compare with all MultiGAS acquisitions made that same day.
All gas molar ratios showed greatest variability during dry periods (< 2 mm/day). However, high values for CO2/H2S, CO2/SO2 and H2S/SO2 ratios are not confined to the
dry periods since these gas species are less affected by condensation during rainy days than H2O (Figure 5).
During periods of low wind speed (<5 m/s) the CO2/H2S, CO2/SO2 and H2S/SO2 ratios
show the greatest fluctuation. Progressive decrease in ratios obtained and decrease in fluctuation of the ratios is observed with higher wind speeds (Figure 5). No visual correlation is apparent between the H2O/X ratios (where X stands for CO2, H2S and SO2)
with wind speed below 10 m/s (Figure 5).
To account for the influence of meteorological conditions we eliminate all gas molar ratios obtained during days of more than 2 mm/day precipitation in the analysis. Additionally, CO2/H2S, CO2/SO2 and H2S/SO2 ratios collected in periods of wind speed above 5 m/s
were eliminated.
3.2 Gas composition
The fumarole gas samples from Krýsuvík were dominated by H2O(96.6-99.6 vol%) with
CO2 as the dominant dry gas component (on average 83.8 vol%), followed by much
smaller amounts of H2S (on average 9.17 vol%), hydrogen (H2), nitrogen (N2), methane
(CH4) and argon (Ar) (Table 1). One sample (Seltún 1) had a small component of O2, a
result of atmospheric contamination during sampling.
The MultiGAS ratios detected (where effects of the meteorological conditions have been eliminated) are shown to be highly variable (Table 2). Minor amounts of SO2 were
measured for the first time in Krýsuvík by the MultiGAS sensor. The measured SO2
concentrations are very low but the bulk (63%) is above the detection limit (0.05 ppmv) of the MultiGAS sensor, allowing for calculations of the X/SO2 ratios (X = H2O, CO2 and
H2S). Concentrations below 0.05 ppmv are considered to be instrumental noise. The SO2
sensor is not quantitative below 1 ppmv so the measurements (0.05-1 ppmv) should only be viewed as qualitative assessments of SO2 presence with a great uncertainty.
The calculated ratios of H2O/CO2, H2O/H2S and CO2/H2S from the fumarole samples are
compared to the MultiGAS ratios in Table 3. The average value for H2O/CO2 and H2O/H2S
from the fumarole samples (220 and 2812, respectively, excluding the Seltún 1 sample), fall within the range of the highest H2O/CO2 and H2O/H2S ratios obtained by the
MultiGAS sensor (217 and 10,300, respectively). For CO2/H2S, the average and median
ACCEPTED MANUSCRIPT
3.3 Soil CO2 flux and temperature
The highest soil CO2 diffuse degassing values were found in areas with intense surface
activity, where steam rises through fissures and cracks towards the surface, (total 0.31 km2). The CO2 fluxes ranged between 0 and 29,200 g m-2 day-1 with an average value of
385 g m-2 day-1 and a median value of 6 g m-2 day-1. In Austurengjar (0.09 km2) 80% of the observation points showed low CO2 fluxes (<10 g m-2day-1) 68% in Hveradalir (0.140 km2)
and 51% in Seltún (0.08 km2) (Figure 6).
To process the CO2 measurement data and evaluate the total CO2 emission from the area
studied, sequential Gaussian simulations (sGs) were used. In this method, the sample set was used to generate a great number of equiprobable representations or realizations of the spatial distribution of the CO2 flux. For each area, 100 realizations were performed using
the sGs algorithm of the sgsim code by Deutsch and Journel (1998). The results of the 100 simulations are depicted in Figure 6, that shows the mean CO2 flux of individual cells in
the model which was generated from the original dataset.
The results from the three observation areas shows that the Hveradalir area had by far the greatest total flux of 70.9 T/day. Next was Seltún with 19.6 T/day and last Austurengjar with 10.9 T/day. The total CO2 soil flux from the three observation areas was estimated as
101 T/day. The soil temperature ranged between 4.2-99.0 °C with the average value 19°C and median value 12°C.
4
Discussion
4.1 Application of gas geothermometers
Gas geothermometers (here: Arnórsson et al., 1998 and Arnórsson and Gunnlaugsson, 1985, Table 4) were used to determine the subsurface temperature of the Krýsuvík geothermal system based on the fumarole steam composition (Table 5). The gas geothermometers assume that the concentrations of CO2, H2S and H2 in geothermal
reservoir waters are controlled by temperature dependent equilibria with minerals (Arnórsson and D´Amore, 2000).
The lowest individual variations were observed for both the CO2 geothermometers,
indicating a sub-surface temperature of 293°C (Table 5). The agreement of other geothermometers was not very good as predicted temperatures varied for individual samples. A substantial discrepancy was observed between the various geothermometers that are known from previous studies (e.g., Arnórsson and Gunnlaugsson, 1985).
ACCEPTED MANUSCRIPT
4.2 Correlation of geophysical observations and the MultiGAS data
The waterlevel of lake Kleifarvatn (Figure 2), which has no outlet river, suggest only relatively minor changes in ground water level during the measurement period of the MultiGAS station (April-November 2013), with the highest and lowest lake level of 138.22 m and 137.85 m on 26 September and 11 November 2013, respectively. For comparison, the difference between the highest and lowest waterlevel from 2003-2017 was 3.8 m (Icelandic Met Office, 2018). Groundwater level measurements in a borehole (TD-4) located over 6 km NNW of the MultiGAS station, west of Mt Trölladyngja (Figure 2), shows similar trend but with larger fluctuations with just over 3 m water level difference during the study period compared to over 15 m difference from 2009 to 2017 (Elefsen, S, Ó, personal communications 13 February 2017). Based on this, changes in groundwater in the area over the study period, were not considered to be a major factor in the gas composition, nor the activities of the fumaroles in the area.
The MultiGAS measurements were conducted during a deflation period with relatively low seismic activity. Here we attempt to compare the gas ratios to the observed deformation, to observed variations in seismic and deformation activity.
4.2.1 Comparison with H2O/CO2, H2O/H2S and X/SO2 MultiGAS
ratios
Distinct periods with peaks in H2O/CO2 and H2O/H2S gas ratios are observed from the
MultiGAS time series. SO2 was detected almost exclusively at the same time as these
detected peaks, allowing for calculations of X/SO2 ratios (Figure 7). The H2O/CO2 and
H2O/H2S MultiGAS peaks appear to occur during crustal movements (micro-seismicity
and ground deformation detected with continuous GPS measurements, Figure 7). The largest seismic events recorded for the period of this study were MW 2.2 (11 July 2013) and
MW 1.5 (26 April 2013). Following these events and throughout the aftershock period (11
July to 7 August and 26 April to 25 May 2013, respectively) the most extensive increase in the H2O/CO2 and H2O/H2S MultiGAS ratios were observed. Similarly, moderate increases
for the same gas ratios were observed during periods of moderately sized peaks of an accumulative seismic moment. Peaks of high H2O/CO2 and H2O/H2S MultiGAS ratios also
seemed to follow periods of ground uplift when associated with the seismic events recorded. No gas peaks were observed during period of subsidence associated with low seismic activity (Figure 7).
The H2O/CO2 and H2O/H2S MultiGAS ratios showed greater variations (1-217 and
9-10,300, respectively) than the ratios in our fumarole samples (H2O/CO2 range 184-269 and
H2O/H2S range 1080-4527). During periods of recorded crustal movements, the H2O/CO2
and H2O/H2S MultiGAS ratios increase, and are closer, or equal to the gas ratios in the
fumarole samples (Table 3).
It is proposed that the great variations in H2O/CO2 and H2O/H2S MultiGAS ratios are
proposed to be related to the intensity of fumarole activity. The fumarole activity is low during periods of low or no recorded seismic events and land subsidence. During these periods low H2O/CO2 and H2O/H2S MultiGAS ratios are obtained due to a significant H2O
condensation (i.e., removal of H2O from the gas phase) before the steam reaches the inlet
ACCEPTED MANUSCRIPT
and H2O/H2S MultiGAS ratios ( 180 and 1000, respectively) are not representative of the
emitted fumarole gas composition.
The fumaroles are interpreted to be more active during periods of recorded crustal movements. During these periods the steam rises faster, because of opening of new pathways and increased boiling by pressure release caused by seismicity. As a result, H2O
is less affected by pre-sampling condensation, which results in higher H2O/CO2 and
H2O/H2S gas ratios measured by the MultiGAS.
4.2.2 Comparison with CO2/H2S MultiGAS ratio
No visual correlation is observed between CO2/H2S ratios obtained by the MultiGAS and
periods of recorded crustal movements (Figure 8). These gas species are significantly less affected by condensation processes than H2O and their detection was less dependent on the
variations in the activity of the fumarole. The CO2/H2S ratios obtained from the MultiGAS
data generally fall within the range of ratios determined in fumarole steam from Krýsuvík. However, the MultiGAS data shows more variability than the fumarole data (this study, Arnórsson, 1987 and data from the Iceland GeoSurvey database). This is considered to be the result of the MultiGAS station running near-continuously for over 7 months, thereby picking out short-timescale variations that may be missed by point sampling. The variations observed in CO2/H2S ratios are therefore believed to be linked to variations in
the degassing behavior of the system.
4.3 Origin of the Krýsuvík gas emissions
The degassing regime in Krýsuvík is shown to be highly variable over short timescales (hours and days) with changes in fumarole activity and fluctuations in gas composition which is linked to variations in seismicity along with ground deformation. The results from the MultiGAS and fumarole samples resemble a typical composition of low temperature (<100°C) fumarole steam (Lee et al., 2005) from a liquid dominated system (Goff and Janik, 2000). The gas composition from this study is in good agreement with results of previous gas measurements in Krýsuvík (e.g., Arnórsson, 1987) and indicates no increased magmatic gas contribution. Gas geothermometers from this study also show no obvious change in sub surface temperature compared to previous studies (Arnórsson and Gunnlaugsson, 1985, Arnórsson, 1987, Yohannes, 2004), indicating a steady heat flow from the heat source over the time period. Therefore, we cannot conclude that the SO2
observed is connected with new magma intruding into the systems’ roots.
SO2 concentrations are not expected to be high in geothermal systems like Krýsuvík, due
to abundant water within the system where hydrolysis reactions change SO2 into H2S,
sulfuric acid (H2SO4) and elemental sulfur (S) (e.g., Ármannsson et al., 1981, 1989,
Ármannsson and Hauksson, 1980, Gíslason et al., 1978, Óskarsson, 1978, 1984). However, the SO2 detected here (0.05-0.5 ppmv) is not considered to be a false signal or interference
from other gas species. This is based on two main reasons: (1) SO2 is observed
independently from high concentrations of H2S and therefore the SO2 measurements are
unlikely to be interference between the H2S and SO2 sensors. (2) The MultiGAS station is
equipped with highly sensitive sensors that are capable of detecting very low concentrations. It is considered possible that small amounts of SO2 may be present in
emissions from Krýsuvík. Magmatic SO2 might be able to ascend rapidly to the surface
ACCEPTED MANUSCRIPT
of the SO2, is near surface oxidation of H2S to SO2 (Arnórsson, 1987), with the formation
of elemental sulfur (S) at the fumarolic vent (Lee et al., 2005). The presence and source of SO2 in Krýsuvík, needs further studying, where different methods are applied.
The results of several studies (e.g., Noguchi and Kamiya 1963, Casadevall et al., 1983, Fischer and Arehart, 1996) have shown changes in the fumarole gas composition prior to and during eruptive events. Studies from the rifting episodes in Krafla, NE-Iceland during 1975-1984 (a volcanic system which bears many similarities to Krýsuvík), revealed changes in local fumarolic gas composition (e.g., Óskarsson, 1984, 1978, Ármannsson et al., 1989, Gíslason et al., 1984). The gas composition was CO2-rich during the first weeks
of rifting and remained unchanged until 1983. The outgassing CO2 was released from the
deep aquifers beneath the area by the interaction of magmatic gas with the hydrothermal system.
A comprehensive record and monitoring in the Krýsuvík region would be a great asset in understanding the gas source and the degassing regime of Krýsuvík. When new magma intrudes into the roots of the Krýsuvík system, the fumarolic gas composition might change in similar way to what was seen at Krafla 1975-1984 (e.g., Óskarsson, 1984, 1978, Ármannsson et al., 1989, Gíslason et al., 1984). The gas composition in Krýsuvík would be expected to become CO2 richer, resulting in lowering of H2O/CO2, and increase in
CO2/H2S MultiGAS- and spot sampling ratios, resulting in greater CO2 gas fluxes through
soil.
Several smaller localities with apparent surface activity (mostly related to the Trölladyngja subarea) were not included in this study. We therefore conclude that the total soil CO2 flux
from the Krýsuvík geothermal system during this study is greater than 101 T/day. Furthermore, the total CO2 soil flux estimated here should be considered as the minimum
value given that the amount of CO2 dissolved in groundwater is unknown.
The total measured soil CO2 flux from the neighboring Reykjanes (~0.4 km2) and Hengill
volcanic systems (168 km2) (using the accumulation chamber method) indicate a total soil CO2 flux of 78.5±13.9 T/day (Óladóttir, 2014) and 1,526 ± 160 T/day of which 453 T/day
of volcanic/hydrothermal origin (Hernández et al., 2012), respectively.
Studies of the volcanic systems along the RP during the last two decades have shown little evidence of magmatic contributions with the possible exception of the Hengill volcano (Hreinsdóttir et al., 2001, Einarsson, 2008, Keiding et al., 2008), where minor magma injection into the roots of the volcano has been suggested to have taken place from 1995 to 1998, triggering an intense seismic swarm (Sigmundsson et al., 1997).
ACCEPTED MANUSCRIPT
5
Conclusions
The gas composition from Krýsuvík geothermal system was studied (April-November 2013) using the MultiGAS method and compared with geophysical observations. The gas composition is H2O dominated with CO2 as the dominant dry gas species, with smaller
concentrations of H2S and trace concentrations of SO2.
The gas emissions (in the form of diffuse soil degassing) were measured in three areas of high geothermal surface activity within the Krýsuvík system (Seltún, Hveradalir and Austurengjar). The total emission is estimated as 101 T/day but this is a minimum value for the total emission, as the amount of CO2 dissolved in groundwater is not known and
several smaller localities with apparent surface activity were not studied.
The time series of gas composition (MultiGAS data) identified short-lived episodes of elevated and highly variable H2O/CO2 and H2O/H2S ratios, the highest H2O/CO2 and
H2O/H2S ratios followed the periods of highest accumulative seismic moment per day 26
April 2013 and 11 July 2013. SO2 was detected at the same time. Comparison with
seismicity and ground deformation shows that the ratio peaks follow increased seismic activity, with the highest H2O/CO2 and H2O/H2S ratios following elevated seismicity and
crustal movements. We propose that these peaks represent periods of elevated fumarolic activity that is responding to the seismicity and land uplift due to opening of new pathways in the crust and increased boiling within the system. During these periods the steam reaches the inlet tube faster and is less affected by pre-sampling H2Ocondensation. The
CO2 and H2S gases are significantly less affected by condensation and the CO2/H2S ratio
does not change according to the same pattern. Most of the CO2/H2S ratios determined fall
within the known range for Krýsuvík fumaroles. However, several markedly higher values are detected, demonstrating more variability in the degassing system than previously known.
It is considered crucial to continue the MultiGAS measurements in the r suv
eothermal due to recent episodes of round uplift and su sidence as ell as future volcanic activity. urin the span of the MultiGAS measurements in 201 the total su sidence in the area as 21 mm.
Acknowledgements
Support for this or as received from the European Community’s Seventh Frame or
ACCEPTED MANUSCRIPT
References
Adelinet, M., Dorbath, C., Ravalec, M, Le., Fortin, J., Guéguen, Y., 2011. Deriving microstructure and fluid state within the Icelandic crust from the inversion of tomography data. Geophy. Res. Lett. 38, L03305
Aiuppa, A., Burton, M., Caltabiano, T., Giudice, G., Guerrieri, S., Liuzzo, M., Muré, F., Salerno., G., 2010. Unusually large magmatic CO2 gas emissions prior to a basaltic
paroxysm. Geophys. Res. Lett. 37, 1-5.
Aiuppa, A., Federico, C., Giudice, G., Giuffrida, G., Guida, R.,Guerrieri, S., Liuzzo, M., Moretti, R., Papale, P., 2009. The 2007 eruption of Stromboli volcano; Insights from real-time measurement of the gas volcanic plume CO2/SO2 ratio. J.Volc.Geoth. Res. 182,
221-230.
Arnórsson, S., 1987. Gas chemistry of the Krísuvík geothermal field, Iceland, with special reference to eveluation of steam condensation in upflow zones. Jökull 37, 30-47.
Arnórsson, S., D´Amore, F., 2000. Geothermometry. In Arnórsson, S., Isotopic and chemical techniques in geothermal exploration, development and use. Vienna, International Atomic Energy Agency, 152-199.
Arnórsson, S., Gunnlaugsson, E., 1985. New gas geothermometers for geothermal exploration-Calibration and application. Geochim. Cosmochim. Acta. 49, 1307-1325.
Arnórsson, S., Fridriksson, Th., Gunnarsson, I., 1998. Gas chemistry of the Krafla geothermal field, Iceland. Water-Rock interaction, Arehart and Hulston, Balkema, Rotterdam.
Arnórsson, S., Gudmundsson, G, Sigurmundsson, S, G., Björnsson, A., Gunnlaugsson, E., Gíslason, G., Jónsson, J., Einarsson, P., Björnsson, S., 1975. Systematic exploration of the Krísuvík high-temperature area, Reykjanes-Peninsula, Iceland. Report, National Energy Authority, Reykjavik, Iceland. OS/JHD 7554, 127 pp.
Ármannsson, H., Hauksson, H., 1980. Krafla, gas composition from fumaroles (in Icelandic). Report OS80027/JHD16, 48 pp.
Ármannsson, H., Benjamínsson, J., Jeffrey, A. W. A., 1989. Gas changes in the Krafla geothermal system, Iceland. Chem. Geol. 76, 175-196.
Ármannsson, H., Gíslason, G., Hauksson, T., 1981. Magmatic gases in well fluids aid the mapping of the flow pattern in a geothermal system. Geochim. Cosmochim. Acta. 46, 167-177.
ACCEPTED MANUSCRIPT
Cardellini, C., Chiodini, G., Frondini, F., 2003. Application of stochastic simulation to CO2
flux from soil: Mapping and quantification of gas release. J. Geophys. Res 108, B9.
Casadevall, T, J., Rose, W., Gerlach, T., Greenland, L, P., Ewert, J., Wunderman, R., Symonds, R., 1983. Gas emissions and eruptions. Mount St. Helens through 1982. Science 221, 1383-1385.
Chiodini, G., Vandemeulebrouck, J., Caliro, S., D´Auria, L., De Martino, P., Mangiacapra, A., Petrillo, Z., 2015. Evidence of thermal-driven processes triggering the 2005-2014 unrest at Campi Flegrei caldera. Earth Planet. Sc. Lett. 414, 58-67.
Chiodini, G., Caliro, S., Martino, P, De., Avino, R., Gherardi, F., 2012. Early signals of new volcanic unrest at Campi Flegrei caldera? Insights from geochemical data and physical simulations. Geology 40, 943-946.
Chiodini, G., Frondini, F., Cardellini, C., Granieri, D., Marini, L., Venura, G., 2001. CO2
degassing and energy release at Solfatara volcano, Campi Flegrei, Italy. J. Geophys. Res 106, 16,213-16,221.
Chiodini, G., Cioni, R., Guidi, R., Raco, B., Marini, L., 1998. Soil CO2 flux measurements
in volcanic and geothermal areas. Appl. Geochem. 13, 543-552
Clifton, A. E., Katterhorn, S. A., 2006. Structucal architecture of a highly olique divergent plate boundary segment. Tectonophysics 419, 27-40.
Deutsch, C.V., Journel, A.G., 1998. GSLIB: Geostatistical Software Library and Users Guide. Oxford University Press, New York.
Didana, Y, L., 2010. Multidimensional Inversion of MT data from Krýsuvík high temperature geothermal field, SW-Iceland, and a study of how 1D and 2D inversion can reproduce a given 2D/3D resistivity structure using synthetic MT data. Unpublished MS thesis, University of Iceland, Reykjavik, 119 pp.
Di Napoli, R., Aiuppa, A., Bergsson, B., Ilyinskaya., E., Pfeffer, M, A., Guðjónsdóttir, S, R., Valenza, M., 2016. Reaction path models of magmatic gas scrubbing. Chemical Geology 420, 251-269.
Einarsson, P., 2008. Plate boundaries, rifts and transforms in Iceland. Jökull 58, 35-58.
Elefsen, S, Ó., 13 February 2018. Personal interview. Mannvit.
Fischer, T, P., Arehart, G, B., 1996. The relationship between fumarole gas composition and eruptive acivity at Galeras volcano. Geology 24, 531.
Fridriksson, Th., Kristjánsson, B. R., Ármannsson, H., Margrétardóttir, E., Ólafsdóttir, S., Chiodini, G., 2006. CO2 emission and heat flow through soil, fumaroles, and steam heated
ACCEPTED MANUSCRIPT
Gíslason, G., Ármannsson, H., Hauksson, T., 1978. Krafla, Temperature conditions and gas species within the geothermal system (in Icelandic). Orkustofnun Report OSJHD-7846, 45 pp.
Gíslason, G., Johnsen, G, V., Ármannsson, H., Torfason, H., Árnason, K., 1984. Surface explorations in the Theistareykir high-temperature area (in Icelandic). Orkustofnun Report OS-84089/JHD-16, 138 pp.
Goff, F., Janik, C, J., 2000. Geothermal systems. In Sigurdsson, H (editor in chief)., Houghton, B., McNutt, S, R., Rymer, H., Stix, J., 2000. Encyclopedia of Volcanoes. San Diego, California: Academic Press, 817-834.
Gudmundsson, G., Arnórsson, S., Sigurmundsson, S, G., Björnsson, A., Gunnlaugsson, E., Gíslason, G., Jónsson, J., Einarsson, P., Björnsson, S., 1975. The Krýsuvík area, report on geothermal observations (in Icelandic). Report OSJHD 7554, November 1975, 71 pp.
Gutenberg, B., Richter, C.F., 1944. Frequency of earthquakes in California. Bull. Seismol. Soc. Am. 34, 185–188.
Hanks, T. and Kanamori, H.,1979. A moment magnitude scale, J. Geophys. Res, 84, No. B5, 2348-2350.
Hernández, P, A., Pérez, N, M., Fridriksson, Th., Egbert, J., Ilyinskaya, E., Thórhallsson, A., Ívarsson, G., Gíslason, G., Gunnarsson, I., Jónsson, B., Padrón, E., Melián, G., Mori, T., Notsu, K., 2012. Diffuse volcanic degassing and thermal energy release from Hengill volcanic system, Iceland. Bull Volcanol, 74, 2435-2448.
Hersir, G., Árnason, K., Vilhjálmsson, A., 2013. 3D inversion of Magnetotelluric (MT) resistivity data from Krýsuvík high temperature geothermal area in SW Iceland. PROCEEDINGS, Thirty-eighth workshop on Geothermal Reservoir Engineering, Stanford University, Stanford, California, February 11-13, 2013. SGP-TR-198. 14 pp.
Hreinsdóttir, S., Einarsson, P., Sigmundsson, F., 2001. Crustal deformation at the oblique spreading Reykjanes Peninsula, SW Iceland: GPS measurements from 1993 to 1998. J. Geophys. Res. 106, 13803-13816.
Icelandic Meteorological Office., 2018. Icelandic Metorological Office Database, case #2018-02-07/01.
Ilyinskaya, E., Aiuppa, A., Bergson, B., Di Napoli, R., Fridriksson, T., Óladottir, A. A., Óskarsson, F., Grassa, F., Pfeffer, M., Lechner, K., Yeo, R., Giudice, G., 2015. Degassing regime of Hekla volcano 2012-2013. Geochim. Cosmochim. Acta. 159, 80-99.
ACCEPTED MANUSCRIPT
Jónsson, J., 1978. Geological map of the Reykjanes peninsula (In Icelandic). Orkustofnun Report OS JHD 7831, 347 pp. + maps.
Keiding, M., Árnadóttir, T., Sturkell, E., Geirsson, H., Lund, B., 2008. Strain accumulation along an oblique plate boundary: the Reykjanes Peninsula, southwest Iceland. Gephys. J. Int. 172, 861-872.
Keiding, M., Lund, B., Árnadóttir, T., 2009. Earthquakes, stress, and strain along an obliquely divergent plate boundary: Reykjanes Peninsula, southwest Iceland. J.Geophys. Res. 114, 1978-2012.
Klein, F. W., Einarsson, P., Wyss, M., 1977. The Reykjanes Peninsula, Iceland earthquake swarm of September 1972 and its tectonic significance. J. Geophys. Res. 82, 865-888.
Kristjánsdóttir, S., 2013. Microseismicity in Krýsuvík Geothermal Field, SW Iceland, from May to October 2009. Unpublished MS-thesis, University of Iceland, Reykjavik, 50 pp.
Lee, H. F., Yang, T. F., Lan, T. F., Song, S. R., Tsao, S., 2005. Fumarolic Gas Composition of the Tatun Volcano Group, Northern Taiwan. TAO 16, 843-864.
Markússon, S., Stefánsson, A., 2011. Geothermal surface alteration of basalts, Krýsuvík Iceland-Aleteration mineralogy, water chemistry and the effects of acid supply on the alteration process. J.Volc. Geoth. Res. 206, 46-59.
Michalczewska, K., Hreinsdottir, S., Arnadottir, T., Hjaltadottir, S., Agustsdottir, T., Gudmundsson, M,T., Geirsson, H., Sigmundsson, F., Gudmundsson, G., 2012. Inflation and deflation episodes in the Krisuvik volcanic system, Abstract V33A-2843, Am. Geophys. Un. Fall meeting, San Francisco, December 2012. Available on: http://fallmeeting.agu.org/2012/eposters/eposter/v33a-2843/. 1 pp.
Noguchi, K., Kamiya, H., 1963. Prediction of volcanic eruption by measuring the chemical composition and amounts of gases. Bull.Volcanol. 26, 367-378.
Óladóttir, A, A., 2012. Application of soil measurements and remote sensing for monitoring changes in geothermal surface activity in the Reykjanes field, Iceland. Unpublished MS thesis, University of Iceland, Reykjavik, 110 pp.
Óladóttir, A, A., 2014. The observations on CO2 flux through soil and soil temperature in
the Reykjanes geothermal area in 2012 and 2013. Report, ÍSOR-2014/024. 27 pp.
Óskarsson, N. 1978. Effect of magmatic activity on fumarole gas composition in the Námafjall-Krafla volcanic center, N-Iceland. NVI Research Report 7803.
Óskarsson, N., 1984. Monitoring of fumarole discharge during the 1975-1982 rifting in Krafla volcanic center, north Iceland. J. Volc. Geoth. Res. 22, 97-121.
ACCEPTED MANUSCRIPT
Saemundsson, K., Jóhannesson, H., Hjartarson, Á., Kristinsson, S, G., Sigurgeirsson, M, Á., 2010. Geological Map of Southwest Iceland. 1:100000. Reykjavík: Iceland GeoSurvey.
Saemundsson, K., Sigurgeirsson, M, Á., 2013. The Reykjanes Peninsula. In Sólnes, J (editor in chief), Sigmundsson, F., Bessason, B., 2013. Natural hazards in Iceland, volcanic eruptions and earthquakes (in Icelandic). Reykjavík, Viðlagatrygging Íslands/Háskólaútgáfan, 379-403.
Schorlemmer, D., Weimer, S., Wyss, M., 2005. Variations in earthquake size distribution across different stress regimies. Nature 437, 539-542.
Sigmundsson, F., Einarsson, P., Rögnvaldsson, Th., Foulger, G., Hodkinson, Kþ. Thorbergsson, G., 1997. The 1994-1995 seismicity and deformation at the Hengill triple junction, Iceland: Triggering of earthquakes by an inflating magma chamber in a zone of horizontal shear stress. J. Geophys. Res. 102, 15151-15161.
Tamburello, G., 2015. Ratiocalc: Software for processing data from multicomponent volcanic gas analyzers. Computer and Geosciences 82, 63-67.
Toutain, J, P., Baubron, J, C., 1999. Gas geochemistry and seismotectonics: a review. Tectonophysics 304, 1-27.
Ward, P. L., Björnsson, S., 1971. Microearthquakes, swarms, and the geothermal areas of Iceland. J. Geophys. Res. 76, 3953-3982.
Watson, I. M., Oppenheimer, C., Voight, B., Francis, P. W., Clarke, A., Stix, J., Miller, A., Pyle, D. M., Burton, M. R., Young, S. R., Norton, G., Loughlin, S., Darroux, B., MVO staff., 2000. The relationship between degassing and ground deformation at Soufriere Hills Volcano, Montserrat. J. Volc. Geoth. Res. 98, 117-126.
Wyss, M., 1973. Towards a physical understanding of the earthquake frequency distribution, Geophys. J. Int., 31, 341–359.
Yohannes B., E., 2004. Geochemical interpretation of thermal water and gas samples from Krýsuvík, Iceland and Alid, Eritrea. In L.S. Georgsson, Editor. Geothermal Training in Iceland 2004. UNU Geothermal Training Programme Report 18, 403-438.
Young, S. R., Francis, P. W., Barclay, J., Casadeva, T. J., Gardner, C. A.,Darroux, B., Davies, M. A., Delmelle, P., Norton, G. E., Maciejewski, A. J. H., Oppenheimer, C. M. M., Stix, J., Watson, I. M., 1998. Monitoring SO2 emission at the Soufriere Hills volcano:
ACCEPTED MANUSCRIPT
Figure 1 Volcanic systems on the RP (purple) and seismic zone across the Peninsula that marks the axis of
the plate boundary (brown) (Einarsson, 2008). High-temperature geothermal areas within the volcanic systems (striped). Modified from (Sæmundsson and Sigurgeirsson, 2013). The five volcanic systems are arranged en echelon along the peninsula, spaced approximately 5 km apart (Clifton and Katterhorn, 2006). Continuous GPS stations in operation in 2013 on the RP including the region of the earthquake data (dashed box), and the center of uplift (orange circle). Blue and dark red dots show the location of Festafjall and Keflavík airport weather stations, respectively.
Figure 2 Outlines of the Krýsuvík high-temperature geothermal system identified by resistivity surveys
(orange line) (Gudmundson et al., 1975). Krýsuvík sub-areas and the two hyaloclastite ridges, Sveifluháls and Vesturháls, with which the geothermal activity in Krýsuvík is mostly associated. The green dot shows the location of the MultiGAS station, and the purple dots show the location of the fumarole samples collected.
Figure 3 MultiGAS station in Krýsuvík. The station is located next to a fumarole in an area of continuous
geothermal activity in Hveradalir, Krýsuvík, and is powered by a wind turbine. The sampling inlet of the MultiGAS station is located ~20 cm above the ground to avoid saturation of the CO2 sensor.
Figure 4 The local inflation/deflation periods from GPS time series (2007-2016) at station MOHA, along
with daily cumulative seismic moment. The red band corresponds to the time period of this study.
Figure 5 (Upper) CO2/H2S and H2O/CO2 molar ratios as a function of precipitation (mm/day). The CO2/H2S
ratios are obtained predominantly during periods with <2 mm/day rainfall. However, high ratio values are not confined to the dry periods. All H2O/CO2 ratios >19 are obtained during dry periods (< 2mm/day). The most
frequently obtained values for H2O/CO2 (<19) are visually evenly distubuted between ~ 0-5 mm/day.
(Lower) CO2/H2S and H2O/CO2 molar ratio as a function of wind speed (m/s). The highest ratios of CO2/H2S
(>75) and largest variations are obtained during relatively low wind speed (approximately <5 m/s). Lower values of CO2/H2S (<20) are detected more frequently than the higher values and there is no visible relation
to wind speed <10 m/s where marked decrease is seen in the frequency of ratios obtained. Wind speed <10 m/s does not appear to affect detection of H2O/X molar ratios (X = CO2, H2S and SO2) in >10 m/s markedly
fewer ratios are detected.
Figure 6 The results of soil CO2 flux measurements from the three observation areas, Hveradalir, Seltún, and
Austurengjar. The highest flux was observed in Hveradalir, 70.9 T/day. In Seltún the flux was found to be 19.6 T/day and the lowest flux was calculated in Austurengjar, 10.9 T/day. The total flux from the three measured areas was calculated as 101 T/day.
Figure 7 Normalized variations in gas composition as measured by the MultiGAS station (measurements
affected by metrological conditions have been eliminated) correlated with geophysical observations. There are distinct intervals with peaks of increased H2O/CO2 and H2O/H2S ratios (upper figure). SO2 is detected
ACCEPTED MANUSCRIPT
moment (Nm). Black line: seismic moment per day (Nm/day). Blue curve: Vertical crustal movements measured with GPS (mm). Light grey intervals: rainy days (>2 mm/day). Dark grey interval: station not operating. Peaks of increased H2O/CO2 and H2O/H2S ratios appear to follow episodes of recorded seismic
events and crustal deformation.
Figure 8 Time series (April-November 2013) of CO2/H2S MultiGAS molar ratios (where measurements
effected by metrological conditions have been eliminated) compared with crustal movements. The CO2/H2S
ratio does not show any visible variations related to seismicity or crustal deformation. The yellow band corresponds to CO2/H2S ratios (3-41) from fumaroles in the Krýsuvík area (this study, Arnórsson, 1987, data
[image:20.595.134.452.205.647.2]ACCEPTED MANUSCRIPT
Table 1 Vol% concentration of selected gases in fumarolic steam from the 8 samples. Values within () for
CO2 and H2S refer to % of total gas volume.
Sample Date H2O% CO2% H2S% H2% Ar% O2% N2% CH4%
Seltún 1 18.02.2014 96.9 75.5 (2.3) 13.9 (0.430) 9.32 0.02 0.15 1.03 0.08
Seltún 2 23.04.2014 99.4 79.6 (0.48) 15.3 (0.092) 4.80 - - 0.32 0.02
Hverahvammur 1 18.02.2014 99.5 88.9 (0.44) 8.69 (0.043) 2.02 - - 0.40 -
Hverahvammur 2 23.04.2014 99.4 89.3 (0.54) 9.26 (0.056) 0.97 - - 0.49 -
Austurengjar 1 18.02.2014 99.4 89.3 (0.54) 3.80 (0.023) 6.13 - - 0.67 0.10
Austurengjar 2 23.04.2014 99.5 81.5 (0.41) 12.9 (0.065) 5.36 - - 0.19 0.06
Hverahöfði 1 18.02.2014 99.4 73.4 (0.44) 4.00 (0.024) 19.7 0.04 - 2.65 0.22
[image:21.595.101.566.125.721.2]ACCEPTED MANUSCRIPT
Table 2 Variations of molar gas ratios measured by the MultiGAS station in Hveradalir, Krýsuvík (excluding
data affected by meterological factors).
Max Min Average Median
H2O/CO2 217 1 27 9
H2O/H2S 10300 9 640 218
H2O/SO2 107000 2380 26900 25100
CO2/H2S 107 4 17 12
CO2/SO2 3010 58 767 662
ACCEPTED MANUSCRIPT
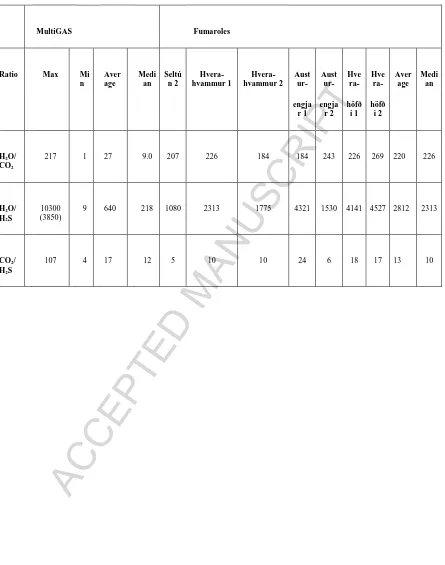
Table 3 The calculated molar ratios of H2O/CO2, H2O/H2S and CO2/H2S for the fumarole samples and from
the MultiGAS data. Sample Seltún 1 is excluded from the average calculations due to condensation in the sampling train. The maximum H2O/H2S values in the MultiGAS data (10300) is by far the highest value, the
second highest value (3850) is, much closer to the average value for the fumarole samples.
MultiGAS Fumaroles
Ratio Max Mi
n Aver age Medi an Seltú n 2 Hvera-hvammur 1 Hvera-hvammur 2 Aust ur- engja r 1 Aust ur- engja r 2 Hve ra- höfð i 1 Hve ra- höfð i 2 Aver age Medi an H2O/ CO2
217 1 27 9.0 207 226 184 184 243 226 269 220 226
H2O/ H2S
10300 (3850)
9 640 218 1080 2313 1775 4321 1530 4141 4527 2812 2313
CO2/ H2S
ACCEPTED MANUSCRIPT
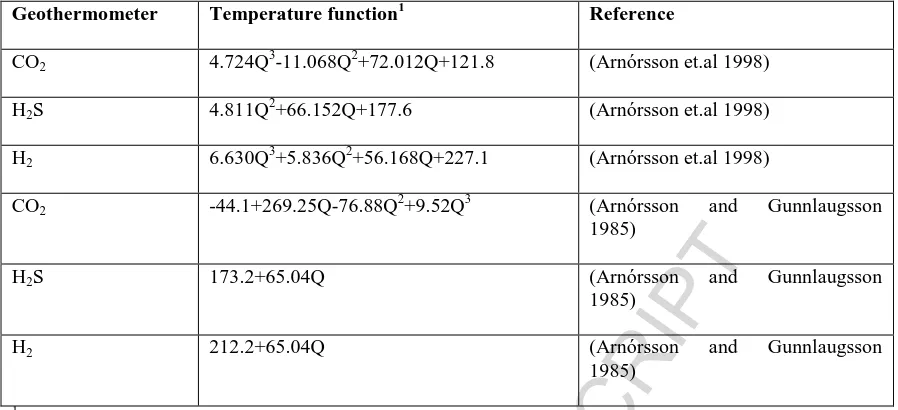
Table 4 Gas geothermometers applied to Krýsuvík fumarole samples.
Geothermometer Temperature function1 Reference
CO2 4.724Q 3
-11.068Q2+72.012Q+121.8 (Arnórsson et.al 1998)
H2S 4.811Q 2
+66.152Q+177.6 (Arnórsson et.al 1998)
H2 6.630Q
3
+5.836Q2+56.168Q+227.1 (Arnórsson et.al 1998)
CO2 -44.1+269.25Q-76.88Q 2
+9.52Q3 (Arnórsson and Gunnlaugsson 1985)
H2S 173.2+65.04Q (Arnórsson and Gunnlaugsson
1985)
H2 212.2+65.04Q (Arnórsson and Gunnlaugsson
1985)
ACCEPTED MANUSCRIPT
Table 5 The results from the gas geothermometers applied. The temperature value are in °C.
Sample nr.
1CO
2 1H2S 1H2 2CO2 2H2S 2H2 Average
Hverahvammur 1 1 292 276 274 288 261 259 275 Hverahvammur 2 2 303 268 256 295 270 243 272 Austurengi 1 3 301 255 323 294 244 295 285 Austurengi 2 4 289 290 309 286 273 286 289 Hverahöfði 1 5 292 257 281 288 245 266 271 Hverahöfði 2 6 292 259 244 288 247 231 260 Seltún 2 7 297 304 313 291 284 289 296
1
ACCEPTED MANUSCRIPT
Highlights
The gas emissions from the Krýsuvík system are H2O-dominated, with CO2 as the
most abundant dry gas species, followed by smaller concentrations of H2S.
Gasgeothermomerters indicate subsurface temperature of 278°C.
The degassing regime in Krýsuvík is highly variable over short timescales (hours and days) with changes in fumarole activity and fluctuations in gas composition which is linked to variations in seismicity and ground deformation.
The diffuse soil CO2 flux is variable between the three studied degassing areas in