This is a repository copy of
Month of birth and child height in 40 countries
.
White Rose Research Online URL for this paper:
http://eprints.whiterose.ac.uk/124244/
Version: Accepted Version
Article:
Agarwal, N, Aiyar, A, Bhattacharjee, A orcid.org/0000-0002-0157-1476 et al. (5 more
authors) (2017) Month of birth and child height in 40 countries. Economics Letters, 157.
pp. 10-13. ISSN 0165-1765
https://doi.org/10.1016/j.econlet.2017.05.006
(c) 2017, Elsevier B.V. This manuscript version is made available under the CC BY-NC-ND
4.0 license https://creativecommons.org/licenses/by-nc-nd/4.0/
eprints@whiterose.ac.uk https://eprints.whiterose.ac.uk/ Reuse
This article is distributed under the terms of the Creative Commons Attribution-NonCommercial-NoDerivs (CC BY-NC-ND) licence. This licence only allows you to download this work and share it with others as long as you credit the authors, but you can’t change the article in any way or use it commercially. More
information and the full terms of the licence here: https://creativecommons.org/licenses/
Takedown
If you consider content in White Rose Research Online to be in breach of UK law, please notify us by
Month of Birth and Child Height in 40 Countries
Neha Agarwal, Anaka Aiyar, Arpita Bhattacharjee, Joseph Cummins
∗,
Christian Gunadi, Deepak Singhania, Matthew Taylor and Evan Wigton-Jones
March 1, 2017
Abstract
Lokshin and Radyakin(2012) present evidence that month of birth affects child physical growth in India. We replicate these correlations using the same data and demonstrate that they are the result of spurious correlations between month of birth, age-at-measurement and child growth patterns in developing countries. We repeat the analysis on 39 additional countries and show that there is no evidence of seasonal birth effects in child height-for-age z-score in any country. Furthermore, we demonstrate that the Demographic and Health Survey data used to estimate the correlation is not suitable for the task due to a previously unrecognized source of measurement error in child month of birth. We document results from several papers that should be re-interpreted in light of this issue. Keywords: child health; month of birth; anthropometrics; Demographic & Health Survey
JEL Codes: I15; J13; O15
1
Introduction
It is an odd fact about the world that month of birth correlates strongly with an incredible number of
human health and development measures. A recent paper in the Journal of Human Resources (Lokshin
and Radyakin,2012, henceforth L&R) argues that month of birth affects child physical growth in India.
Children born at different times of the year are exposed at different points in their developmental
tra-jectory to the deteriorated health environment brought on each year by the monsoon rains. Thus, they
argue, the appearance of correlations between month of birth and height-for-age z-score (HAZ) can be
interpreted as evidence of the importance of the timing of inputs in the health production function.
While there is a long tradition across the social and biological sciences of finding robust effects of
birth season on human development, there is also a history of data artifacts or selection effects being
misinterpreted as effects of birth season (Lewis,1989;Strand et al.,2011;Buckles and Hungerman,2008;
Cummins, 2013). We argue that the apparent seasonal effect documented by L&R is less likely due
to exposure to any monsoon-related disease environment, and more likely a lack of exposure to survey
enumerators in the period after the monsoon rains. The uneven measurement timing across the survey
year, typical for Demographic and Health Survey (DHS) data collection, induces differential mean age
at measurement across birth month in the sampled children. This systematic age difference is then
translated into a difference in HAZ due to the shape of the HAZ-age profile. After correcting for the
spurious correlation between month of birth and age at measurement, our analysis produces no evidence
of month of birth effects on child growth using the Indian DHS data.
The problem of survey timing above can be corrected econometrically. However, we provide new
evidence from 39 additional countries that the DHS data are not suitable for the task of estimating the
effects of birth month on child health. In DHS data from almost every country, children born in December
have abnormally high or the highest relative HAZ and children born in January have abnormally low
or the lowest relative HAZ. The effect is visible prior to correction for the survey-timing problem, but
midnight on December 31 averages out to between a 0.2 and 0.3 standard deviations (sd). Either the
Gregorian calendar is more intimately based in human biology than has been previously documented (or
even considered plausible), or there is significant measurement error in child month of birth across the
broad family of DHS datasets. The DHS itself has reported such a problem (Assaf et al., 2015), but no
previous work has noted the connection to HAZ and month of birth.
We identify 5 additional papers that report correlations between measures of child health and seasonal
exposures based on analysis of data from the DHS (Brainerd and Menon, 2014; Dorlien, 2015; Mulmi
et al., 2016;Darrouzet-Nardi and Masters, 2015; Tiwari and Jacoby, 2013). We discuss the state of the
literature in light of our findings in section 6.
2
Background
Following L&R, we use data from the 1992/1993, 1998/1999, and 2005/2006 waves of the National
Family Health Survey (the Indian DHS). Sample summary statistics from the first round can be found
inTable A1. While there are measurements from most rounds in most months, there are decidedly fewer
measurements taken in late summer as compared to other months (seeFigure 2). This coincides roughly
with the period after the monsoon rains. The effect on the sample is that, on average, children born
in summer before and during the monsoons were measured at older ages than children born in the dry,
monsoon-less winter. This imbalance in age at measure across birth month induces the appearance of
seasonality in HAZ via the HAZ-age profile.
The HAZ-age profile from our sample in India is shown in the bottom panel of Figure 1, graphing
mean HAZ across age-at-measure (in months). Similar to children in many developing countries, Indian
children grow more slowly than the healthy, well-nourished children in the reference population. The
cumulative effects of insufficient nutrition and poor health environment lead to children falling further
While L&R estimate birth season effects on a number of anthropometric measures, we focus exclusively
on HAZ. HAZ is a cumulative measure of early life health and nutrition, making it possible for the measure
to reflect month of birth effects that occurred months or years in the past. Weight-for-age and
weight-for-height z-scores fluxuate in the short term and thus contain information on both recent and past health
inputs.
The effect of survey timing by birth month is shown in the bottom panel ofFigure 2, which isolates
survey measurements taken in March and September separately. The bar graphs reflect the effects of
survey timing directly, showing mean age-at-measure and mean-HAZ (Y-axis) for children born in each
month (X-axis). For the measurements taken in March, we see a minimum child age in January and
February, which increases through April, and the opposite pattern for September measurements. The
line graphs then show this age-at-measure effect being translated into an HAZ effect via the HAZ-age
profile. The two measure months generate opposite seasonal patterns in HAZ because the entirety of the
sinusoidal effect is caused by differential age at measurement across birth month. Both line graphs also
hint at an unexpected upward trend in HAZ across birth month, and we return to this in section 5.
3
Econometric Problem
Consider the following regression equation, similar to that employed by L&R:
HAZiam=αi+δm∗M OBm+Xiam′ βX+f(age) +ǫiam (1)
WhereHAZiam is the HAZ score of childi, ageda, and born in month m. X is a vector of controls
that account for maternal, household, and community characteristics. M OBm is an indicator variable
for a child’s month of birth. f(age) is an unknown function of age representing the “natural” HAZ-age
profile for the country. Sincef(age)is unknown, we assume the researcher specifies a parametric function
their regressions. Following the modeling suggestions inCummins(2013), we show that the appearance
of seasonality vanishes as we employ increasingly flexible polynomial and non-parametric specifications
of g(age;γ) and thus minimize the bias.
4
Replication
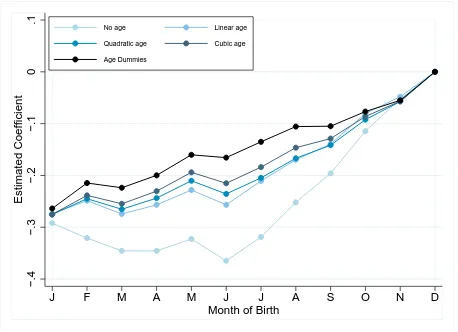
Figure 3 displays the coefficient estimates for month-of-birth effects for five specifications of EQ. 1,
each of which differs only in how age is modeled. The na¨ıve estimates (bottom line, light blue) do not
control for age in any way, and there appears to be a sinusoidal, seasonal relationship in the
month-of-birth coefficients. Children born in summer have the lowest HAZ, and then HAZ improves for each month-of-birth
month from July through December. This is the underlying effect that L&R interpret as evidence of the
negative effects of being born during or after the monsoon rains.
Controlling for age linearly (as do L&R) greatly reduces the sinusoidal nature of the estimates, but
the relationship remains indicative of potential birth season effects. The three final specifications are
increasingly flexible in age, allowing a quadratic, cubic, and finally a completely flexible form employing
age-in-month dummy variables. The apparent seasonality is continually reduced by adding flexibility,
with the polynomial and dummy variable specifications effectively eliminating any trace of a sinusoidal
pattern across the year.
We find no evidence of month-of-birth effects in India in the sample examined by L&R. Instead, we
see what appears to be an upward “trend” from January to December. To call it a “trend”, though,
overlooks the sharp discontinuity that occurs when December again gives way to January, implying (if
interpreted literally) that the change in the Gregorian calendar date affects child HAZ by an amount
greater than the difference in India between having an illiterate mother and a mother with 6 years of
5
Extensions
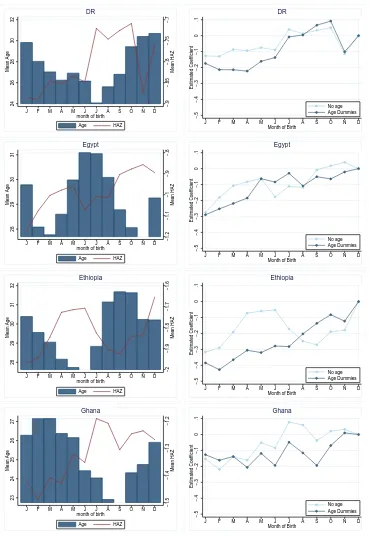
We now repeat the preceding analysis on a set of 39 additional countries with similar DHS data, and
the results are similar to those from India. A number of countries (though not all) exhibit a sinusoidal
pattern in HAZ across month of birth, but this is largely driven by differences in the distribution of child
age at measurement across birth months. This can be seen in the left panel of each of the country specific
figures presented inFigure A2that show age at measurement and mean HAZ by birth month (similar to
the bottom panel ofFigure 2).
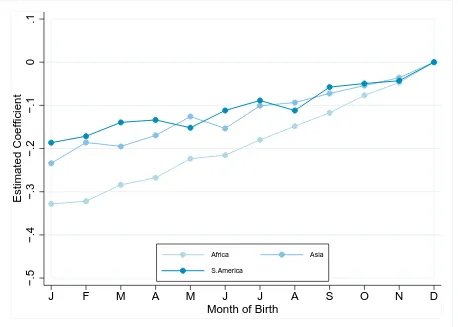
A more surprising empirical regularity uncovered in our analysis is presented inFigure 4. We aggregate
all 40 countries into three geographic regions – Africa, Asia, and Latin America – and estimate
month-of-birth effects for each region. The results are striking: a near perfect linear increase in HAZ across month-of-birth
month, followed by (one would assume) a large fall between December and the following January. This
same upward “trend” from January to December is also visible in many of the individual countries (see
the right panel ofFigure A2).
It is implausible that this upward trend reflects real month of birth effects. First, within a given country
and age group, December and January born children experience quite similar in utero environments,
making this discontinuity questionable from a social-environmental-biological standpoint. Second, the
makeup of our sample spans a broad range of cultures, geographies, climates, and economies, making the
persistence of this similar trend, were it some real effect in the world, an effect of an arbitrary cut-off from
year to year set by the Gregorian calendar 500 years ago. Instead, the effect must be due to measurement
error in child birth.
6
Affected Literature
The seasonal effects papers we discuss in this section employ one of two analytic frameworks: 1)
estimating the effects of month of birth directly; 2) estimating group differences in seasonal exposures
Category 1 analyses were the main focus of the discussion above. These analyses suffer from both
the timing artifact bias described in Cummins (2013) and from systematic measurement error of age
across birth month discussed in the preceding section. The month of birth estimates in L&R should
be considered proven spurious. Similarly, the discussion of seasonal stunting patterns inDorlien (2015)
appears to misinterpret its results .
The analyses in category 2 rely on comparing changes in seasonal patterns across groups and/or time
to identify the effect of interest, which is not month of birth directly but instead some exposure in the
world that is changing with month of birth. In other parts of l&R and inTiwari and Jacoby(2013), the
timing of monsoon onset lets the authors claim to differentiate abstract month of birth effects from the
health environment changes induced by the rains and/or income effects from the agricultural production
cycle. InDarrouzet-Nardi and Masters(2015), seasonal differences across the equator and between rural
and urban households identify the effect of market access on consumption smoothing. InBrainerd and
Menon (2014), the authors rely on differential intensity in seasonal rain across cohorts and regions to
generate within-birth-month exposures to toxic runoff in India. A key, but often unmentioned, identifying
assumption in these models is the equality of measurement error in child birth date across treatment
groups.
7
Conclusion
We have demonstrated two problems in the analysis of seasonal birth patterns using DHS HAZ data.
First, we have shown that survey timing is the main determinant of the appearance of month of birth
effects in DHS data across 40 countries. Second, we have shown that any attempt to directly estimate true
season of birth effects on HAZ using DHS data is inherently impossible; the child birthdate data is not of
sufficient quality to make such an analysis possible. We hope that our efforts will focus attention on the
need for improved measurement in child birth date when conducting large-scale health and demographic
References
Assaf, S., Kothari, M., and Pullum, T. (2015). Dhs methodological reports 16.
Brainerd, E. and Menon, N. (2014). Seasonal effects of water quality: The hidden costs of the Green
Revolution to infant and child health in India. Journal of Development Economics, 107:49–64.
Buckles, K. S. and Hungerman, D. M. (2008). Season of birth and later outcomes: Old questions, new
answers. Review of Economics and Statistics, (0).
Cummins, J. (2013). On the use and misuse of child height-for-age Z-score in the Demographic and
Health Surveys.
Darrouzet-Nardi, A. and Masters, W. (2015). Does Market Access Protect Children against Poor Health
Conditions at Birth? The FASEB Journal, 29(1 Supplement):898.22.
Dorlien, A. M. (2015). Effects of Birth Month on Child Health and Survival in Sub-Saharan Africa.
Biodemography and social biology, 61(2):209–230.
Lewis, M. S. (1989). Age incidence and schizophrenia: Part i. the season of birth controversy.
Schizophre-nia Bulletin, 15(1):59–73.
Lokshin, M. and Radyakin, S. (2012). Month of Birth and Childrens Health in India. Journal of Human
Resources, 47(1):174–203.
Mulmi, P., Block, S. A., Shively, G. E., and Masters, W. A. (2016). Climatic conditions and child height:
Sex-specific vulnerability and the protective effects of sanitation and food markets in Nepal.Economics
& Human Biology, 23:63–75.
Strand, L. B., Barnett, A. G., and Tong, S. (2011). Methodological challenges when estimating the effects
of season and seasonal exposures on birth outcomes. BMC medical research methodology, 11(1):1.
Tiwari, S. and Jacoby, H. G. (2013). Monsoon babies: rainfall shocks and child nutrition in nepal. World
Results
−3
−2.5
−2
−1.5
−1
−.5
0
HAZ
0 20 40 60
Age in Months
IDHS−1 IDHS−2 IDHS−3
India
−3
−2.5
−2
−1.5
−1
−.5
0
HAZ
0 20 40 60
Age in Months
Africa Asia
[image:10.612.102.513.109.710.2]S. America
Regions
0
2000
4000
6000
8000
Count
J F M A M J J A S O N D
month of interview
DHS−1 DHS−2
DHS−3
Number of Measurements by Survey Month
−2.5
−2
−1.5
−1
Mean HAZ
0
5
10
15
20
25
30
35
Mean Age
J F M A M J J A S O N D
month of birth
Age (March Interview) Age (September Interview) HAZ (March Interview) HAZ (September Interview)
[image:11.612.100.513.77.694.2]Mean HAZ and Age at Measure
−.4
−.3
−.2
−.1
0
.1
Estimated Coefficient
J
F
M
A
M
J
J
A
S
O
N
D
Month of Birth
No age Linear age
Quadratic age Cubic age
[image:12.612.82.536.76.410.2]Age Dummies
−.5
−.4
−.3
−.2
−.1
0
.1
Estimated Coefficient
J
F
M
A
M
J
J
A
S
O
N
D
Month of Birth
Africa Asia
[image:13.612.80.538.79.406.2]S.America
8
Appendix
Table A1: Summary statistics (India DHS)
Mean Std.Deviation Household size 7.26 3.41
Mother age in years 26.32 5.45
Mother education in years 4.48 5.77
Working Mother 0.28 0.45
Male child 0.52 0.50
Child age in months 24.72 15.36
Birth Order 2.74 1.86
Rural 0.68 0.47
−.4
−.3
−.2
−.1
0
.1
Estimated Coefficient
J
F
M
A
M
J
J
A
S
O
N
D
Month of Birth
No age Linear age
Quadratic age Cubic age
[image:15.612.79.537.78.410.2]Age Dummies
−.9 −.8 −.7 −.6 Mean HAZ 26 28 30 32 34 Mean Age
J F M A M J J A S O N D month of birth
Age HAZ Armenia −.5 −.4 −.3 −.2 −.1 0 .1 Estimated Coefficient
J F M A M J J A S O N D Month of Birth
No age Age Dummies Armenia −2 −1.95 −1.9 −1.85 −1.8 Mean HAZ 28 29 30 31 Mean Age
J F M A M J J A S O N D month of birth
Age HAZ Bangladesh −.5 −.4 −.3 −.2 −.1 0 .1 Estimated Coefficient
J F M A M J J A S O N D Month of Birth
No age Age Dummies Bangladesh −1.8 −1.7 −1.6 −1.5 −1.4 Mean HAZ 25 26 27 28 29 Mean Age
J F M A M J J A S O N D month of birth
Age HAZ Benin −.5 −.4 −.3 −.2 −.1 0 .1 Estimated Coefficient
J F M A M J J A S O N D Month of Birth
No age Age Dummies Benin −1.45 −1.4 −1.35 −1.3 Mean HAZ 27 27.5 28 28.5 29 Mean Age
J F M A M J J A S O N D month of birth
Age HAZ Bolivia −.5 −.4 −.3 −.2 −.1 0 .1 Estimated Coefficient
J F M A M J J A S O N D Month of Birth
No age Age Dummies
[image:16.612.121.491.72.610.2]Bolivia
−1 −.9 −.8 −.7 −.6 Mean HAZ 24 26 28 30 32 34 Mean Age
J F M A M J J A S O N D month of birth
Age HAZ Brazil −.5 −.4 −.3 −.2 −.1 0 .1 Estimated Coefficient
J F M A M J J A S O N D Month of Birth
No age Age Dummies Brazil −1.7 −1.6 −1.5 −1.4 −1.3 Mean HAZ 26 27 28 29 30 Mean Age
J F M A M J J A S O N D month of birth
Age HAZ BurkinaFaso −.5 −.4 −.3 −.2 −.1 0 .1 Estimated Coefficient
J F M A M J J A S O N D Month of Birth
No age Age Dummies BurkinaFaso −2.3 −2.2 −2.1 −2 −1.9 −1.8 Mean HAZ 23 24 25 26 27 Mean Age
J F M A M J J A S O N D month of birth
Age HAZ Burundi −.5 −.4 −.3 −.2 −.1 0 .1 Estimated Coefficient
J F M A M J J A S O N D Month of Birth
No age Age Dummies Burundi −2 −1.9 −1.8 −1.7 −1.6 Mean HAZ 28 29 30 31 32 Mean Age
J F M A M J J A S O N D month of birth
Age HAZ Cambodia −.5 −.4 −.3 −.2 −.1 0 .1 Estimated Coefficient
J F M A M J J A S O N D Month of Birth
No age Age Dummies
Cambodia
[image:17.612.124.494.73.609.2]−1.4 −1.3 −1.2 −1.1 −1 Mean HAZ 22 24 26 28 30 Mean Age
J F M A M J J A S O N D month of birth
Age HAZ Cameroon −.5 −.4 −.3 −.2 −.1 0 .1 Estimated Coefficient
J F M A M J J A S O N D Month of Birth
No age Age Dummies Cameroon −.95 −.9 −.85 −.8 Mean HAZ 28.5 29 29.5 30 30.5 31 Mean Age
J F M A M J J A S O N D month of birth
Age HAZ Colombia −.5 −.4 −.3 −.2 −.1 0 .1 Estimated Coefficient
J F M A M J J A S O N D Month of Birth
No age Age Dummies Colombia −1.6 −1.4 −1.2 −1 −.8 Mean HAZ 24 26 28 30 32 Mean Age
J F M A M J J A S O N D month of birth
Age HAZ Congo −.5 −.4 −.3 −.2 −.1 0 .1 Estimated Coefficient
J F M A M J J A S O N D Month of Birth
No age Age Dummies Congo −1.4 −1.3 −1.2 −1.1 −1 Mean HAZ 21 22 23 24 25 Mean Age
J F M A M J J A S O N D month of birth
Age HAZ CoteDIvoire −.5 −.4 −.3 −.2 −.1 0 .1 Estimated Coefficient
J F M A M J J A S O N D Month of Birth
No age Age Dummies
CoteDIvoire
[image:18.612.123.493.74.614.2]−.9 −.85 −.8 −.75 −.7 Mean HAZ 24 26 28 30 32 Mean Age
J F M A M J J A S O N D month of birth
Age HAZ DR −.5 −.4 −.3 −.2 −.1 0 .1 Estimated Coefficient
J F M A M J J A S O N D Month of Birth
No age Age Dummies DR −1.2 −1.1 −1 −.9 −.8 Mean HAZ 28 29 30 31 Mean Age
J F M A M J J A S O N D month of birth
Age HAZ Egypt −.5 −.4 −.3 −.2 −.1 0 .1 Estimated Coefficient
J F M A M J J A S O N D Month of Birth
No age Age Dummies Egypt −2 −1.9 −1.8 −1.7 −1.6 Mean HAZ 28 29 30 31 32 Mean Age
J F M A M J J A S O N D month of birth
Age HAZ Ethiopia −.5 −.4 −.3 −.2 −.1 0 .1 Estimated Coefficient
J F M A M J J A S O N D Month of Birth
No age Age Dummies Ethiopia −1.5 −1.4 −1.3 −1.2 Mean HAZ 23 24 25 26 27 Mean Age
J F M A M J J A S O N D month of birth
Age HAZ Ghana −.5 −.4 −.3 −.2 −.1 0 .1 Estimated Coefficient
J F M A M J J A S O N D Month of Birth
No age Age Dummies
Ghana
[image:19.612.123.493.75.612.2]−2.45 −2.4 −2.35 −2.3 −2.25 −2.2 Mean HAZ 25 26 27 28 29 Mean Age
J F M A M J J A S O N D month of birth
Age HAZ Guatemala −.5 −.4 −.3 −.2 −.1 0 .1 Estimated Coefficient
J F M A M J J A S O N D Month of Birth
No age Age Dummies Guatemala −1.4 −1.2 −1 −.8 Mean HAZ 24 26 28 30 32 Mean Age
J F M A M J J A S O N D month of birth
Age HAZ Guinea −.5 −.4 −.3 −.2 −.1 0 .1 Estimated Coefficient
J F M A M J J A S O N D Month of Birth
No age Age Dummies Guinea −1.4 −1.3 −1.2 −1.1 −1 Mean HAZ 27 28 29 30 31 Mean Age
J F M A M J J A S O N D month of birth
Age HAZ Haiti −.5 −.4 −.3 −.2 −.1 0 .1 Estimated Coefficient
J F M A M J J A S O N D Month of Birth
No age Age Dummies Haiti −2 −1.9 −1.8 −1.7 −1.6 Mean HAZ 23 24 25 26 27 Mean Age
J F M A M J J A S O N D month of birth
Age HAZ India −.5 −.4 −.3 −.2 −.1 0 .1 Estimated Coefficient
J F M A M J J A S O N D Month of Birth
No age Age Dummies
India
[image:20.612.123.493.75.613.2]−.8 −.75 −.7 −.65 −.6 −.55 Mean HAZ 28 29 30 31 32 Mean Age
J F M A M J J A S O N D month of birth
Age HAZ Jordan −.5 −.4 −.3 −.2 −.1 0 .1 Estimated Coefficient
J F M A M J J A S O N D Month of Birth
No age Age Dummies Jordan −1.6 −1.5 −1.4 −1.3 −1.2 Mean HAZ 25 26 27 28 29 Mean Age
J F M A M J J A S O N D month of birth
Age HAZ Kenya −.5 −.4 −.3 −.2 −.1 0 .1 Estimated Coefficient
J F M A M J J A S O N D Month of Birth
No age Age Dummies Kenya −2.2 −2.1 −2 −1.9 −1.8 −1.7 Mean HAZ 25 26 27 28 29 Mean Age
J F M A M J J A S O N D month of birth
Age HAZ Madagascar −.5 −.4 −.3 −.2 −.1 0 .1 Estimated Coefficient
J F M A M J J A S O N D Month of Birth
No age Age Dummies Madagascar −2.2 −2.1 −2 −1.9 −1.8 Mean HAZ 24 26 28 30 32 Mean Age
J F M A M J J A S O N D month of birth
Age HAZ Malawi −.5 −.4 −.3 −.2 −.1 0 .1 Estimated Coefficient
J F M A M J J A S O N D Month of Birth
No age Age Dummies
Malawi
[image:21.612.123.493.75.612.2]−1.7 −1.6 −1.5 −1.4 −1.3 −1.2 Mean HAZ 23 24 25 26 27 28 Mean Age
J F M A M J J A S O N D month of birth
Age HAZ Mali −.5 −.4 −.3 −.2 −.1 0 .1 Estimated Coefficient
J F M A M J J A S O N D Month of Birth
No age Age Dummies Mali −1.3 −1.2 −1.1 −1 Mean HAZ 28 28.5 29 29.5 30 30.5 Mean Age
J F M A M J J A S O N D month of birth
Age HAZ Morocco −.5 −.4 −.3 −.2 −.1 0 .1 Estimated Coefficient
J F M A M J J A S O N D Month of Birth
No age Age Dummies Morocco −1.9 −1.8 −1.7 −1.6 −1.5 Mean HAZ 25 25.5 26 26.5 27 27.5 Mean Age
J F M A M J J A S O N D month of birth
Age HAZ Mozambique −.5 −.4 −.3 −.2 −.1 0 .1 Estimated Coefficient
J F M A M J J A S O N D Month of Birth
No age Age Dummies Mozambique −1.4 −1.3 −1.2 −1.1 −1 Mean HAZ 25 26 27 28 29 Mean Age
J F M A M J J A S O N D month of birth
Age HAZ Namibia −.5 −.4 −.3 −.2 −.1 0 .1 Estimated Coefficient
J F M A M J J A S O N D Month of Birth
No age Age Dummies
Namibia
[image:22.612.123.493.75.615.2]−2.2 −2.15 −2.1 −2.05 −2 −1.95 Mean HAZ 25 26 27 28 29 30 Mean Age
J F M A M J J A S O N D month of birth
Age HAZ Nepal −.5 −.4 −.3 −.2 −.1 0 .1 Estimated Coefficient
J F M A M J J A S O N D Month of Birth
No age Age Dummies Nepal −2.2 −2 −1.8 −1.6 −1.4 Mean HAZ 22 24 26 28 30 Mean Age
J F M A M J J A S O N D month of birth
Age HAZ Niger −.5 −.4 −.3 −.2 −.1 0 .1 Estimated Coefficient
J F M A M J J A S O N D Month of Birth
No age Age Dummies Niger −1.8 −1.6 −1.4 −1.2 −1 Mean HAZ 26 27 28 29 30 Mean Age
J F M A M J J A S O N D month of birth
Age HAZ Nigeria −.5 −.4 −.3 −.2 −.1 0 .1 Estimated Coefficient
J F M A M J J A S O N D Month of Birth
No age Age Dummies Nigeria −2.4 −2.2 −2 −1.8 Mean HAZ 26 28 30 32 34 Mean Age
J F M A M J J A S O N D month of birth
Age HAZ Pakistan −.5 −.4 −.3 −.2 −.1 0 .1 Estimated Coefficient
J F M A M J J A S O N D Month of Birth
No age Age Dummies
Pakistan
[image:23.612.124.493.75.611.2]−1.65 −1.6 −1.55 −1.5 −1.45 −1.4 Mean HAZ 26 28 30 32 34 Mean Age
J F M A M J J A S O N D month of birth
Age HAZ Peru −.5 −.4 −.3 −.2 −.1 0 .1 Estimated Coefficient
J F M A M J J A S O N D Month of Birth
No age Age Dummies Peru −1.95 −1.9 −1.85 −1.8 −1.75 Mean HAZ 27 28 29 30 Mean Age
J F M A M J J A S O N D month of birth
Age HAZ Rwanda −.5 −.4 −.3 −.2 −.1 0 .1 Estimated Coefficient
J F M A M J J A S O N D Month of Birth
No age Age Dummies Rwanda −1.5 −1.4 −1.3 −1.2 −1.1 −1 Mean HAZ 24 26 28 30 Mean Age
J F M A M J J A S O N D month of birth
Age HAZ Senegal −.5 −.4 −.3 −.2 −.1 0 .1 Estimated Coefficient
J F M A M J J A S O N D Month of Birth
No age Age Dummies Senegal −2 −1.9 −1.8 −1.7 Mean HAZ 26 27 28 29 30 Mean Age
J F M A M J J A S O N D month of birth
Age HAZ Tanzania −.5 −.4 −.3 −.2 −.1 0 .1 Estimated Coefficient
J F M A M J J A S O N D Month of Birth
No age Age Dummies
Tanzania
[image:24.612.123.493.75.614.2]−1 −.9 −.8 −.7 −.6 Mean HAZ 27 28 29 30 31 32 Mean Age
J F M A M J J A S O N D month of birth
Age HAZ Turkey −.5 −.4 −.3 −.2 −.1 0 .1 Estimated Coefficient
J F M A M J J A S O N D Month of Birth
No age Age Dummies Turkey −1.9 −1.8 −1.7 −1.6 −1.5 Mean HAZ 25 25.5 26 26.5 27 Mean Age
J F M A M J J A S O N D month of birth
Age HAZ Uganda −.5 −.4 −.3 −.2 −.1 0 .1 Estimated Coefficient
J F M A M J J A S O N D Month of Birth
No age Age Dummies Uganda −2.1 −2 −1.9 −1.8 −1.7 Mean HAZ 26.5 27 27.5 28 28.5 29 Mean Age
J F M A M J J A S O N D month of birth
Age HAZ Zambia −.5 −.4 −.3 −.2 −.1 0 .1 Estimated Coefficient
J F M A M J J A S O N D Month of Birth
No age Age Dummies Zambia −1.5 −1.4 −1.3 −1.2 Mean HAZ 22 24 26 28 30 Mean Age
J F M A M J J A S O N D month of birth
Age HAZ Zimbabwe −.5 −.4 −.3 −.2 −.1 0 .1 Estimated Coefficient
J F M A M J J A S O N D Month of Birth
No age Age Dummies
Zimbabwe
[image:25.612.123.493.75.615.2]