This is a repository copy of Orientation Control and Crystallization in a Soft Confined Phase Separated Block Copolymer.
White Rose Research Online URL for this paper: http://eprints.whiterose.ac.uk/113045/
Version: Accepted Version Article:
Alharbe, L.G., Register, R.A. and Hobbs, J.K. (2017) Orientation Control and
Crystallization in a Soft Confined Phase Separated Block Copolymer. Macromolecules, 50 (3). pp. 987-996. ISSN 0024-9297
https://doi.org/10.1021/acs.macromol.6b02361
This document is the Accepted Manuscript version of a Published Work that appeared in final form in Macromolecules, copyright © American Chemical Society after peer review and technical editing by the publisher. To access the final edited and published work see https://doi.org/10.1021/acs.macromol.6b02361
eprints@whiterose.ac.uk https://eprints.whiterose.ac.uk/
Reuse
Unless indicated otherwise, fulltext items are protected by copyright with all rights reserved. The copyright exception in section 29 of the Copyright, Designs and Patents Act 1988 allows the making of a single copy solely for the purpose of non-commercial research or private study within the limits of fair dealing. The publisher or other rights-holder may allow further reproduction and re-use of this version - refer to the White Rose Research Online record for this item. Where records identify the publisher as the copyright holder, users can verify any specific terms of use on the publisher’s website.
Takedown
If you consider content in White Rose Research Online to be in breach of UK law, please notify us by
Orientation Control and Crystallization in a Soft Confined Phase
Separated Block Copolymer
Lamiaa G. Alharbe,† Richard A. Register,‡Jamie K. Hobbs*,†
†Department of Physics and Astronomy, University of Sheffield, Hicks Building, Sheffield, S3 7RH, United Kingdom
‡Department of Chemical and Biological Engineering and Princeton Institute for the Science and Technology of Materials, Princeton University, Princeton, New Jersey 08544, United States
*
Corresponding author:Email address: Jamie.hobbs@sheffield.ac.uk
Phone: +44 (0)114 22 24532
ABSTRACT
Microdomain orientation and crystallization were examined in a crystalline-amorphous
diblock copolymer, hydrogenated poly (high-1,4-butadiene)-b-poly(high-3,4-isoprene)
(E/MB), which forms cylinders of the crystallizable block (polyethylene, E). Atomic force
microscopy (AFM) was used to locally control the orientation of the E cylinders. The
orientation process and subsequent crystallization behavior were investigated in situ as a
function of temperature by AFM. Fully confined crystallization was observed within the
range of 25- 50 °C, with templated and breakout crystallization observed at higher
crystallization temperature. The growth rate of templated crystallization along and
perpendicular to the existing microdomain structure was measured and the ratio between
these rates found to increase rapidly with decreasing temperature with a change from ~4.8 at
100°C to ~8 at 97°C. Two maxima in the degree of orientation of the crystallized regions
were found, one at relatively small supercoolings (e.g. 95 °C) where the differential in growth
rate along and across microdomain boundaries is high, and one at high supercoolings (25- 50
°C) where crystallization is completely dominated by nucleation.
1
1. INTRODUCTION
Over the last six decades, extensive studies have been carried out to gain an understanding of
the properties and behaviour of semi-crystalline polymers. In particular, crystallization in
confinement has received great interest both experimentally1–11 and through simulation12 in
recent years. One reason for exploring confinement effects is that confined systems are
becoming increasingly widespread, as devices and materials are constrained due to
miniaturization. Secondly, the fundamental understanding obtained from studies of
confinement length when it reaches an intrinsic length scale of the system can be extended to
gain an understanding of crystallization in general.
Amongst the most convenient common methods to achieve confinement at the nanoscale are
crystalline–amorphous diblock copolymers13 (with one crystallizable block), due to their
self-assembled microdomains. Diblock copolymers generate various microphase separation
structures14, such as spheres, cylinders, gyroids and lamellae. The shape, size and order of
these microdomains can be controlled by varying the properties of the blocks (length,
composition, affinity, etc.).
Controlling the orientation of the microdomains within a specific localized region is essential
for the development of novel nanometre structures and in various applications15, such as data
storage, lithography, computer memory and nanometre-scale templating16; if carefully
controlled, the molecular orientation introduces anisotropy in the physical properties. Several
approaches have been used to manipulate the orientation of copolymer microdomains,
including electric fields17,18, solvent fields19–22, chemically patterned substrates23, thermal
gradients24, shear 25–29, and AFM tips30–35.
AFM cantilever tips have been successfully used in the modification of a number of polymer
2
to scan or indent the films, creating ripple structures perpendicular to the fast scanning
direction36. The modification mechanism in this method is considered to be mechanical
deformation30–33,37.
AFM is a powerful technique for studying the crystallization of polymers, providing
nanometre-scale information coupled with an ability to collect data in real time during the
crystallization process38. AFM has been successfully employed to study diblock
copolymers39–41, for example allowing direct visualization of crystallization in both
cylindrical and spherical microdomains42.
In the current study, the AFM tip has been used to locally control the orientation of block
copolymer microdomains before they crystallized, defining what direction the crystals
initially grow relative to the blocks’ interface. This simple process made the analysis of the
impact of microdomain orientation on growth easier to determine. By controlling the
orientation in a variable manner across the sample and then following the subsequent
crystallization, complex structures with potentially interesting properties can also be formed.
2. EXPERIMENTAL METHODS
A hydrogenated poly (1,4-butadiene)-b-(3,4-isoprene) diblock copolymer, denoted as E/MB,
was used. E is the hydrogenated high-1,4-poly butadiene (polyethylene), which is the
crystallizable minority block, while MB is the rubbery amorphous majority block. The glass
transition temperature (Tg) of the MB block is below room temperature (-17 °C). The molar
masses of the E and MB blocks were 17 and 45 kg/mol, respectively. The volume fraction for
E, fE, is 0.27, which results in a cylindrical mesophase of polyethylene in the phase separated
state. The synthesis and characterization of this E/MB diblock has been described in detail
3
The samples were prepared by melt casting onto a glass coverslip at 130 °C (above the
melting point) using a Linkam TP94 hot stage. Then, they were thinned by a razor blade,
producing films with a thickness of few micrometers. The films were then quenched to the
examined crystallization temperature (in the range of 94–115 °C) at the maximum cooling
rate of the hot stage, nominally 90 °C/min.
AFM was performed in tapping mode, using a Veeco Dimension 3100 AFM with a
Nanoscope IIIA controller. Silicon tapping cantilevers (nominal spring constant 40 Nm-1 and
resonance frequency ~ 300 kHz) were used (TESPA-V2). All images were taken at 512×512
pixels. The majority of the images were phase images in which the contrast contains a
mixture of the adhesive and mechanical properties of the film surface.
The experimental setup is shown in Figure 1a. Once the films had been prepared on the
substrate, they were placed on a heater at a temperature range from 110–120 °C (Below 110
°C, the tip induced crystallization as presented in SI1).
0 0.2 0.4 0.6 0.8 1
-20 0 20 40 60 80 100 120
D eg re e o f c o o li n g d u e to A F M ( oC )
Linkam Temperature (oC)
(a) (b) AFM Tip Randomly Oriented Cylindrical Domains Oriented Cylindrical Domains Substrate
Linkam Heating Stage
Fast Scan axis
Figure 1: (a) Schematic diagram of experimental setup. The E/MB microdomains are randomly
oriented initially. The AFM tip orients the E/MB microdomains in its fast scan direction while a
Linkam heating stage heats the film above the melting point (i.e. 115 °C). (b) Calibration plot
4
acquire the actual sample temperature. The cooling effect of the AFM tip on sample temperatures was
measured between approximately 70 °C and 115 °C. Error bars are the standard deviations from
several measurements. As the measured temperature corrections are less than 1 °C the ‘as displayed’
temperatures are given in this paper.
Following an initial imaging scan the sample was imaged with high force over the area to be
oriented, using a setpoint of 0.2-0.4 V compared to a free amplitude (i.e. amplitude when off
the surface) of ~3 V (i.e. a relative setpoint, rsp, of ~0.1), corresponding to an rms amplitude
of ~1.8-3.5 nm and ~27 nm respectively. Using the approach outlined in 43 this equates to a
force of approximately 3.7 nN. The average bending of the cantilever when carrying out this
low amplitude imaging was 0.09 nm, corresponding to a force of approximately 3.8 nN
(assuming the nominal spring constant for the cantilevers used), in good agreement with the
theoretical estimate. The area was then re-imaged at low force (rsp ~ 0.8), to determine the
impact of the orienting scan. Following this orientation procedure the sample was then cooled
on the Linkam to the desired temperature with the tip retracted from the surface, and then
imaged in situ during subsequent crystallization.
Due to the temperature variation between the unheated AFM tip and the sample the
temperature of the sample area being scanned will deviate from that which is set on the
heater. Therefore, a calibration was done to account for this cooling effect of the AFM tip.
The calibration was performed using materials with well-defined melting point transitions
(see Figure 1b). All the temperatures in this paper are the heater displayed temperature as the
5
3. RESULTS AND DISCUSSION
This work can be split into two main sections: the first considers controlling the orientation of
microdomains by the AFM tip and the second, the crystallization behaviour as a function of
temperature.
3.1. Alignment of E/MB microdomains by the AFM tip
3.1.1. Orientation Control of Microdomains
The AFM tip was used as a tool to orient the crystalline cylindrical domains mechanically in
its scanning direction before they crystallized. After aligning the cylinders of the E/MB, the
subsequent crystallization behaviour was examined in situ at different temperatures.
Scanning Direction
e b
d
a c
1 µm 1 µm
1 µm 1 µm
1 µm
f
1 µm
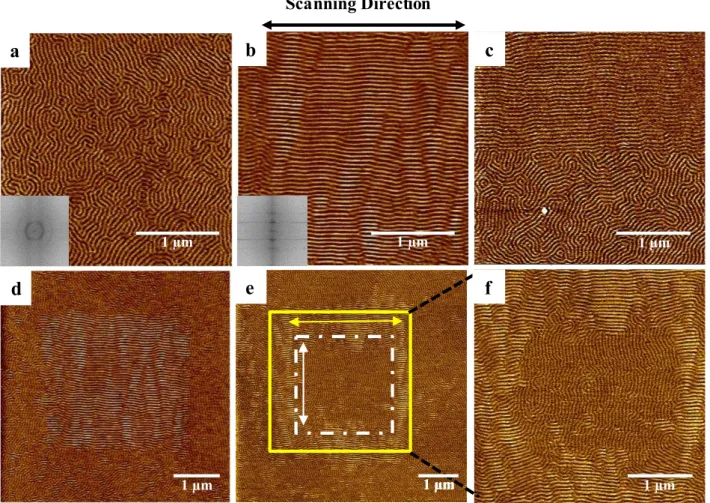
Figure 2: AFM phase images showing: (a) the natural random orientation of E/MB microdomains in
the melt state, (b) the cylindrical microdomains oriented by the AFM tip, (c) the boundary between
6
domains. The insets in (a) and (b) are the corresponding Fast Fourier Transform patterns of the
cylindrical microdomains showing essentially random orientation in (a) and a high degree of
orientation in (b). (e) AFM phase image showing aligned cylinders of E/MB in two different
directions according to the AFM tip scanning direction. The arrows indicate the fast scanning
direction in the two differently oriented regions (white and yellow squares). Image (f) is a magnified
view of the yellow square region in image (e). Colour scales are (a-b) 5°, (c) 3°, (d) 5°, and (e-f) 4°.
Figure 2(a) illustrates an AFM phase image of the melt microdomain structure in E/MB. The
cylindrical microdomains that resulted from the initial film preparation were oriented
randomly with cylinders largely lying in the plane of the surface. Figure 2(b) shows the
aligned cylindrical microdomains resulting from scanning of the AFM tip over the film
surface, at low relative setpoint.
The FFTs of the AFM images show the disorder, (a), and high degree of order, (b), of the
cylindrical microdomains. Figures 2(c) and (d) show further examples. A clear boundary
between the oriented domains (in the top half) and the random domains (in the bottom half)
can be seen in image (c). Image (d) illustrates the aligned cylindrical microdomains in a
matrix of random cylinders.
The alignment direction of the cylindrical microdomains can be controlled by altering the tip
travel direction. Figure 2 (e) shows an example resulting from multiple tip scans having been
carried out on the sample. The tip first scanned parallel over a 4×4 µm area (the yellow
square in image (e)), aligning the random cylindrical microdomains along its scanning
direction. Subsequently, the tip was scanned perpendicularly to the initial scan direction over
a 2.5×2.5 µm area (the white square in image (e)) in the approximate centre of the previously
aligned microdomains, resulting in reorienting this area orthogonally to the previously
7
boundary between the two oriented regions is less clearly defined than that between oriented
and disoriented areas, implying a greater barrier to the reorientation process.
3.1.2. Enhanced Microdomain Ordering
The AFM tip is able to align cylindrical microdomains in its scanning direction, although in
some cases defects—dislocations, sometimes clustered together— were observed (Figure 3).
We explored the extent to which multiple scans impacted upon the number of defects.
Scanning the same area more than once (with the same hard tapping force conditions initially
used for alignment, low amplitude and low relative set-point rsp≈ 0.1) reduced the number of
defects. Accordingly, areas that were scanned once contained a greater number of defects per
unit area compared with areas scanned more than once. This situation is shown in Figure 3.
The cylindrical microdomains are highlighted, from which it can be seen that the number of
defects was reduced by simply increasing the number of scans with the same hard tapping
conditions. Scan twice Scan th ree ti me s (a) Scan o nce (b) (c) Scan nin g nu mber
Figure 3: AFM phase images showing the effect of scanning number on the defects per unit area, a-c
1st, 2nd and 3rd scans, respectively, with relatively high tapping force (low amplitude and low r
sp≈ 0.1)
at 115oC. The defects are highlighted in yellow to aid the reader in following the reduction in defects
8
On the other hand, there were a few cases where some defects were formed by increasing the
number of scans (see SI2). Nevertheless, in those cases, the number of defects per unit area
was reduced by increasing the number of scans over the film, resulting in better ordering in
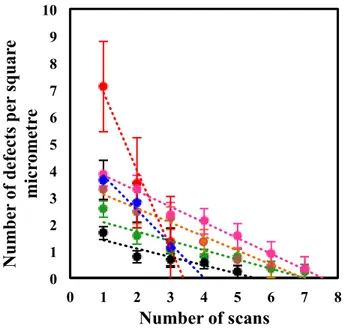
general. Figure 4 is a plot showing this result from several experiments. The change in the
number of defects was found to vary with the number of scans but was approximately linear,
with an overall average decrease in the number of defects per square micrometre of 0.9 per
scan. 0 1 2 3 4 5 6 7 8 9 10
0 1 2 3 4 5 6 7 8
N u mb er o f d ef ec ts p er s q u a re m ic ro m et re
Number of scans
Figure 4: A plot showing the number of defects as a function of the number of scans (each colour
indicates an independent experiment). Error bars are the standard errors.
Having formed oriented domains of cylinders we now study the impact of orientation on
9
3.2. Crystal Morphology as a Function of Temperature
a) Morphology Formation from Unoriented Cylindrical Microdomains
The morphology formed depends on the temperature of crystallization. Therefore, in order to
see the effects of temperature on the structure of the crystals formed, the same sample was
isothermally crystallized at different temperatures. The sample was transferred very quickly
from the heating stage held at 130 °C to another heating stage placed under the AFM and
held at the crystallization temperature for several minutes, allowing the sample to crystallize.
The duration of holding the sample at the specific temperature depended on the
crystallization rate, e.g. crystallization at 50 °C took place very fast so at this temperature the
sample was held for 5 minutes to ensure complete crystallization, however at higher
temperatures, crystallization occurs slower, needing more time to be completed. An example
is shown in Figure 5. The same sample was used to investigate both the effects of
temperature on the structure of the crystals formed and the temperature at which the crystals
would be completely confined within the microdomain melt structure. The order that these
experiments were performed in was first at room temperature, then 50 °C, 60 °C, 70 °C, 80
10
1
µ
m
1
µ
m
1
µ
m
1
µ
m
1
µ
m
1
µ
m
100 C
a
80 C
b
c
d
70 C
e
f
room temperature
50 C
60 C
Figure 5: AFM phase images of crystallized E/MB after isothermal crystallization (the same area) at:
(a) room temperature, (b) 50 °C, (c) 60 °C, (d) 70 °C, (e) 80 °C and (f) 100 °C (unoriented cylinders).
These images are cropped from the larger images shown in Figure S3a. Colour scales are (a) 9°, (b)
8° (c-d) 11°, and (f) 7°.
Figure 5 shows images of different crystal morphologies formed isothermally at a range of
temperatures: room temperature, 50 °C, 60 °C, 70 °C, 80 °C, and 100 °C. In general,
confined crystallization can be observed in two cases: firstly when the Tc of the crystalline
block (E, in this study) is lower than the Tg of the amorphous block (MB in this study) and
secondly when both the crystalline and amorphous blocks are strongly segregated in the
molten state and the degree of crystallinity is relatively low3. Although here in all cases the
Tc,E was greater than Tg,MB for the studied system, a range of crystallization modes was
observed. At temperatures of 50 °C and below, the crystals were fully confined by the
11
crystallization (i.e. where the crystals generally grow parallel to the axes of the cylindrical
microdomains, but not exclusively) was observed. At 100°C, breakout crystallization is
observed, with the initially cylinder shaped crystals widening to form lamellae. Note the
vertical line in the centre of the images is a defect in the film that was used to help return to
the same place each time.
Moreover, by comparing the change in surface morphology caused by E crystallization at
different temperatures, it is clear that the nucleation density quickly increases as the
crystallization temperature lowers. At low supercoolings (high temperatures), such as 100 °C,
very few nucleation sites were found, as seen in Figure 5 (a). However, at larger
super-cooling (low temperatures), such as 80 °C and 70 °C, there was a significant increase in the
density of nucleation sites.
The above work was carried out on un-oriented microdomains. The same approach was used
to investigate the dependence of morphology formed from oriented microdomains on the
12
b) Morphology Formation from Oriented Cylindrical Microdomains
1 µm b
a 100 C c 95 C
d 90 C e f 70 C
g h 50 C
80 C
60 C 112 C
room temperature
i
1 µm 1 µm
1 µm 1 µm
1 µm
1 µm 1 µm
1 µm
Figure 6: AFM phase images of E/MB showing (a) an orientated melt structure at 112 °C and images
(b-i) showing crystallized E/MB after isothermal crystallization at: (b) 100 °C, (c) 95 °C, (d) 90 °C,
13
transforms of the images. Colour scales are (a) 8°, (b) 7°, (c) 8°, (d) 9°, (e-f) 10°, (g) 11°, and (h-i)
12°.
Figure 6 shows the melt structure of the oriented E/MB at 112 °C in image (a), and the fully
crystallized film after quenching to room temperature in image (i). The crystals were strictly
confined within the melt structure at room temperature.
The change in crystal orientation with temperature is striking, with an initial increase in
orientation on cooling, lower orientation at moderate supercooling e.g. at 80 °C and then
increased orientation at high supercooling. To explore this further we follow the
crystallization process in situ.
An equivalent set of data for samples that had not been pre-oriented is shown in Figure S3b.
3.3. Following Crystallization in Pre-Oriented Domains in Situ
After aligning the cylindrical microdomains in the melt phase with the AFM tip, the film was
then cooled to the desired crystallization temperature to be isothermally crystallized in order
to investigate the subsequent crystallization.
3.3.1. Crystallization Behaviours at Different Temperatures
The crystallization behaviour was investigated by observing the crystallization process in real
time at various temperatures. Figure 7 shows an example of following crystallization at 95
°C. Another example, at 99 °C, is given in SI4. The crystallization was followed in the
temperature range of 95–101 °C, where the AFM was able to image the crystallization in situ,
in order to study the influence of temperature on crystallization. Below 95 °C, it was not
possible to follow the crystal growth in real time, as the crystallization was found to be
complete before the imaging could be carried out. Above 101 °C, no crystallization was
14
1 µm
a b
d c
Figure 7: A sequence of AFM phase images collected at 95 °C showing the crystallization in E/MB
from the aligned melt structure. Colour scale represents a change in phase of 5o.
Figure 7 shows templated crystallization occurring at 95 C, with the polyethylene crystals generally following the contours of the pre-existing E cylinders in the melt. At 99 C (SI4),
some regions of breakout crystallization could also be observed, as previously documented
for this polymer 44.
In combined in-situ and ex-situ images we found interesting behaviour of crystals at a
different range of temperatures that can be divided into four categories. First, at very high
temperature (e.g. 100°C) crystals cross domain boundaries easily which leads to breakout; in
some regions, instead of the needle-like crystals present within cylindrical microdomains, flat
lamellae lying in the plane of the sample surface can be observed. Second, as the temperature
was reduced (e.g. 95 °C) crystals grow much faster along the microdomains leading to
templated crystallization, and the flat lamellae resulting from breakout are not generally
observed. Third, as temperature was reduced further (e.g. 80 °C) crystals are observed to
15
between nuclei, required for the growing crystals to reorient, is reduced. Finally, as the
temperature is reduced even further (e.g. 50°C), crystallization becomes confined within the
microdomains. It is unclear whether this is due to confinement changing growth direction or
because the nucleation density is so high that it dominates over growth, but the latter seems
most likely. Formation of lamellae has only been observed at high temperatures (e.g. 100 ºC)
where the crystals widen and break out the cylindrical microdomains, while at lower
temperatures only needle-like crystals within cylindrical microdomains have been observed.
In these studies of isothermal crystallization (i.e. not quenching to room temperature) the best
orientation obtained was at 95 °C. If our hypothesis— that it is nucleation that is dominating
at the lowest temperatures— is correct, then although the crystal domains are oriented at
these low temperatures, we would not expect the crystal lattice to be oriented, while at 95 °C
where it has grown along the orientation direction we would expect both the domain and the
lattice to have a common orientation. We have not been able to test this due to the relatively
small size of the oriented regions in our samples.
3.3.2. Growth Rate
The growth rate of crystals was studied as a function of temperature to obtain quantitative
kinetic information about the crystallization behaviour. The distance of the crystal growth
was measured in a succession of images by measuring how far the growth front of the crystal
moved from one image to the next. The average growth rates of a number of crystallites
growing parallel to the cylinder axes, as well as those growing perpendicular, at temperatures
16
96 97 98 99 100 101 0 2 4 6 8 10
Temperature (
oC)
R
a
ti
o
o
f
g
ro
w
th
r
a
te
(a)
(b)
97 98 99 100 0 1 2 3 4 5
Temperature (
oC)
G
ro
w
th
R
a
te
(
n
m
/s
)
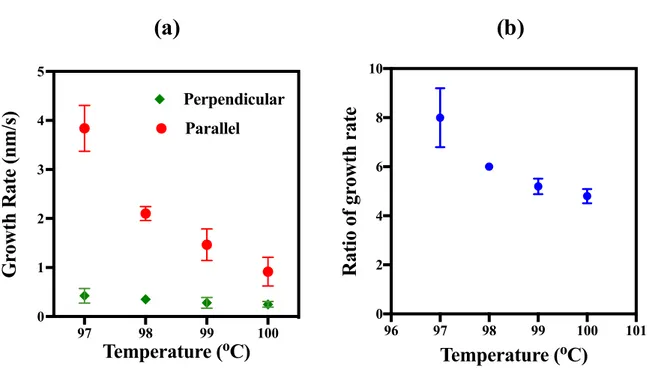
Parallel PerpendicularFigure 8: Graphs showing the relationship between temperature and (a) the average growth rates
along the cylinder axis and the growth rate perpendicular to the cylinder axis and (b) the ratio of the
two.
From Figure 8 (a) it can be clearly seen that the growth rates along cylinders are much
higher than the growth rates perpendicular to them. Moreover, as the temperature increased,
the growth rate ratio of the crystals growing along the cylinders compared to those growing
against them decreased sharply from ~8 at 97°C to ~4.8 at 100°C as shown in Figure 8 (b)
(see the corresponding values of these graphs in SI 5). Hence, two outcomes were observed
related to increasing the crystallization temperature: a decrease in the overall crystallization
rate and a decrease in the relative difference between the growth rates along the cylinders and
against them.
These data imply that, at high temperatures, an increase in the diffusion of E blocks between
domains and a decrease in the rate of take-up of E chains onto the growth front combine to
17
chain to diffuse from one cylinder to another becomes comparable to the time required for a
chain to add to the growing crystal, and breakout crystallization can occur.
3.3.3. The Transition from ‘Breakout’ to ‘Templated’ Growth
At low supercooling the nucleation density is low so for crystals to grow relatively straight in
un-oriented areas they must cross domain boundaries. Growth parallel to the oriented
microdomains happens through re-orientation of the growth direction, either from bending or
18
(a) (b) (c)
(d) (e) (f)
(g) (h) (i)
1 µm
Figure 9: In situ AFM phase images showing E/MB crystallization at 101 °C. Each image was
captured in 128 s, and the image scan size is 3.5 µm. Arrows have been added to aid the reader in
following the branching and curving of crystals growing against the melt structure. Black to white
scale 6o. These images are cropped from the larger images shown in SI6. The full series with some
19
Figure 9 shows the partial branching of crystals that are growing against the melt
microdomains. Two different behaviours for the branching crystals are illustrated:
a) Crystal thickening and branching (see white arrows in Figure 9(d-h) until it meets
another crystal (SI6).
b) Crystals adjust their growth directions to be along the existing melt cylinders with an
increase in their growth rate, without any branching (the red arrow in Figure 9(d-f)
indicates such a situation).
Crystals growing parallel to the cylinder axes show very low rates of branching compared
with crystals growing perpendicular to the cylinders. In the case of crystals growing parallel
to the cylinder axes, the crystallization front is always surrounded to the sides by
uncrystallisable material. To branch into another domain would require a significant
alteration of the local melt structure by diffusion of copolymer. As this diffusive process is
slow relative to the growth of the crystal along the cylinder, it becomes unlikely that diffusive
processes will have enough time to alter the domain structure at the growth front to form
branches before the bulk of the material is consumed by the crystallization along the melt
domain. In the case of crystals growing against the melt domain, the crystal front is
constantly being forced to reorganize the local melt structure in order to grow. Under these
conditions, crystal growth is slowed significantly, enabling effects such as the branching and
thickening of the crystals to occur.
4. CONCLUSION
The crystallization behaviour of a cylinder-forming E/MB diblock copolymer has been
investigated in real time, in situ combined with ex situ imaging by AFM. The AFM tip has
20
different directions according to its scan direction, and then following the subsequent
crystallization. It was found that the number of defects (dislocations) reduced with an
increase in the number of orienting scans. Depending on the thermal conditions examined, a
change from fully confined crystallization to templated and breakout crystallization was
observed. Confined behaviour of crystals was observed at very high supercooling (room
temperature and 50°C), templated crystallization at intermediate temperatures, and a mixture
of templated and breakout crystallization at the highest temperatures, e.g. at 100 °C. The
difference in the morphology and the behavior of crystals growing parallel to the axes of the
pre-existing melt cylinders, and those growing perpendicular, has been explored. The growth
rates of confined crystals were higher than those of crystals growing against the established
melt structure. As the crystallization temperature increased, the overall crystallization rate
and the relative difference between the growth rates along the cylindrical microdomains and
against them decreased. This indicates that small variations in crystallization temperature can
have significant effect on the morphology and properties particularly where the melt has been
pre-aligned as may well happen during processing.
ASSOCIATED CONTENT
Supporting Information:
AFM images showing crystallization induced by the AFM tip. AFM images showing
reduction in numbers of defects. AFM images showing crystal morphology as a function of
temperature. AFM images showing crystallization in pre-oriented domains and a movie of the
same data. A table showing growth rates as a function of temperature parallel and
21
NOTES
The authors declare no competing financial interest.
ACKNOWLEDGMENTS
We would like to thank Dr.Nicholas Mullin for his support and the Ministry of Higher
Education in Saudi Arabia for funding. R.A.R. gratefully acknowledges support from the
National Science Foundation, Polymers Program (DMR-1402180). The authors thank Drs.
Gary Marchand (Dow Chemical) and Daniel Quiram (Princeton University) for the synthesis
of the E/MB diblock copolymer.
REFERENCES
(1) Loo,Y. L.; Register, R . A.; Ryan, A. J. Polymer Crystallization in 25-nm Spheres,
Phys. Rev. Lett. 2000, 84, 4120–4123.
(2) Quiram, D. J.; Register, R. A.; Marchand, G.R. Crystallization of Asymmetric Diblock
Copolymers from Microphase-Separated Melts, Macromolecules 1997, 30, 4551-4558.
(3) Zhu, L.; Chen, Y.; Zhang, A. Q.; Calhoun, B. H.; Chun, M. S.; Quirk, R. P.;
Cheng, S. Z. D.; Hsiao, B. S.; Yeh, F. J.; Hashimoto,T. Phase Structures and
Morphologies Determined by Competitions among Self-Organization, Crystallization,
and Vitrification in a Disordered Poly(ethylene oxide)-b-polystyrene Diblock
Copolymer, Phys. Rev 1999, 60, 10022–10031.
(4) Zhu, L.; Cheng, S. Z. D.; Calhoun, B. H.; Ge, Q.; Quirk, R. P.; Thomas, E. L.; Hsiao,
22
within Nanoscale Confined Lamellae of a Self-Assembled Crystalline - Amorphous
Diblock Copolymer, J. Am. Chem. Soc. 2000, 122, 5957–5967.
(5) Huang, P.; Zhu, L.; Cheng, S. Z. D.; Ge, Q.; Quirk, R. P.; Thomas, E. L.; Lotz, B.;
Hsiao, B. S.; Liu, L.; Yeh, F. Crystal Orientation Changes in Two-Dimensionally
Confined Nanocylinders in a Poly( ethylene oxide )-b-polystyrene/Polystyrene Blend,
Macromolecules 2001, 34, 6649–6657.
(6) Opitz, R.; Lambreva, D. M.; De Jeu, W. H. Confined Crystallization of Ethylene
oxide-butadiene Diblock Copolymers in Lamellar Films, Macromolecules 2002, 35,
6930–6936.
(7) Gao, W.-P.; Bai, Y.; Chen, E.-Q.; Zhou, Q.-F. Crystallization and Melting of
poly(ethylene oxide) Confined in Nanostructured Particles with Cross-Linked Shells of
Polybutadiene, Chinese J. Polym. Sci. 2005, 23, 275–284.
(8) Zhu, L.; Mimnaugh, B. R.; Ge, Q.; Quirk, R. P.; Cheng, S. Z.; Thomas, E. L.; Lotz, B.;
Hsiao, B. S.; Yeh, F.; Liu, L. Hard and Soft Confinement Effects on Polymer
Crystallization in Microphase Separated Cylinder-Forming PEO-b-PS/PS Blends,
Polymer 2001, 42, 9121–9131.
(9) Xu, J.-T.; Zhao, Y.-Q.; Liang, G.-D.; Fan, Z.-Q. Melting–Recrystallization of Block
Copolymer Crystals in Confined Environments, Polym. J. 2005, 37, 43–46.
(10) Loo, Y. L.; Register, R. A.; Ryan, A. J.; Dee, G. T. Polymer Crystallization Confined
in One, Two, or Three Dimensions, Macromolecules 2001, 34, 8968–8977.
(11) Hamley, I. W.; Fairclough, J. P. A.; Ryan, A. J.; Bates, F. S.; Towns-Andrews, E.
Crystallization of Nanoscale-Confined Diblock Copolymer Chains, Polymer 1996, 37,
23
(12) Zha, L.; Hu, W. Molecular Simulations of Confined Crystallization in the
Microdomains of Diblock Copolymers, Progress in Polymer Science 2016, 54,
232-258.
(13) Zhu, L.; Cheng, S. Z. D.; Calhoun, B. H.; Ge, Q.; Quirk, R. P.; Thomas, E. L.;
Hsiao,B. S.; Yeh, F.; Lotz, B. Phase Structures and Morphologies Determined by
Self-Organization, Vitrification, and Crystallization: Confined Crystallization in an Ordered
Lamellar Phase of PEO- b -PS Diblock Copolymer, Polymer 2001, 42, 5829–5839.
(14) Bates F. S.; Fredrickson, G. H. Block Copolymer Thermodynamics: Theory and
Experiment, Annu. Rev. Phys. Chem. 1990, 41, 525–557.
(15) Chen, Y.; Cui, H.; Li, L.; Tian, Z.; Tang, Z. Controlling Micro-Phase Separation in
Semi-crystalline/amorphous Conjugated Block Copolymers, Polym. Chem. 2014, 5,
4441–4445.
(16) Gazit, O.; Khalfin, R.; Cohen, Y.; Tannenbaum, R. Self-Assembled Diblock
Copolymer ‘Nanoreactors’ as ‘Catalysts’ for Metal Nanoparticle Synthesis, J. Phys.
Chem. C. 2009, 113, 576–583.
(17) Morkved, T. L.; Lu, M.; Urbas, A. M.; Ehrichs, E. E.; Jaeger, H. M.; Mansky, P.;
Russell,T. P. Local Control of Microdomain Orientation in Diblock Copolymer Thin
Films with Electric Fields, Science 1996, 273, 931–933.
(18) Thurn-Albrecht, T.; Derouchey, J.; Russell, T. P.; Jaeger, H. M. Overcoming
Interfacial Interactions with Electric Fields, Macromolecules 2000, 33, 3250–3253.
(19) Kim, G.; Libera, M. Morphological Development in Solvent-Cast Polystyrene -
Polybutadiene - Polystyrene ( SBS ) Triblock Copolymer Thin Films, Macromolecules
24
(20) Kim, S. H.; Misner, M. J.; Xu, T.; Kimura, M.; Russell, T. P. Highly Oriented and
Ordered Arrays from Block Copolymers via Solvent Evaporation, Adv. Mater. 2004,
16, 226–231.
(21) Rider, D. A.; Liu, K.; Eloi, J.; Vanderark, L.; Yang, L.; Wang, J.; Grozea, D.; Lu,. Z.;
Russell, T. P.; Manners, I. Nanostructured Magnetic Thin Films from Organmetallic
Block Copolymers: Pyrolysis of Self-Assembled Polystrene-block
poly(ferrocenylethlemethylisilane), ACS Nano 2008, 2, 263–270.
(22) Son, J. G.; Gwyther, J.; Chang, J. B.; Berggren, K. K.; Manners, I.; Ross, C. A. Highly
Ordered Square Arrays from a Templated ABC Triblock Terpolymer, Nano Lett. 2011,
11, 2849–2855..
(23) Kim, S. O.; Solak, H. H.; Stoykovich, M. P.; Ferrier, N. J.; De Pablo, J. J.; Nealey, P.
F. Epitaxial Self-assembly of Block Copolymers on Lithographically Defined
Nanopatterned Substrates, Nature 2003, 424, 411–414.
(24) Bodycomb, J.; Funaki, Y.; Kimishima, K.; Hashimoto, T. Single-Grain Lamellar
Microdomain from a Diblock Copolymer, Macromolecules 1999, 32, 2075–2077.
(25) Angelescu, D. E.; Waller, J. H.; Adamson, D. H.; Deshpande, P.; Chou, S. Y.;
Register, R. A.; Chaikin, P. M. Macroscopic Orientation of Block Copolymer
Cylinders in Single-Layer Films by Shearing, Adv. Mater. 2004, 16, 1736-1740.
(26) Singh, G.; Yager, K. G.; Berry, B.; Kim H. C.; Karim, A. Dynamic Thermal
Field-Induced Gradient Soft-Shear for Highly Oriented Block Copolymer Thin Films, ACS
Nano 2012, 6, 10335-10342
(27) Qiang, Z.; Zhang, L. H.; Stein, G. E.; Cavicchi, K. A.; Vogt, B. D. Unidirectional
25
Elastomer during Solvent Vapor Annealing, Macromolecules 2014, 47, 1109-1116.
(28) Davis, R. L.; Chaikin, P. M.; Register, R. A. Cylinder Orientation and Shear
Alignment in Thin Films of Polystyrene-Poly(n-hexyl methacrylate) Diblock
Copolymers, Macromolecules 2014, 47, 5277-5285.
(29) Davis, R. L.; Michal, B. T.; Chaikin, P. M.; Register, R. A. Progression of Alignment
in Thin Films of Cylinder-Forming Block Copolymers Upon Shearing,
Macromolecules 2015, 48, 5339-5347.
(30) Hamada, E.; Kaneko, R. Micro-Tribological Evaluations of a Polymer Surface by
Atomic Force Microscopes, Ultramicroscopy 1992, 44, 184–190.
(31) Pickering, J.; Vancso, G. On the Formation of Oriented Nanometer Scale Patterns on
Amorphous Polymer Surfaces Studied by Atomic Force Microscopy, Appl. Surf. Sci.
1999, 148, 147–154.
(32) Leach, R. N.; Stevens, F.; Seiler, C.; Langford, S. C.; Dickinson, J. T.
Nanometer-Scale Solvent-Assisted Modification of Polymer Surfaces Using the Atomic Force
Microscope, Langmuir 2003, 19, 10225–10232.
(33) Gotsmann, B.; Dürig, U. Thermally Activated Nanowear Modes of a Polymer Surface
Induced by a Heated Tip, Langmuir 2004, 20, 1495–1500.
(34) Schönherr, H.; Waymouth, R. M.; Frank, C. W. Nucleation and Crystallization of
Low-Crystallinity Polypropylene Followed in Situ by Hot Stage Atomic Force
Microscopy, Macromolecules 2003, 36, 2412–2418.
(35) Felts, J. R.; Onses, M. S.; Rogers, J. a; King, W. P. Nanometer Scale Alignment of
26 2999–3002.
(36) Leung, O. M.; Goh, M. C. Orientational Ordering of Polymers by Atomic Force
Microscope Tip-Surface Interaction, Science 1992, 255, 64–66.
(37) Schmidt, R. H.; Haugstad, G.; Gladfelter, W. L. Scan-Induced Patterning and the Glass
Transition in Polymer Films: Temperature and Rate Dependence of Plastic
Deformation at the Nanometer Length Scale, Langmuir 2003, 19, 10390–10398.
(38) Hobbs, J. K.; Farrance, O. E.; Kailas, L. How Atomic Force Microscopy Has
Contributed to Our Understanding of Polymer Crystallization, Polymer 2009, 50,
4281–4292.
(39) Harrison, C.; Adamson, D. H.; Cheng, Z.; Sebastian, J. M.; Sethuraman, S.; Huse, D.
A.; Register, R. A.; Chaikin, P. M. Mechanisms of Ordering in Striped Patterns,
Science 2000, 290,1558–1560.
(40) Darko, C.; Botiz, I.; Reiter, G.; Breiby, D. W.; Andreasen, J. W.; Roth, S.V.; Smilgies,
D. M.; Metwalli, E.; Papadakis, C.M. Crystallization in Diblock Copolymer Thin
Films at Different Degrees of Supercooling, Phys. Rev. E. 2009, 79, 041802.
(41) Vasilev, C.; Reiter,G.; Pispas,S.; Hadjichristidis, N. Crystallization of Block
Copolymers in Restricted Cylindrical Geometries, Polymer 2006, 47, 330–340.
(42) Reiter, G.; Castelein,G.; Sommer, J. U.; Röttele, A.; Thurn-Albrecht,T. Direct
Visualization of Random Crystallization and Melting in Arrays of Nanometer-Size
Polymer Crystals, Phys. Rev. Lett. 2001, 87, 226101.
(43) Rodrıguez, T. R.; Garcıa, R. Theory of Q Control in Atomic Force Microscopy, Appl.
Phys. Lett. 2003, 82, 4821– 4823.
27
28 For Table of Contents use only.
Before After Fully crystallized
Melt phase Melt phase