Int. J. Electrochem. Sci., 6 (2011) 717 - 726
International Journal of
ELECTROCHEMICAL
SCIENCE
www.electrochemsci.org
Copper Nano-composite Potentiometric Sensor
Mohammad Reza Ganjali1,*, Tahereh Poursaberi2, Mehdi khoobi3, Abbas Shafiee3, Mina Adibi4, Morteza Pirali-Hamedani3 and Parviz Norouzi1
1
Center of Excellence in Electrochemistry, Faculty of Chemistry, University of Tehran, Tehran, Iran
2
Instrumental Analysis Department, Research Institute of Petroleum Industry, Tehran, Iran
3
Department of Medicinal Chemistry, Faculty of Pharmacy, Tehran University of Medical Sciences, Tehran, 14176, Iran
4
Specialty Chemicals Research Department, Chemical and Petrochemical Division, Research Institute of Petroleum Industry, RIPI, Tehran, Iran
*
E-mail: [email protected]
Received: 29 January 2011 / Accepted: 9 February 2011 / Published: 1 March 2011
Preliminary conductometric study of interaction between 7-hydroxy-3-(2-methyl-2,3-dihydrobenzo[d]thiazol-2-yl)-2H-chromen-2-one (L) and some common cations in acetonitrile solution was shown a selective complexation between L and copper ions in comparison with other metal ions. Thus, L was used as a good sensing material in copper nano-composite carbon paste sensor. Nano-composite paste contained multi-walled carbon nanotubes (MWCNTs), nano-silica, and ionic liquids which they used for obtain a better sensor response. The proposed potentiometric sensor showed a stable potential response to Cu2+ ions with Nernstian slope of 29.6±0.3 mV decade-1 over a wide linear concentration range of 7.9×10⁻⁷-1×10⁻¹ mol L-1. The sensor was found to have a short response time of 13 s and to have an acceptable life time of about two months. The application of the sensor to the analysis of copper in waste water samples lead to acceptable results.
Keywords: Potentiometry, sensor, multi-walledcarbon nanotubes, copper, carbon paste, ion selective electrode, ionic liquid
1. INTRODUCTION
processes in various materials such as water, biological, environmental, medical and industrial samples plays a significant role.
Common analytical techniques used to this end, such as atomic absorption spectrometry (AAS), UV–Vis spectrometry and inductively coupled plasma atomic emission spectrometry (ICP-AES), are time-consuming, involving rather complex sample preparation routes, or are too expensive. Potentiometric methods using a selective indicator electrode offer advantages of simplicity both with respect to sample preparation and measurement technique, low cost, selectivity, accuracy and speed. This has made the methods a candidate for several applications in different fields [3].
Carbon pastes are found to act as useful materials for the fabrication of sensors and biosensors because of their preparation, the versatility of chemical modification, and rapid renewal of electrode surfaces based on them [4-11].
Furthermore, nano-silica-based materials are robust inorganic solids displaying both high specific surface areas (200-1500 m2 g-1) and a three-dimensional structures composed of highly open spaces interconnected to each other, which can imparts high diffusion rates of selected target analytes to a large number of accessible binding sites, in case they are used in sensing composites [12]. This in turn is a definite key factor in designing sensing devices with high sensitivity.
Recently, MWCNTs have also been used in composition of carbon paste electrodes [6,7,13-15] recently, due to their interesting and extraordinary physicochemical properties, including their ordered structure, high aspect ratio and surface are, very low weight, high thermal as well as electrical conductivity and mechanical strength.
Ionic liquids (ILs) are salts with relatively low melting points (below 100 °C). Ionic liquids have advantages of good solvating properties, high conductivity, non-volatility, low toxicity and good electrochemical stability.
The advantages of ILs that make them useful as a binder in carbon paste electrodes (CPEs) are their chemical stability, low vapor pressure, low toxicity, low melting temperature, high ionic conductivity and good electrochemical and thermal stability [16,17].
Based on the observations made on the selectivity of L towards Cu2+ ions, during conductometric studies performed in acetonitrile solutions of different metallic ions, we concluded that it could be in construction of Cu2+ carbon paste electrodes modified by MWCNTs and nano-silica to achieve the better electrode response. The resulting electrodes were successfully used in the analysis of Cu2+ ion content of waste water samples.
2. EXPERIMENTAL SECTION
2.1. Apparatus
2.2. Reagents
Ionic liquid (1-n-butyl-3-methylimidazolium tetrafluoroborate ([bmim]BF4), graphite powder
with a <50 μm particle size (Merck), and 2.2 g/cm3
density; and the paraffin oil (Aldrich) were of high purity and were used for the preparation of the carbon pastes. The multi-walled carbon nanotubes (MWCNTs) with 10-40 nm diameters, 1-25 μm length, core diameter: 5-10 nm, SBET: 40-600 m2/g, Vtotal: 0.9 cm3/g, bulk density 0.1 g/cm3, true density 2.1 g/cm3 and with 95% purity were purchased
from a local supplier (Iran). The nanosilica used was Wacker HDK® H20 with BET surface of the hydrophilic silica of 170-230 m2/g, Vtotal: 0.81 cm3/g and tamped density 40 g/lit.
The sensing material, 7-Hydroxy-3-(2-methyl-2,3-dihydrobenzo[d]thiazol-2-yl)-2H-chromen-2-one (L)
O O
N H S
HO
Figure 1. Chemical structure of the used sensing material
was synthesized as followed:
To a cold mixture of salicylaldehyde derivatives (0.2 M) and ethylacetoacetate (0.2 M), 2 ml of piperidine was added by rapid stirring. After 20 min the yellowish solid separated was filtered off subsequently washed with ethanol and was recrystallised from water:ethanol (3:7), yields was 83.6-95%. To a mixture of 3-acetylcoumarins (10 mmol) and 2-aminothiophenole (12 mmol) were added catalytic amount of AcOH. The mixture was irradiated with microwaves at 150 ºC (internal probe) for 3×5 minutes. Similar procedure can be performed in reflux conditions for 24 h. The progress of reaction was followed by TLC. After completion of the reactions, mixture was cooled and the precipitated solid was filtered off and washed with Et2O. Further purifications were done by
crystallization from EtOH.
Yellow solid (2.89 g, 93%); m.p. 101-103 °C; 1H NMR (500 MHz, DMSO-d6) ; 1.95 (s, 3H,
2-CH3 benzothiazoline), 4.36 (s, 1H, NH), 6.57 (t, J = 7.5 Hz, 1H, H6 benzothiazoline), 6.70 (d, J = 7.7
Hz, 1H, H4 benzothiazoline), 6.73 (s, 1H, H8 Coumarin), 6.77 (d, J = 8.5 Hz, 1H, H6 Coumarin), 6.87
(t, J = 7.7 Hz, 1H, H5 benzothiazoline), 6.92 (d, J = 7.5 Hz, 1H, H7 benzothiazoline),7.00 (s, 1H, H4
Coumarin), 7.56 (d, J = 8.5 Hz, 1H, H5 Coumarin), 10.59 (s, 1H, OH); 13C NMR (125 MHz,
DMSO-d6); 19.0, 76.2, 102.1, 110.0, 111.2, 113.9, 119.4, 121.4, 125.6, 126.5, 128.2, 130.5, 137.5, 146.2,
154.9, 160.0, 161.6; IR (KBr, cm-1) max: 3343 (NH), 3052, 2912, 1704 (C=O), 1607, 1557, 1464; MS,
m/z (%) 311 (M+, 25), 296 (100), 150 (8), 109 (7). Anal. calcd for C17H13NO3S: C, 65.58; H, 4.21; N,
2.3. Preparation of the Carbon Paste Electrodes (CPEs)
Various amounts of L and appropriate amounts of graphite powder, nano-silica, MWCNTs paraffin oil or ionic liquid were thoroughly mixed and transferred into a glass tube of i.d. 5 mm and a height of 3 cm. While the paste was being packed into the tube tip special care was taken to avoid possible air gaps which can increase the electrode resistance. A copper wire was then inserted into the opposite end of tube to act as an electrical contact. The external electrode surface was finally smoothed with soft abrasive paper to form a new surface. Prior to any application the electrode was conditioned for 24 h by soaking in a 1.0×10⁻³ M Cu(NO3)3 solution.
2.4. Emf measurements
Measurements of Emf were made using an electrochemical cell as follows:
Ag, AgCl(s), KCl (3 M) || sample solution | carbon paste electrode
And the calibration graph was drawn by plotting the potential, E, versus the logarithm of the copper ion concentration.
3. RESULTS AND DISCUSSIONS
Selectivity of a certain ion-selective sensor is highly dependent on the structure and nature of the ionophore incorporated in its composition [18-26]. Presence of donor atoms in structure of L, it was expected to have good interactions with mono, di and trivalent metal ions, and so this phenomenon was studied through conductometric studies in acetonitrile solutions containing each cation [27,28]. The results revealed L have a tendency to selectively interact with Cu2+ ions. This meant that it might also act as a suitable ion carrier in a Cu2+-selective CPE.
3.1. CPE composition
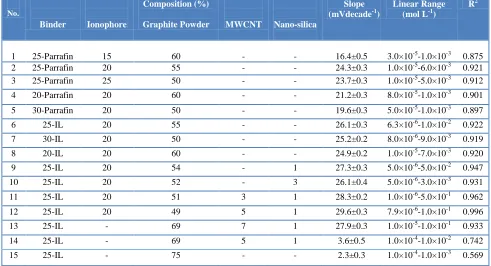
Various CPE compositions were prepared and the results of the application of each are shown in Table 1.
The results revealed that the best unmodified CPE (where unmodified means lacking MWCNTs and/or nano-silica and/or ionic liquids), (CPE No. 2), shows a near Nernstian slope about 24.3 mV decade-1.
[image:5.596.53.544.194.460.2]
Addition of MWCNTs to the CPE compositions was found to improve the conductivity of the sensor, and increase its transduction of the chemical signal to electrical signal. Improvement in the conductivity of CPEs, can further improve the dynamic working range of the sensor, and this is clearly seen in composition No. 12 (Table 1).
Table 1. The optimization of the carbon paste ingredients
Nano-silica is also known to improve the response of CPEs, if used as filler compound, due to its high specific surface area that helps extraction of the ions into the surface of the CPE. Furthermore, the application of nano-silica in CPE compositions can lead to enhancements in the mechanical properties of the electrodes [7].
The results in Table 1 show that modified CPEs comprising 1% nano-silica, 5% MWCNT, 20% L, 25% IL and 49% graphite respond the best (CPE No. 12).
To validate the key role of L in introducing selectivity and sensitivity to the CPE, two blank compositions lacking L, while including the rest of the ingredients in the optimum amount were prepared (CPE Nos. 14 & 15), and were found have no acceptable responses.
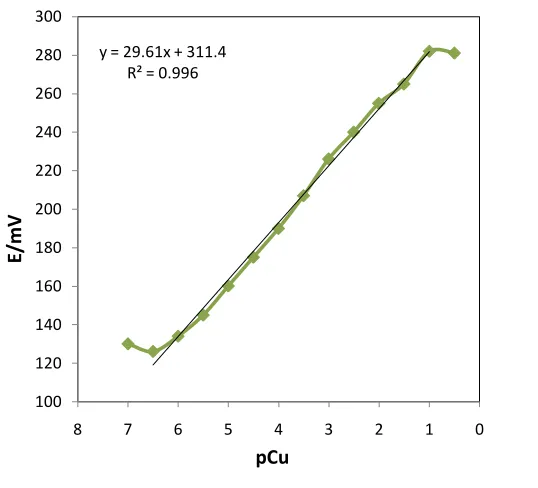
3.2. Calibration curve
The concentration range in which a selective electrode produces linear response, is among the key features of these devices, and is usually considered to be the linear part of the calibration graph [29-32]. The measuring range of the electrode with the optimum composition is shown in Fig. 2. The applicable measuring range of the modified sensor as shown in Fig. 2 is between 1.0×10⁻⁶-1.0×10⁻¹ M.
No.
Binder Ionophore
Composition (%)
Graphite Powder MWCNT Nano-silica
Slope (mVdecade-1)
Linear Range (mol L-1)
R2
1 25-Parrafin 15 60 - - 16.4±0.5 3.0×10⁻⁵-1.0×10⁻³ 0.875
2 25-Parrafin 20 55 - - 24.3±0.3 1.0×10⁻⁵-6.0×10⁻³ 0.921
3 25-Parrafin 25 50 - - 23.7±0.3 1.0×10⁻⁵-5.0×10⁻³ 0.912
4 20-Parrafin 20 60 - - 21.2±0.3 8.0×10⁻⁵-1.0×10⁻³ 0.901
5 30-Parrafin 20 50 - - 19.6±0.3 5.0×10⁻⁵-1.0×10⁻³ 0.897
6 25-IL 20 55 - - 26.1±0.3 6.3×10⁻⁶-1.0×10⁻² 0.922
7 30-IL 20 50 - - 25.2±0.2 8.0×10⁻⁶-9.0×10⁻³ 0.919
8 20-IL 20 60 - - 24.9±0.2 1.0×10⁻⁵-7.0×10⁻³ 0.920
9 25-IL 20 54 - 1 27.3±0.3 5.0×10⁻⁶-5.0×10⁻² 0.947
10 25-IL 20 52 - 3 26.1±0.4 5.0×10⁻⁶-3.0×10⁻³ 0.931
11 25-IL 20 51 3 1 28.3±0.2 1.0×10⁻⁶-5.0×10⁻¹ 0.962
12 25-IL 20 49 5 1 29.6±0.3 7.9×10⁻⁶-1.0×10⁻¹ 0.996
13 25-IL - 69 7 1 27.9±0.3 1.0×10⁻⁵-1.0×10⁻¹ 0.933
14 25-IL - 69 5 1 3.6±0.5 1.0×10⁻⁴-1.0×10⁻² 0.742
Extrapolating the linear parts of the calibration curve in Fig. 2, the detection limit of the CPE was calculated to equal 7.9×10⁻⁷ M.
y = 29.61x + 311.4 R² = 0.996
100 120 140 160 180 200 220 240 260 280 300
0 1 2 3 4 5 6 7 8
E/
m
V
[image:6.596.163.432.161.405.2]pCu
Figure 2. The calibration curve of Cu2+ modified CPE (CPE No. 12)
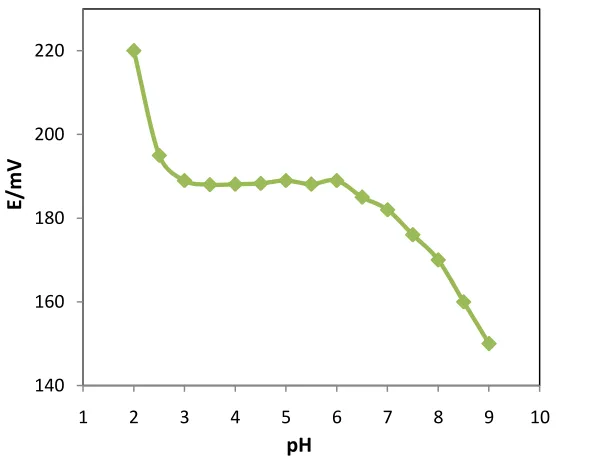
3.3. pH effect on the electrode response
To monitor the effect of the pH of the test solution on the potential response of the CPE, the potentials of electrodes with the best composition were measured for a fixed concentration of Cu2+ ion solution (1.0×10⁻⁴ M) at varying pH values. The pH of the solution was alerted from (2-9) by adding concentrated HNO3 or NaOH, to avoid volume changes. The potential variation as a function of pH is
plotted in Fig. 3. As it is seen the electrode potential is pH-independent in the range of 3-6.0. The electrode can therefore be used in this pH range. The fluctuations above the pH value of 6.0 might correspond to the formation of the soluble and insoluble Cu2+ -hydroxy complexes in the solution. And the fluctuations below the pH value of 3 can be attributed to the partial protonation of the employed ligand [21,25].
3.4. Response time
to reach a cell potential of 90% of the corresponding equilibrium values, upon successive immersions in a series of solutions, each having a 10-fold concentration difference [33-36]. The resulting potential–time responses for the mentioned electrode were obtained in the concentration range of 0.000001 to 0.1 M (the concentrations were altered by rapid injection of μL-amounts of a concentrated solution of Cu2+ to dilute solutions of the target ion). Results revealed that the potentiometric response time of the average electrode is about 13 s in whole concentration range.
140 160 180 200 220
1 2 3 4 5 6 7 8 9 10
E/
m
V
[image:7.596.163.467.215.445.2]pH
Figure 3. pH effect on the potential response of Cu2+ modified CPE (CPE No. 12)
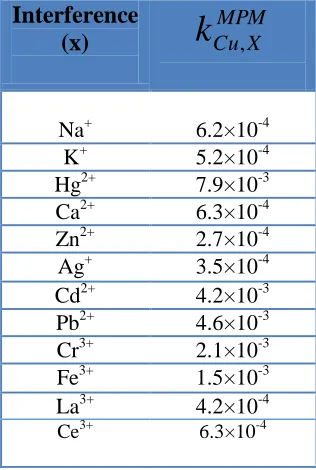
3.5. Interference studies
To evaluate the potentiometric selectivity coefficients, which describe the preference of the target ion in comparison to the other ions present in the solution, the matched potential method (MPM) [37-39] was used. MPM is recommended by IUPAC to overcome the difficulties associated with the methods based on the Nicolsky–Eisenman equation. According to the route, a specified activity (concentration) of the primary ion is added to a reference solution (0.000001 M copper nitrate, in this case) and the potential is measured. In a separate experiment, interfering ions (X) are successively added to an identical reference solution, until the measured potential matched that obtained before the addition of the primary ions. The matched potential method selectivity coefficient,
k
CuMPM,X is thengiven by the resulting primary ion to the interfering ion activity (concentration) ratio,
MPM X Cu
Table 2. The selectivity coefficients of various interfering cations for the CPE No. 12 in pH=3.5.
3.6. Lifetime
The lifetime of the CPE was monitored by periodically recalibrating the potentiometric response to Cu2+ ion in standard copper nitrate solutions.
After the conditioning step, the electrode was repeatedly calibrated three times during a period of one month, and no significant changes in the performance of the electrode were observed. This shows that the lifetime of the proposed electrode was about two months [37-39].
3.7. Analysis of copper in waste water sample
To assess the applicability of the electrode to real sample analyses, it was applied to the determination of copper ions in waste water samples.
Table 3. Determination of Cu2+ in waste water samples; the results are based on triplicates measurements.
Sample Cu2+ ion concentration (M)
CPE ICP-AES
1 5.2±0.5×10⁻⁴ 4.0±0.4×10⁻⁴
2 5.4±0.3×10⁻⁴ 5.1±0.3×10⁻⁴
3 6.3±0.3×10⁻⁴ 6.0±0.4×10⁻⁴
4 4.7±0.5×10⁻⁴ 4.5±0.4×10⁻⁴
5 5.7±0.4×10⁻⁴ 5.6±0.3×10⁻⁴
Interference (x)
MPM X Cu
k
,Na+ 6.2×10⁻⁴ K+ 5.2×10⁻⁴ Hg2+ 7.9×10⁻³ Ca2+ 6.3×10⁻⁴ Zn2+ 2.7×10⁻⁴ Ag+ 3.5×10⁻⁴ Cd2+ 4.2×10⁻³ Pb2+ 4.6×10⁻³ Cr3+ 2.1×10⁻³ Fe3+ 1.5×10⁻³ La3+ 4.2×10⁻⁴
[image:8.596.131.464.629.757.2]
The analyses were performed by using the direct potentiometry calibration curve method. The results as given in Table 3, revealed to be consistent with those obtained through inductively coupled plasma atomic absorption spectrometry (ICP-AES). This validates the applicability of the CPEs for the selective determination of copper traces in the analyzed environmental samples.
4. CONCLUSION
A novel Cu2+ nano-composite CPE electrode based on MWCNT-Nanosilica-IL, was introduced. The sensing material was chosen for this purpose due to its affinity to copper ions, revealed through conductometric studies. The CPE composition was modified using MWCNTs and nano-silica to achieve a better electrode response. The sensor was found to be linear response over a wide concentration range with a Nernstian slope, and short response time of about 13 s. The present sensor can be used over the pH range of 3-6.0 and was successfully employed to detect copper ion in waste water samples.
References
1. R. K. Mahajan, T. P. S. Walia and K. Sumanjit, J. Health Allied Sci. 4 (2005) 1 2. U. Celik and J. Oehlenschlager, Food Control, 18 (2007) 258
3. J. Koryta and K. Stulik, Ion Selective Electrodes, Cambridge University Press, Cambridge (1983) 4. M. Javanbakht, A. Badiei, M. R. Ganjali, P. Norouzi, A. Hasheminasab and M. Abdouss, Anal.
Chim. Acta, 601 (2007) 172
5. F. Faridbod, M. R. Ganjali, B. Larijani, M. Hosseini and P. Norouzi, Mater. Sci. Eng. C, 30 (2010) 555
6. F. Faridbod, M. R. Ganjali, B. Larijani, P. Norouzi, Electrochim. Acta 55 (2009) 234
7. M. R. Ganjali, N. Motakef-Kazami, F. Faridbod, S. Khoee, P. Norouzi, J. Hazard. Mater. 173 (2010) 415
8. M. T. Shreenivas, B. E. K. Swamy, U. Chandra, S. S. Shankar, J. G. Manjunatha and B. S. Sherigara, Int. J. Electrochem. Sci., 5 (2010) 774.
9. H. R. Zare and N. Nasirizadeh, Int. J. Electrochem. Sci., 4 (2009) 1691
10.J. G. Manjunatha, B. E. K. Swamy, R. Deepa, V. Krishna, G. P. Mamatha, U. Chandra, S. S. Shankar and B. S. Sherigara, Int. J. Electrochem. Sci., 4 (2009) 662.
11.M. R. Ganjali, N. Motakef-Kazemi, P. Norouzi and S. Khoee, Int. J. Electrochem. Sci., 4 (2009) 906
12.A. Walcarius, Electroanalysis, 13 (2001) 701
13.M. Mazloum-Ardakani, H. Beitollahi, B. Ganjipour and H. Naeimi, Int. J. Electrochem. Sci., 5 (2010) 531
14.A. A. Ensafi and H. K. Maleh, Int. J. Electrochem. Sci., 5 (2010) 1484.
15.J. B. Raoof, M. S. Hejazi, R. Ojani and E. H. Asl, Int. J. Electrochem. Sci., 4 (2009) 1436.
16.M. V. B. Zanoni, E. I. Rogers, C. Hardacre and R. G. Compton, Int. J. Electrochem. Sci., 4 (2009) 1607.
18.M.R. Ganjali, T. Poursaberi, F. Basiripour, M. Salavati-Niasari, M. Yousefi, M. Shamsipur, Fresenius J. Anal. Chem. 370 (2001) 1091
19.M. R. Ganjali, P. Norouzi, F. Faridbod, M. Ghorbani and M. Adib, Anal. Chim. Acta, 569 (2006) 35
20.V. K. Gupta, R. N. Goyal and R. A. Sharma, Int. J. Electrochem. Sci., 4 (2009) 156
21.M. R. Ganjali, Z. Memari, F. Faridbod, R. Dinarvand and P. Norouzi, Electroanalysis, 20 (2008) 2663
22.V. K. Gupta and P. Kumar, Anal. Chim. Acta 389 (1999) 205
23.H. A. Zamani, M. T. Hamed-Mosavian, E. Hamidfar, M. R. Ganjali and P. Norouzi, Mater. Sci. Eng. C 28 (2008) 1551
24.V. K. Gupta, A. K. Jain, L. P. Singh and U. Khurana, Anal. Chim. Acta 355 (1997) 33 25.F. Faridbod, M. R. Ganjali and P. Norouzi, Int. J. Electrochem. Sci. 4 (2009) 1679 26.V. K. Gupta, A. K. Singh and B. Gupta, Anal. Chim. Acta 575 (2006) 198
27.M. R. Ganjali, M. H. Zargazi and A. Mohajeri, Polish J. Chem, 75 (2001) 743
28.M. R. Ganjali, A. Rouhollahi, A. R. Mardan and M. Shamsipur, J. Chem. Soc-Faraday Trans, 94 (1998) 1959
29.M. R. Ganjali, A. Alipour, S. Riahi and P. Norouzi, Int. J. Electrochem. Sci, 4 (2009) 1153 30.V. K. Gupta, R. Mangla and S. Agarwal, Electroanalysis 14 (2002) 1127
31.R. Prasad, V. K. Gupta and A. Kumar, Anal. Chim. Acta 508 (2004) 61
32.A. K. Jain, V. K. Gupta, L. P. Singh, P. Srivastava and J. R. Raisoni, Talanta 65 (2005) 716 33.V. K. Gupta, R. Ludwig and S. Agarwal, Anal. Chim. Acta 538 (2005) 213
34.A. K. Singh, V. K. Gupta and B. Gupta, Anal. Chim. Acta, 1 (2007) 171 35.S. K. Srivastava, V. K. Gupta, S. Jain, Electroanalysis 8 (1996) 938
36.F. Faridbod, M. R. Ganjali, L. Safaraliee, S. Riahi, M. Hosseini and P. Norouzi, Int. J. Electrochem. Sci, 4 (2009) 1419
37.F. Faridbod, M. R. Ganjali, B. Larijani, M. Hosseini, K. Alizadeh and P. Norouzi, Int. J. Electrochem. Sci., 4 (2009) 1528
38.M. R. Ganjali, H. Shams, F. Faridbod, L. Hajiaghababaei, and P. Norouzi, Mater. Sci. Eng. C 29 (2009) 1380
39.M. R. Ganjali, P. Norouzi, A. Atrian, F. Faridbod, S. Meghdadi, and M. Giahi, Mater. Sci. Eng. C, 29 (2009) 205