schemes
.
White Rose Research Online URL for this paper:
http://eprints.whiterose.ac.uk/148722/
Version: Published Version
Article:
Hopkin, D. orcid.org/0000-0002-2559-3581, Spearpoint, M. and Van Coile, R. (2018) The
J-value and its role in evaluating investments in fire safety schemes. Fire Technology, 54
(6). pp. 1547-1564. ISSN 0015-2684
https://doi.org/10.1007/s10694-018-0752-9
eprints@whiterose.ac.uk https://eprints.whiterose.ac.uk/ Reuse
This article is distributed under the terms of the Creative Commons Attribution (CC BY) licence. This licence allows you to distribute, remix, tweak, and build upon the work, even commercially, as long as you credit the authors for the original work. More information and the full terms of the licence here:
https://creativecommons.org/licenses/
Takedown
If you consider content in White Rose Research Online to be in breach of UK law, please notify us by
The J-Value and Its Role in Evaluating
Investments in Fire Safety Schemes
Danny Hopkin* ,Olsson Fire & Risk UK Ltd, Jactin House, 24 Hood Street, Manchester M4 6WX,UK;Department of Civil and Structural
Engineering, University of Sheffield, Sir Frederick Mappin Bldg, Mappin St, Sheffield S1 3JD,UK
Michael Spearpoint,Olsson Fire & Risk UK Ltd, Jactin House, 24 Hood Street, Manchester M4 6WX,UK;University of Canterbury, Christchurch, New Zealand
Ruben VanCoile,Ghent University, Faculty of Engineering and Architecture, Ghent, Belgium
Received:1 November 2017/Accepted:13 June 2018
Abstract. Fire safety engineers endeavour to ensure that a design achieves an ade-quate level of fire safety. For uncommon buildings, adeade-quate safety cannot be based on precedent and an explicit evaluation of the adequacy of proposed safety features may be required. Commonly, this requires demonstration that the residual risk asso-ciated with the design is as low as is reasonably practicable. In those situations, a measure for a safety scheme’s benefit relative to its cost is required, as more efficient safety schemes should be preferred over less efficient ones to maximize the number of lives saved under societal resource constraints. To this end, the J-value has been introduced in other engineering fields as a decision support indicator for assessing the efficacy of safety features. The J-value has been derived from societal welfare consid-erations (the Life Quality Index) and is adopted in the current paper for applications in fire safety engineering. It is demonstrated herein how the J-value can inform deci-sions on fire safety, and how it can provide a basis for assessing whether or not a proposed fire safety scheme should be implemented. Future work will focus on its implementation as a tool for assessing the benefit of real life fire safety scheme imple-mentations, such as sprinkler installations.
Keywords: Fire safety,Decision making,J-value,Cost–benefit analysis,Life quality index,Societal wel-fare
1. Introduction
1.1. Background
In developing fire safety designs, engineers endeavour to propose solutions that are cognisant of project goals and are delivered within often competing con-straints [1]. The most fundamental of these goals is ensuring that an adequate level of safety is achieved. Defining what is adequate under differing circumstances
* Correspondence should be addressed to: Danny Hopkin, E-mail: DannyJHopkin@hotmail.com https://doi.org/10.1007/s10694-018-0752-9
is not straightforward. The ability to articulate and quantify this most fundamen-tal goal is often the crudest facet of the fire safety design process [2].
For common buildings, for which experience of performance in real fires is comparatively plentiful, attainment of adequate safety can often be assumed to be achieved through the adoption of traditional deterministic evaluations. The sphere of deterministic evaluations in this context includes guidance, such as that in Approved Document B [3], BS 9991 [4], BS 9999 [5] (and other comparable inter-national guidance documents/codes), alongside deterministic performance based evaluations where performance in well-defined and well-understood situations is demonstrated through calculation methods. It is, however, critical to note that whilst adequate safety is assumed to be attained, the level of safety is not explic-itly quantified. The basis of acceptance is experience [6] and an apparent accep-tance with respect to the mortality rates that manifest over time [7].
For uncommon buildings, where there is comparatively limited experience of performance in real fires, adequate safety cannot be assumed to be attained on the basis of reliance on determinism [6]. In this context, an uncommon building might be differentiated as one that has atypical failure consequences, makes use of inno-vative materials/forms, or combines both. In such cases, the profession has not had an opportunity to learn from experience and converge upon methods, guid-ance, and tools that align with a society’s expectation for how uncommon cases should perform in the event of a fire. In these cases, an evaluation of the uncer-tainties associated with a given design problem are necessary to arrive at an ade-quate safety level and to inform what levels of investment in a safety scheme are justified. This can often only be achieved through probabilistic risk assessment (PRA).
The above distinction in how safety is (or should) be demonstrated for tradi-tional fire-engineering designs and exceptradi-tional designs is illustrated in Fig.1
through the ‘safe design triangle’. All sides of the safe-design triangle need to be properly considered in order to obtain a safe design, but while for traditional designs the entire triangle is supported by a basis or ‘safety foundation’ of the
[image:3.439.49.396.441.584.2]lective experience of the profession, this is not the case for exceptional designs and new (innovative) applications. In those situations, the combination of the different sides of the triangle can only be considered to result in an adequately safe design through an explicit evaluation of the safety level (i.e. quantified safety founda-tion).
1.2. PRA in Fire Safety Engineering
Fire, by its very nature, is an uncertain phenomenon, both in terms of the factors influencing its occurrence, and also subsequently how it manifests and behaves. Whilst PRA may be seen as an ongoing area of research in fire safety engineering [8], it is apparent that it is fundamental to the fire safety discipline’s progression and maturity. Allied to this, the need for objective cost–benefit analysis (CBA) tools to inform fire safety investments is clear in the current climate, where wide ranging legislative changes are currently under consideration.
Guidance relating to the application of PRA in the UK can be found in the form of PD 7974-7 which is currently subject to revision [9], and in associated textbooks [10]. Much of this guidance relates to the familiar principle of ALARP which is a means through which adequate performance of a safety scheme might be shown by demonstrating that the residual risk is reduced ‘as far as is reason-ably practicable’, ALARP (Fig.2). For a risk to be ALARP, it must be possible to demonstrate that the cost involved in reducing the risk further would be grossly disproportionate to the benefit gained [11]. That is, ALARP requires in some manifestation, a cost–benefit analysis. Note that the ALARP concept has specific legal meaning in particular countries but in the discussion here the ALARP prin-ciple relates to the generally applicable realisation (as in ISO2394:2015 [12]) that societal resources for safety investments are limited, and consequently, that a
[image:4.439.107.334.400.564.2]sonable (efficiency-informed) decision must be made when deciding on which safety schemes to implement.
It is, of course, plausible to make a safety scheme so conservative that it is acceptable without the need to demonstrate ALARP (i.e. within the de minimis region of Fig.2). However, this prospect must be considered in the context of the finite time, effort and money that can reasonably be expended to converge on something close to zero residual risk. That is, in most cases, demonstrating ALARP would be necessary.
In the process of demonstrating ALARP, it will be necessary to objectively compare the benefits realised from a safety scheme, relative to the investments associated with its implementation. In the following, the ability of a fire safety scheme to contribute to fulfilling the ALARP principle is evaluated based upon a cost–benefit analysis, leading to a cost–benefit scalar defined as the judgement value or J-value.
The process involved in arriving at a fire safety variant of the J-value is dis-cussed in the sections that follow and has been developed from literature pub-lished by the originators of the J-value concept [13].
2. Development of the J-Value
2.1. Cost Optimisation in Cost–Benefit Analysis
As is discussed above, the ALARP condition requires cognisance of the safety investment, and the associated benefits. The cost–benefit formulation can be con-ceptually represented by Eq.1, based upon comparable structural engineering applications by Rackwitz [14] such that
DZ pð Þ ¼D0ð Þp C pð Þ D1ð Þp ð1Þ
whereDZis the change in total (lifetime) utility as a result of the proposed safety scheme (and denominated in the same currency as D0, C and D1), D0is the
base-line failure costs prior to the investment in the scheme, Cis the cost of the safety scheme, and D1 is the failure cost post implementation [15]. All parameters are a
function of a decision parameter,p. The formulation in Eq.1 starts from the con-sideration that the investigated building will be built, and that an assessment must be made regarding the efficiency of additional safety features. This formulation conforms with current fire safety engineering practice, where the need for fire safety features is investigated given design constraints, and has the advantage that the utility of a building’s existence must not be assessed as part of the equation.
For a safety investment to be viable, the change in utility must be positive. Considering the above, Eq.1 can be recast as
CBI pð Þ ¼ C pð Þ D0ð Þp D1ð Þp
¼ C pð Þ
where, CBI pð Þ (the investment cost-to-benefit indicator in function of the safety decision parameter) is simply a measure of the investment costs relative to the benefits (i.e. failure cost reduction) realised and DD pð Þ is the net benefit of the safety scheme. If CBI pð Þ<1.0, the safety investment has a net benefit to society
and, thus, should be considered. To the contrary, CBI pð Þ >1.0 would infer the
safety investment leads to a net dis-benefit as the investment costs outweigh the fire safety benefits. If the CBI pð Þ equals unity (i.e. effectively cost-neutral), there should still be an expectation to invest in the safety scheme.
The constituents in Eqs.1 and2 would typically be associated with uncertainty, i.e. both D0and D1are dependent upon the frequency associated with fire
occur-rence, and also the consequences of fire occurrence which can manifest in a num-ber of different ways.
2.2. The Life Quality Index (LQI)
The derivations above have introduced the J-value decision indicator in general terms (via the CBI), considering uncertain future fire-induced losses. The valua-tion of the benefit derived from investing in fire safety measures is however not without sensitivity. The intended benefit of implementing a safety measure is typi-cally, at a minimum, improving life expectancy. In the literature, numerous diffi-culties are documented with respect to the valuation of a preventable fatality (VPF) [16, 17]. Thomas and Waddington [16] suggest that the value of healthy life can be determined through peoples revealed preferences. For example, through surplus pay paid to workers facing specific risks. Sunstein [17], however, empha-sises the large variations in ‘observed’ VPF with respect to gender, race and social status. Arguably, these kinds of discrepancies cannot readily be used as a basis for societal decision-making on safety, and it can be questioned to which extent revealed preferences are determined by the available information and the bounded rationality of normal people [17] as opposed to perfectly rational economic actors.
In situations without revealed preferences, refuge has been sought with ‘stated preferences’ [16], but also this methodology faces specific difficulties such that the stated preferences cannot be considered independent from the specific scenarios used in the preference survey. Consequently, it is not possible to apply the obtained ‘stated’ VPF for risk-based decision-making in other fields [17].
Most importantly, real designs have safety features which benefit all of its users and thus aggregate (societal) VPF are needed. In other words, the question is how much society is willing (or capable) to spend to prevent the fatality of an unde-fined member of society.
Nathwani et al. [18] introduced the LQI as a means of quantifying the utility asso-ciated with different decision options. The LQI is now a widely applied tool for decisions on life safety investments, as recognised by its inclusion in the recent international standard ISO2394:2015 [12].
The LQI (Q), as proposed in Nathwani et al. [18], is expressed as
Q¼GqX ð3Þ
whereGis the societal wealth, as measured by GDP per capita, and Xis the (dis-counted) life expectancy. The exponent q represents work-life balance. After its initial introduction from conceptual considerations, the life quality index has been re-derived from economic principles by Pandey et al. [19]. Considering this deriva-tion, the exponent q is described by Eq.4, with b the Cobb–Douglas elasticity constant and w the (optimum) fraction of time spent working in an average per-son’s lifetime
q¼b w
1 w ð4Þ
It is assumed that developed societies have, over time, converged to a close-to-op-timal work-leisure balance w. Thus, w in Eq.4 is generally evaluated from observed values. Based on this assumption, Pandey et al. [19] specifyq as approxi-mately 0.16 in a western European context and 0.20 in a northern American con-text. Similar studies specific to the UK by Thomas et al. [20] recommended q as 0.183 in 2010. Decision results are in general not sensitive to the precise value ofq
and therefore changes ofq over time do not need to be taken into account explic-itly [19]. A recent study [21] validating the J-value approach, however, highlights the importance of a thorough assessment, indicating higher than previously con-sidered monetary valuations for life safety risk reductions. The implications of the recent study will be investigated in future work. Figure3 compares LQI values by nation according to [22].
2.3. LQI and J-Value
2.3.1. Societal Willingness to Pay Returning to Eq.2, the costs of implementing a safety measure (C) are often reasonably well defined. However, the benefits, par-ticularly in terms of improving the life expectancy of the scheme’s beneficiaries, can be more challenging to quantify. In this case, the LQI is adopted.
Considering the effect of a proposed safety scheme on the LQI, the implementa-tion of the safety scheme results in a new value of the life quality index (Q0 =
Q+DQ) as specified by Eq.5, withDG the reduction in GDP per capita associ-ated with the implementation of the safety scheme andDX the associated increase in life expectancy
Q0¼QþDQ¼ðGþDGÞqðX þDXÞ ð5Þ
Q0¼QþDQ¼Gq 1þDG G
q
XþDX
ð Þ ð6Þ
which for small changes (i.e. DG and DX small) reduces to the already existing formulation [13]
DQ Q ¼q
DG G þ
DX
X ð7Þ
For the safety measure to be viable, the change in LQI (DQ=Q) must be positive. This requirement of Eq.7 being positive is commonly referred to as the ‘LQI net benefit criterion’ [18].
Evaluating the maximum cost for which a given safety scheme is of benefit to society, DQ can be (in the limit) equal to zero, and Eq.7 can be rewritten as in Eq.8, where—dDf is the maximum per capita investment for a given safety
scheme which results in a net benefit to society.
qDG G þ
DX
X ¼0) DG¼ 1 qG
DX
X ¼ dDf ð8Þ
0 50 100 150 200 250
LQ
I
NaƟon
[image:8.439.44.401.70.299.2]Practically, estimating DX/X is difficult for a particular hazard. After Rackwitz [14] and Nathwani et al. [18] the change in life expectancy DX due to a safety regime can be estimated as being in proportion with the change of mortality rate
dm with the proportionality constant Cx specific to a given demographic profile
such that
DX
X Cxdm¼ Cx Df
N ð9Þ
withDfthe change in annual expected number of fatalities arising from the safety measure (per annum) for a population of sizeNaffected by the particular hazard (the population N could be applied at a building or societal level, depending upon the nature of the problem investigated, e.g. a specific building design vs. regula-tory change) that is sought to be mitigated. Thus combining Eqs.8 and9yields
dDf
G q
CxDf
N ð10Þ
This is the maximum per capita investment in a given safety scheme to prevent risk to life that is in agreement with society’s capacity to pay. Considering the (ex-pected) annual aversion of a single fatality (Df=-1), and aggregating the per
capita maximum investment to the total societal maximum investment by multipli-cation with N, results in a total societal willingness to pay (per annum) for a safety scheme that averts a single fatality (per annum). As the ‘per year’ valua-tions cancel each other, the above results in a life quality index-based valuation of a proportionality constant, societal willingness to pay (SWTP), to be used in the valuation of risk to life, as in [15]:
SWTP GCx
q ð11Þ
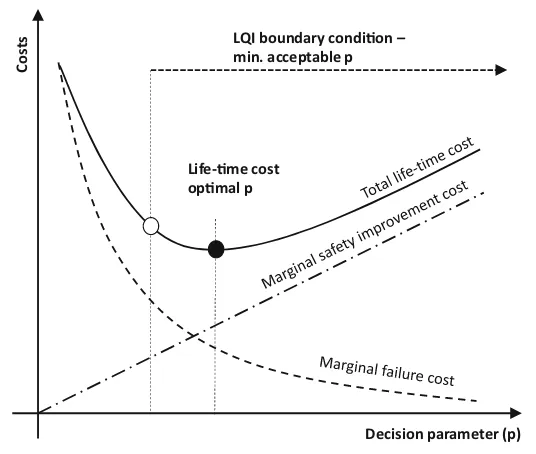
Values for the SWTP for different discounting rates and mortality reduction schemes can be found in standards such as ISO 2394 (extracts in Table1). Therein, the SWTP is applied as part of an LQI based boundary condition for monetary optimisation, as indicated in Fig.4.
Figure4indicates the relationship between a safety investment decision parame-ter (p), the impact gradual increases in p has on both the marginal safety invest-ment costs and the marginal failure costs, and also the total life-time cost. The LQI condition, considered in isolation of other safety investment benefits, presents a lower bound for the minimum justified value ofp. However, as is indicated, this might not be the optimal value, as other benefits are often realised through invest-ment in safety schemes.
and their consequences are subject to uncertainty, and differing valuations by soci-etal and private stakeholders.
[image:10.439.41.401.117.231.2]Individual organisations may wish to apply their own risk aversion to the change in monetary losses/costs associated with damage, loss of assets, and injury depending on their capacity to accept such losses. With respect to life safety, soci-etal considerations result in a lower bound for investments in life safety [12, 23] .
Table 1
SWTP for a Selection of Nations Based on 2008 GDP Per Capita, with Differing Mortality Reduction Schemes and Discount Rates: Values in Thousands (Purchasing Power Parity, PPP) $US [12]
Country
SWTPp—life risk reduction is associated with a proportional change in mortality across the age
distribution
SWTPD—change in mortality due to life risk reduction is uniformly distributed across the age
distribu-tion
2% 3% 4% 2% 3% 4%
UK 2600 2178 1873 4105 3665 3270
USA 2488 2100 1822 3187 2833 2542
Australia 3061 2614 2279 4840 4298 3843
India 128 110 93 175 156 139
Decision parameter (p)
Costs
LQI boundary condion – min. acceptable p
Life-me cost opmal p
[image:10.439.86.354.258.485.2]Societal life safety considerations thus taken into account, the total judgement value (or JT) is expressed as Eq. 12
JT ¼
C MRDDeþDDf
ð12Þ
whereMR is a risk scalar (-) resulting from risk aversion in an organization’s
deci-sion making [24],DDe is the change in losses/costs associated with damage, loss of
assets, and injury, and DDf is the safety investment that is warranted to protect
the lives of N people. For further discussion and derivation of the JT equation,
reference is made to [24,25,26].
As discussed by Nathwani et al. [18], decision making for society-wide life safety investments necessitates risks to life to be evaluated equitably across popu-lation groups and risks. For risks without the possibility of ruin, as is the case for fire safety investments in the built environment where the occurrence of fire is, on a larger scale, independent between buildings, this implies that MR can be taken
equal to unity. For private organizations, where possible consequences are large (e.g. comparable with its total assets), the valuation for MRwill be higher as the
acceptability of high consequences is, in relative terms, lower than more frequent low consequence events. As noted above, here MR= 1 considering societal
deci-sion-making where the tolerability of consequences is explicitly confirmed prior to the ALARP assessment, and where no qualitative distinction is made between tol-erable consequences in function of their magnitude, see [27]. This leads to
JT ¼
C DDeþDDf
ð13Þ
In the first instance, it is assumed that the only motivation for and quantifiable benefit of a safety scheme is to improve life expectancy. That is, DDe¼0. For a
fire safety application, the J-value is then simply derived from Eq.10, as shown below
Jfi¼
C DDf
¼q G
C CxDf
¼ C
SWTPDf ¼
C
SWTPkigN kf;0 kf;1
ð14Þ
withkig the annual fire occurrence probability [y
-1
], andkf;0 and kf;1 the per
per-son probability of a fire induced fatality given fire occurrence, before and after implementation of the safety scheme, respectively.
scheme. The original formulation has been augmented with additional terms in Eq.14that are specific to application in fire safety schemes.
It is relevant to note that in the formulation of Eq.14 the cost C of the safety scheme is evaluated on an annual basis. If a large upfront cost is associated with the safety scheme, or if large maintenance is required periodically, discounting is required to evaluate the cost and benefits for the J-value on the same basis. This will be discussed further in Sect.3.3.
3. Inclusion of Other Fire Safety Benefits and Discounting
3.1. Injury and Damage
In the original proposal for the J-value by Thomas et al. [16], the viability of a safety scheme is evaluated purely in terms of its ability to improve (discounted) life expectancy. Commonly, other benefits are realised after the introduction of a safety measure. Non-exhaustively these might include a reduction in injury or the mitigation of damage. This differentiation leads to the total judgement value [26], as previously introduced in Eq.10. The starting position is, therefore, that the net benefit of the safety measure (DD) comprises three terms, with DDi the utility
associated with the change in expected injury rate,DDdthe utility in the change in
expected material damage rate in addition to the previously definedDDf, such that DD¼DDf þDDe¼DDf þDDiþDDd ð15Þ
In the case of injury, let Di be the reduction in the expected fire induced injury rate (per person, per annum) because of the safety investment, C. For a given injury in fire, a cost can be attributed. This cost represents the total equivalent monetary cost of the injury and thus includes e.g. medical costs, lost productivity, possible permanent disability and psychological distress. As, typically, the safety investment is taken to benefit a large population and, for any given fire, the nat-ure of the injury will not be known, an average cost per injury can be adopted for valuing the implications of a typical injury (fi). This leads to the utility associated
with the change in injury rate (DDi) for a population sizeN
DDi¼NDifi¼Nkigðki;0 ki;1Þfi ð16Þ
with ki;0 and ki;1 the probability of an individual suffering injury should a fire
occur (per fire) before and after the implementation of the safety scheme, respec-tively. This formulation assumes that the safety scheme mostly affects the rate of injuries, not the type of injury when an injury occurs.
Similarly, in the case of material damage, DDd can be defined as the change in
expected per fire damage costs
DDd ¼kig Dfd;0 Dfd;1
with Dfd;0 and Dfd;1 the expected material damage in the case of fire before and
after the implementation of the safety scheme, respectively.
Revisiting Eq.14, an alternative total judgement value emerges for fire safety applications, which will be defined asJfi,Tsuch that
Jfi;T ¼
C
DDf þDDiþDDd
ð18Þ
3.2. Renewal Process and Implications for Valuation of Damages
The valuation of losses due to fatalities, injury and damage are subject to uncer-tainty. In Eqs.14 to 17, the fire ignition rate (kig) is taken to correspond with
some consequence, in terms of expected fatalities, injury and damage. However, for each individual accident occurrence, the consequences are not known, and would vary significantly between events. This means the J-value, as noted in Eq.18 would fluctuate, making objective decision-making challenging on a case by case basis.
For societal decision-making, where the need for safety features is assessed con-ceptually considering a wide portfolio of buildings and continued future need of the public for these buildings, a renewal process is assumed where the building is restored or replaced (depending upon the post-fire outcome) to its pre-fire condi-tion after each fire event, as argued by Fischer [23]. Consequently, the building is exposed to the possibility of repeated fire occurrences. It is assumed that after each fire event the building is reinstated considering the same safety features as in the original design. Any losses are thus not a consequence of faulty designs or implementation, but are a manifestation of the residual risk inherent in each design. Fundamental derivations for renewal processes can be found in [30,31].
The implementation of Eq.18 may be on the basis of mean values in the con-text of societal-decision making (i.e. absent of private risk aversion multipliers, and/or a risk of ruin). That is, the ignition rate is normalised to a ‘per unit’ basis, as are the corresponding (mean) number of fatalities, injuries and damages, both before and after the implementation of a safety measure.
3.3. Inclusion of Discounting
As the safety investment relates to the reduction of future risk, the cost–benefit analysis (J-value in this case) requires that future costs and benefits incurred at different times are discounted to a common reference point, or annualised, using a (continuous) discount rate (c).
DDc¼ DD
c 1 e
cL
¼DDf þDDiþDDd
c 1 e
cL
ð19Þ
3.4. Implementation and Continuing Costs
While both annualised costs and a single upfront investment have been treated above, a more general formulation of the cost (C) considers an upfront sum (C0),
and depending on the particular scheme there may also be an ongoing annual cost (m) which is paid over its life (L). This cost can be expressed as
C¼C0þmc ð20Þ
wheremcis deduced via the common net present value calculation procedure:
mc¼ XL
t¼1
m 1þc
ð Þt
For a scheme that includes, say, a sprinkler system, then there will be installation and maintenance costs, whereas the application of a passive fire protection system may only incur an up-front increased construction cost.
3.5. Application of the J-Value to an Exemplar Scheme
To conceptually demonstrate the application of the proposals developed herein, the fire safety J-value is applied in the evaluation of the cost effectiveness of an exemplar fire safety scheme. This mitigates the need for specific discussions regarding the possible benefits and costs associated with a specific safety scheme, for example, sprinkler protection. Solely for the purpose of demonstration, arbi-trary but sufficiently reasonable input figures for the purpose of evaluating the viability of the safety scheme are provided in Table2.
Two assessments are carried out herein: Firstly, the analysis examines the soci-etal benefit of the exemplar system with the given inputs. Secondly, the maximum safety investment that might be justifiable for a given safety objective is investi-gated. In each case the Society Willing to Pay (SWTP) has been taken to be £2,500,000 per statistical life saved corresponding to a typical UK value from Table1.
For the societal benefit analysis, the derived quantities leading to the evaluation of the fire safety J-value are summarised in Table3. The resultant J-value demon-strates that, on the prerequisite that the absence of the safety scheme leads to a tolerable mortality rate, an investment in such a safety scheme would lead to a net dis-benefit to society. That is, the costs are circa 3 times the benefits when evalu-ated over the scheme’s life-time.
Table 2
Exemplar Fire Safety Scheme CBA Inputs
Input Symbol Metric Unit
Number of buildings that could be affected by fire Nunits 1,000,000 Units
Number of building fires (ignitions) Nfi 1500 Fires/year
Fatalities due to building fires prior to implementation of the safety scheme
Nkf;0 0.01 Person/fire
Injuries due to building fires prior to implementation of the safety scheme
Nki;0 0.33 Injuries/fire
Cost of injury prevented fi 20,000 £/injury
Average cost of damage to property per fire fd;0 10,000 £/fire
Reduction in fatalities due to safety scheme vf 90 %/fire
Reduction in injuries due to safety scheme vi 75 %/fire
Reduction in damage due to safety scheme vd 90 %/fire
Safety scheme upfront cost C0 2000 £
Maintenance cost per annum of safety scheme m 100 £
Discount rate c 3 %
Design life of safety scheme L 50 year
Table 3
Derived Quantities in CBA for the Societal Benefit of the Exemplar System
Derived quantity Symbol Derivation Metric Unit
Annual fire occurrence rate kig NNunitsfi 0.0015 Fires/
building/ year Fatalities due to building fires post
imple-mentation of the safety scheme
Nkf;1 Nkf;0 1 vf
0.001 Person/ig-nition Life preservation benefit DDf NSWTPkigkf;0 kf;1
33.75 £/year/ building Injuries due to building fires post
imple-mentation of the safety scheme
Nki;1 Nki;0ð1 viÞ 0.0825
Injuries/ig-nition Injury reduction benefit DDi Nkigðki;0 ki;1Þfi 7.43 £/year/
building Fire induced damage post implementation
of the safety scheme
Dfd;1 ð1 vdÞDfd;0 1000 £/fire
Damage reduction benefit DDd kig Dfd;0 Dfd;1
13.50 £/year/ building Benefit arising from safety scheme DD DDfþDDiþDDd 54.68 £/year/
building Discounted benefit over installation life,L DDc DDc¼DcDð1 e cLÞ 1415.85 £/building Discounted maintenance cost mc
PL
t¼1 m 1þc
ð Þt 2572.98 £/building
Costs of safety measure C c0þmc 4572.98 £/building
[image:15.439.48.399.339.576.2]the safety scheme is 100% effective, and the operational life of the safety measure is also 50 years. The maximum justifiable investment in the safety scheme (C), would arise whenJT,fi= 1.0 which is considered as an investment not leading to
a net dis-benefit to society.
Table4 shows the corresponding derived quantities where the result is that the justifiable investment would be circa £614 per building for the given safety objec-tive. If any such safety provision required maintenance, the upfront investment cost plus the discounted life-time maintenance cost would have to remain below £614 for the J-value not to exceed unity.
4. Conclusions
An implementation of the existing J-value [13] method has been developed for the assessment of the cost vs. benefits associated with fire safety investment schemes. The modified (fire safety) J-value is fundamentally consistent with the total judge-ment value presented in [26], and incorporates the costs associated with mortality, injuries and property damage, as well as accounting for the discounted costs of the implementation of a scheme. A conceptual application of the J-value is pre-sented to illustrate how the method can be used to assess the cost–benefit of an exemplar fire safety scheme and to then examine how the method can be used to determine the justifiable level of investment for a given set of fire safety goals.
[image:16.439.42.400.435.581.2]The fire safety J-value is also equivalent to the LQI-net-benefit criterion, as has been subject to investigations in fire safety engineering studies for evaluating specific safety schemes, e.g. sprinkler systems [29], variations in exit width [28], and structural reliability [23]. The formulation proposed herein is general and, as
Table 4
Derived Quantities in CBA for the Maximum Safety Investment Analysis
Derived quantity Symbol Derivation Metric Unit
Annual fire occurrence rate kig NNunitsfi 0.0015 Fires/building/
year Fatalities due to building fires post
implementation of the safety scheme
Nkf;1 N0:5kf;0 0.005 Person/ignition
Life preservation benefit DDf NSWTPkig0:5kf;0 18.7 £/year/building
Injuries due to building fires post implementation of the safety scheme
Nki;1 N0:5ki;0 0.167 Injuries/ignition
Injury reduction benefit DDi Nkig0:5ki;0fi 5.01 £/year/building
Benefit arising from safety scheme DD DDfþDDi 23.71 £/year/building
Discounted benefit over installation life,
L
DDc DDc¼DcD 1 e cL
ð Þ 613.99 £/building
such, may be applied to evaluate the efficacy of a range of fire safety schemes, and their associated realisation costs. The J-value is simple in its interpretation, i.e. a value less than or equal to unity implies a net-benefit to society as a result of investment in a particular fire safety scheme.
Unlike typical ALARP applications, the J-value is evaluated using an objective criterion for acceptance. (i.e. a value less than or equal to unity). That is, in the context of gross disproportion, whereby one invests in safety measures until the costs are significantly out of proportion with the benefits, the J-value provides a clearly defined proportionality condition, and is not reliant upon subjective judge-ments of authorities having jurisdiction.
Parallel complimentary studies [33] discuss a specific application of the J-value concept presented herein to sprinkler installations in single occupancy dwellings (i.e. houses), with results compared for differing jurisdictions (Wales, Australia and New Zealand). Further studies are planned to evaluate the merits of sprinkler installations to London high-rise buildings, as has been advocated in a recent pub-lication by the London Assembly [34].
Open Access
This article is distributed under the terms of the Creative Commons Attribution 4.0 International License (http://creativecommons.org/licenses/by/4.0/), which per-mits unrestricted use, distribution, and reproduction in any medium, provided you give appropriate credit to the original author(s) and the source, provide a link to the Creative Commons license, and indicate if changes were made.
References
1. Law A, Stern-Gottfried J, Butterworth N (2015) A risk based framework for time equivalence and fire resistance. Fire Technol 51(4):771–784. https://doi.org/10.1007/ s10694-014-0410-9
2. Hopkin D, Ballantyne A, O’Loughlin E, McColl B (2016) Design goals—fire resistance demands for tall residential buildings. In: Proceedings of Interflam 2016
3. DCLG (2006) Approved document B, volume 2—buildings other than dwelling houses. NBS for the Department for Communities and Local Government, London
4. BSI (2015) BS 9991:2015 Fire safety in the design, management and use of residential buildings. Code of practice. British Standards Institution, London
5. BSI (2017) BS 9999:2017 Code of practice for fire safety in the design, management and use of buildings. British Standards Institution, London
6. Hopkin D, Van Coile R, Lange D (2017) Certain uncertainty. SFPE, Europe Issue 07 7. Spinardi G, Bisby L, Torero J (2017) A review of sociological issues in fire safety
regu-lation. Fire Technol 53:1011–1037
8. Hadjisophocleous GV, Benichou N (1999) Performance criteria used in fire safety design. Autom Constr 8:489–501
10. Ramachandran G, Charters D (2011) Quantitative risk assessment in fire safety, 1st edn. Spon Press, London
11. Jones-Lee M, Aven T (2011) ALARP—What does it really mean?. Reliab Eng Syst Saf 96:877–882
12. ISO (2015) ISO 2394:2015. General principles on reliability of structures, International Standard
13. Thomas PJ, Stupples DW, Alghaffar MA (2006) The extent of regulatory consensus on health and safety expenditure. part 1: development of the J-value technique and evalua-tion of the regulators’ recommendaevalua-tions. Process Saf Environ Prot 84(5):329–336. https://doi.org/10.1205/psep.05005
14. Rackwitz R (2002) Optimization and risk acceptability based on the life quality index. Struct Saf 24:297–331
15. Van Coile R, Jomaas G, Bisby L (2017) Defining ALARP for fire safety engineering design via the life quality index. Fire Saf J—under review
16. Thomas P, Waddington I (2016). Review of the value of a prevented fatality (VPF) used by regulators and others in the UK. Nuclear Future
17. Sunstein CR (2005) Laws of fear. Beyond the precautionary principle. Cambridge University Press, Cambridge
18. Nathwani J, Lind NC, Pandey MD (1997). Affordable safety by choice: the life quality method. University of Waterloo
19. Pandey MD, Nathwani JS, Lind NC (2006) The derivation and calibration of the life-quality index (LQI) from economic principles. Struct Saf 28:341–360
20. Thomas PJ, Kearns JO, Jones RD (2010) The trade-offs embodied in J-value safety analysis. Process Saf Environ Prot 88(3):147–167. https://doi.org/10.1016/ j.psep.2010.02.001
21. Thomas P, Waddington I (2017) Validating the J-value safety assessment tool against pan-national data. Process Saf Environ Prot 112A:179–197
22. Rackwitz R, Streicher H (2002) Optimization and target reliabilities. Joint Committee on Structural Safety. JCSS Workshop on Code Calibration, Zurich
23. Fischer K (2014) Societal decision-making for optimal fire safety. Doctoral dissertation. ETH Zurich, Switzerland
24. Thomas PJ, Jones RD, Boyle WJO (2010) The limits to risk aversion. part 1: the point of indiscriminate decision. Process Saf Environ Prot 88(6):381–395
25. Thomas PJ, Jones RD, Boyle WJO (2010) The limits to risk aversion. part 2: the per-mission point and examples. Process Saf Environ Prot 88(6):396–406
26. Thomas PJ, Jones RD (2010) Extending the J-value framework for safety analysis to include the environmental costs of a large accident. Process Saf Environ Prot 88(5):297–317
27. Van Coile R, Hopkin D, Lange D, Jomaas G, Bisby L (2018) The need for hierarchies of acceptance criteria for probabilistic risk assessments in fire engineering. Fire Technol. https://doi.org/10.1007/s10694-018-0746-7
28. De Sanctis G, Fontana M (2016) Risk-based optimisation of fire safety egress provi-sions based on the LQI acceptance criterion. Reliab Eng Syst Saf 152:339–350
29. Hasofer AM, Thomas IR (2008) Cost benefit analysis of a fire safety system based on the life quality index. Fire Saf Sci 9:969–980
30. Pandey MD, Wang Z, Cheng T (2015) Stochastic renewal process models for life cycle cost and utility analysis. Proceedings of ICASP12, Vancouver 12-15/07
32. Van Coile R, Caspeele R, Taerwe L (2014) Lifetime cost optimization for the structural fire resistance of concrete slabs. Fire Technol 50:1201–1227
33. Spearpoint M, Hopkin D (2018). Evaluation of the justifiable investment in residential sprinkler system installations using the J-value methodology. In: Third European sym-posium on fire safety sciences (ESFSS 2018), 12th–14th Sep 2018, Nancy, France 34. Greater London Authority (2018) Never again: sprinklers as the next step towards safer
homes, London Assembly Planning Committee, 50 p
Publisher’s NoteSpringer Nature remains neutral with regard to jurisdictional claims in published
![Figure 1.(left) Assumed basis of safe design (right) demonstratedbasis of safe design where experience is not an adequate basis [6].](https://thumb-us.123doks.com/thumbv2/123dok_us/1978833.159337/3.439.49.396.441.584/figure-assumed-basis-design-demonstratedbasis-design-experience-adequate.webp)