Financial report 1996
122
0
0
Full text
(2) Cover photo: Copenhagen, European City of Culture 1996 — The Round (Photo: Danish Tourist Office, Copenhagen).. Tower.
(3) EUROPEAN UNION. FINANCIAL REPORT. 1996.
(4) Work continued on implementing the second phase of the SEM 2000 initiative, aimed at ensuring the sound and efficient management of Community finances. This phase covers four major areas: defining and costing objectives, organising the Commission's financial structures, improving management systems and evaluating Community policies. The third phase of the initiative also got under way in 1996. The object is to strengthen partnership with the Member States in the management of Community budget expenditure and revenue. A group of personal representatives of Finance and Budget Ministers was set up for this purpose. It held six meetings during the year, which were chaired by the Commission and attended by representatives of Parliament and the Court of Auditors. The Dublin European Council approved the practical recommendations which the group laid before it and confirmed its support for the SEM 2000 initiative, which was also welcomed by Parliament.. Erkki Liikanen Member of the Commission with responsibility for budgetary affairs.
(5) CONTENTS. Page. Economic and financial framework. 7. Revenue. 14. Expenditure. 'N. Heading 1 — Agricultural market guarantees. 18. Heading 2 — Structural operations. 27. Heading 3 — Internal policies. 32. Research and technological development. 32. Transport. 34. Education, vocational training and youth policy. 34. Culture and audiovisual media. 43. Information and communication. 43. Other social measures. 43. Energy. 44. Euratom nuclear safeguards. 45. Environment. 45. Consumer protection. 46. Aid for reconstruction. 46. Internal market. 46. Industry and information market. 47. Statistical information. 48. Trans-European networks. 48. Cooperation in the fields of justice and home affairs. 49. Heading 4 — External action Heading 5 — Administrative expenditure Borrowing and lending operations. 50 58 59.
(6) Treasury report. 65. Annex 1 — The ECSC's financial and budgetary activities in 1996. 70. Annex 2 — Financial out-turn of the EDF in 1996. 77. The consolidated accounts of the European Union. 81. Accounting principles. 82. Consolidated revenue and expenditure account for 1996. 85. Consolidated balance sheet at 31 December 1996. 94. Explanatory notes to the consolidated balance sheet. 1. >S. Off-balance-sheet commitments at 31 December 1996. 107. Explanatory notes to the off-balance-sheet commitments and potential liabilities and claims. 110.
(7) ECONOMIC AND FINANCIAL FRAMEWORK. The basic budget principles Six basic principles govern the budget of the European Union:. Unity. This principle, which is enshrined in Article 199 of the Treaty, means that all EU expenditure and revenue must be incorporated in a single budget document.. rised in 1975, on the basis of Article 235 of the EEC Treaty. Most borrowing and lending operations (with the exception of ECSC operations) are included in the EU's balance sheet. The two annexes to this report contain a summary of the budgetary and financial operations of the ECSC (operating budget and borrowing and lending operations) and the EDF. Universality ì. In the early .years of the Community, the autonomy of the institutions set up under the ECSC, EEC and Euratom Treaties resulted in up to five separate budgets being produced to cover any one year. Since the Treaty of Luxembourg of 22 April 1970, the Community's essential financial activities have tended to move towards a unified budget, and there are now only two budget documents, the general budget and the ECSC operating budget. However, two categories of financial operation are still outside this structure: the European Development Fund (EDF) and borrowing and lending activities. The EDF was set up by the EEC Treaty with a view to stepping up trade with associated developing countries and assisting them in carrying out economic and social development projects. The resources of the EDF are provided by contributions from the Member States. For what are essentially political reasons, the Member States wish to retain their direct influence over certain development aid operations by maintaining an independent financial regime and management procedures which are not subject to the ordinary rules. The EEC Treaty made no express provision for borrowing and lending operations. However, as the achievement of the Community's objectives made it necessary to lay down rules for operations on the capital market, borrowing and lending activities were finally autho-. This principle comprises two rules: the rule of non-assignment, meaning that budget revenue must not be earmarked for specific items of expenditure, and the gross budget rule, meaning that revenue and expenditure are entered in full in the budget without any adjustment against each other.. Annuality. The budget for the year is cast at two levels: a commitment budget and a payment budget. Commitment appropriations cover new commitments for the year, whereas payment appropriations must cover the amounts payable against both new and existing commitments. Annuality means that a budget is adopted for a single year and that the appropriations it contains, both for commitments and payments, must be used during that year. The principle does not rule out the possibility that certain commitments may last for more than one year. Clearly, in sectors such as the Structural Funds, research and external cooperation, the EU needs to enter into some commitments which exceed the period of one year. In these sectors, a mechanism known as 'differentiated appropriations' allows for a separate annual vote of commitments and payments..
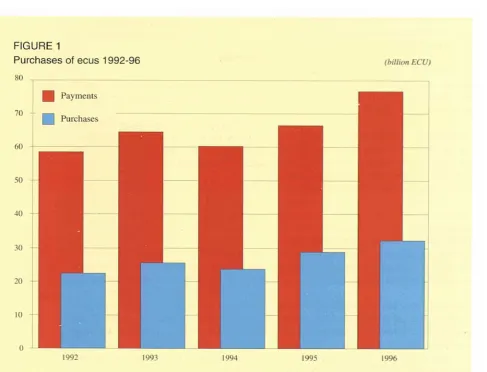
(8) 8. Under certain clearly defined conditions, some unused appropriations may be carried over to the following year. Equilibrium. Estimated revenue for the year must equal payment appropriations for that year. There is no Community legal instrument authorising borrowing to cover a budget deficit. Any surplus for the year is carried forward to the following year. A modest operating deficit can also be carried forward. On the other hand, a significant departure from the original budget during the year requires the adoption of a supplementary or amending budget.. Specification. Specification means that each appropriation must have a given purpose and be assigned to a specific objective in order to prevent any confusion between appropriations, at both the authorisation and the execution stage, and thus to ensure that the budget as established is quite unambiguous and that it is executed in accordance with the wishes of the budgetary authority. The principle of specification determines the horizontal structure (distinction between the statement of revenue and the statement of expenditure and subdivision of the statement of. FIGURE 1 Purchases of ecus 1992-96. (billion ECU). 80. Payments 70. Purchases. 60. 50. 40. 30. 20 -. 10. 1992. 1993. 1994. 1995. 1996.
(9) expenditure into six individual sections for each of the institutions) and the vertical structure of the budget (the budget nomenclature distinguishes appropriations according to their nature and purpose by subdividing sections — and in particular Section III, which contains all EU expenditure on operations — into titles, chapters, articles and items). A certain flexibility in the application of the rule of specification is achieved by means of transfers of appropriations, which, subject to certain conditions, allow appropriations to be moved to headings other than those to which they were assigned when the budget was established. The Treaty itself makes provision for transfers, the object being to ensure the best possible utilisation of budget appropriations. The use of the ecu. The currency unit of the European Union is the ecu, made up of a 'basket' of 12 national currencies. Its composition should remain unchanged until the introduction of the single currency. Since 1992 the Commission has been using ecu-denominated accounts at the French and Irish Treasuries. The Commission promotes the adoption of the ecu as the single currency by using it as much as possible in the execution of the budget. Most EU programmes, other than EAGGFGuarantee operations, are implemented in ecus. In 1996, for example, 95 % of the budget and 44 % of the operational programmes other than EAGGF-Guarantee were implemented in ecus.. The economic situation in the European Union in 1996 Economic growth in the Union slackened from the middle of 1995. This was, however,. only temporary, giving way to a certain upturn in economic activity from mid-1996. This slack period was by no means unusual, but lasted longer chiefly because of the restraining effect of the stock cycle, and the delayed effects of the rise in long-term interest rates in 1994 and parity movements in the spring of 1995. There are convergent signs that the Union's economy is in an upward phase: the quarterly GDP figures show that growth is gradually speeding up; order books are filling up, and business confidence has been improving in the last few quarters, mirrored more recently by the consumer confidence indicator. According to the most recent estimates, real GDP growth for the Union as a whole probably averaged 1.6% in 1996, with some disparities between Member States. The recovery which started in mid-1996 should continue in 1997. It is sustained by the high level of external demand from outside the Union, good returns on investments, a more flexible mix of economic policies, the decline in interest rates, a better balance in exchange rates both within Europe and against the US dollar and moderate wage growth. The labour market situation is still unsatisfactory. After three consecutive years of declining employment, caused by the 1992-93 recession and major restructuring operations undertaken by many firms, employment increased in 1995 but tended to level off in 1996 as a result of the slackening in economic growth. Unemployment in the Union in 1996 therefore remained relatively high at 10.9% of the labour force, the same level as in 1995. The European Union's inflation performance was again good in 1996. As measured by the private consumption deflator, average inflation in the Union dropped from 3.0% in 1995 to 2.6 % in 1996 with a marked trend towards convergence between Member States. Labour market trends, wage restraint and, above all, economic policies designed to foster price stability helped to maintain this movement towards lower inflation..
(10) Public sector deficits in the Union have steadily decreased after peaking at 6.2% of GDP in 1993. The average public sector deficit in 1996 was estimated to be 4.4% of GDP. This was achieved by means of the consolidation efforts which governments have been making for a number of years, with the help of growth (albeit on a modest scale) and also as a result of the drop in interest rates which affect public debt. The steady reduction in public sector deficits did not. in 1996. produce any stabilisation in public debt as a percentage of GDP for the Union as a whole. According to the Commission's most recent estimates, public debt rose from 71.3% in 1995 to around 73.5 % in 1996. Debt as a proportion of GDP is expected to fall in 1998.. Financial perspective 1993-99 The 1996 budget procedure came within the framework of the financial perspective as adjusted in December 1994 following the enlargement of the Union to include Austria, Finland and Sweden in accordance with paragraph 24 of the interinstitutional agreement of 29 October 1993 on budgetary discipline and improvement of the budgetary procedure. In February 1995, acting under paragraph 9 of the interinstitutional agreement, the Commission made the technical adjustment to the financial perspective for 1996 on the basis of the most recent macroeconomic forecasts available for gross national product and prices. The data for these forecasts concerned the 12-member Community from 1992 to 1995 and the 15-member Community from 1995 to 1996. Following this technical adjustment, the ceiling on payment appropriations required for 1996 was ECU 81 267 million, or 1.19% of GNP. This left a margin of 0.03% below the own resources ceiling, which was set at 1.22% when the financial perspective was laid down in 1993.. At a trialogue meeting held on 4 April 1995 under the new collaboration procedure introduced by the institutional agreement of 29 October 1993. Parliament, the Council and the Commission agreed not to revise the financial perspective for 1996. They also reached agreement on the adjustment of the financial perspective under paragraph 10 of the interinstitutional agreement to take account of conditions of implementation. The main effect of this adjustment was to transfer to 1996 and 1997 the appropriations for commitments for the Structural Funds which lapsed in 1994. totalling ECU 1738 million, half to 1996 and half to 1997. The ceiling on payment appropriations was raised by ECU 935 million for 1996. ECU 696million for 1997, ECU 434 million for 1998 and by ECU 173 million for 1999. These increases cover the payments corresponding to commitment appropriations transferred for the Structural Funds and also take account of the underutilisation of appropriations in 1994. After the technical adjustment of the financial perspective and the adjustment lo take account of the conditions of implementation, the ceiling for appropriations for payments was 1.20% of GNP for 1996.. Budget for the 1996 financial year The President of Parliament declared the 1996 budget finally adopted on 21 December 1995, one week after Parliament's second reading. The budget complied with the ceilings of the adjusted financial perspective and totalled ECU 86525million in appropriations for commitments and ECU 81 888 million in appropriations for payments, 8.37 and 8.55 ck up on the 1995 budget, including the supplementary and amending budget. The appropriations for payments were equivalent to 1.196% of GNP..
(11) FIGURE 2 Financial perspective applicable to 1996 financial year. (million ECU). Appropriations for commitments. 1996 (1996 prices). 40 828. D. 29 131 5 337 5 264 6 044. 86 604. iations 1996. D. Commitments 1996. 40 828. 39 108. 29 131. 28 609. Internal policies (research, education and training, fisheries and the sea, energy, industry, trans-European networks, etc.). 6 380. 5 259. External action (food aid, cooperation, etc.). 5 587. 5513. EAGGF Guarantee Section Structural operations (EAGGF-Guidance. ERDF, ESF, etc.). Miscellaneous (administrative expenditure, reserves, guarantees, compensation). Agricultural expenditure, which was fixed in line with the conclusions of the ad hoc conciliation meeting on compulsory expenditure, was set at the level of the agricultural guideline — ECU 40 828 million. At ECU 29 131 million, the commitment appropriations for structural operations were the amounts fixed at the Edinburgh Summit in 1992; they also took account of the enlargement of the European Union to cover Austria, Finland and Sweden and included the transfer of ECU 869 million not used in 1994. They were earmarked to finance Community operations under the Structural Funds in 1996, in accordance with the new programming adopted for the period, and under the Cohesion. 5 712. 5 040. 87 638. 83 529. Fund. Finally, the budget adopted reflected the particular attention to be given to the environmental impact of structural operations. The commitment appropriations allocated to internal policies totalled ECU 5 324 million (ECU 12.7 million below the ceiling for the heading); ECU 3 183million, i.e. almost 60% of the total, was for research and technological development. Account was taken of new budget priorities such as information (ECU 50 million for information campaigns — Prince), the establishment of a European voluntary service as a pilot project (ECU 15 million) and continuation of the employment and growth initiative. The agencies (including the Turin Foundation which comes under heading.
(12) 12. 4) received ECU 99.3 million. The appropriations for the trans-European networks were far higher than in 1995 (up by 7.6%), but some of them were entered in the reserve.. below the ceiling for the heading. In all, ECU 1 432 million of the total was for the other institutions and ECU 2 300 million for the Commission (not including pensions).. Commitment appropriations totalling ECU There was only one supplementary and 5 261 million were allocated for external ac- amending budget in 1996. It was finally tion, 8.01 % more than in 1995. This left only adopted on 27 July after a single reading in ECU 3.4 million below the ceiling for this the Council and Parliament. On the revenue heading. The biggest increase was for cooper- side, the purpose was to implement the deciation with the Mediterranean countries, which sion on the system of own resources, which received almost ECU 900 million, including had been finally ratified by all the Member an additional ECU 200 million entered subject States by May 1996. to provide for the refund to the constitution of a negative reserve of to the United Kingdom of its share in the ECU 200 million. A considerable amount was costs of implementing the Protocol on social also earmarked for the reconstruction of the policy annexed to the EC Treaty, to which it former Yugoslavia (ECU 98 million), some of was not party, and to incorporate into the it entered in a reserve which could also be 1996 budget the surplus from the 1995 budget used, if necessary, for common foreign and (ECU 9.2 billion), by deducting this amount security policy action. There was also a sub- from the Member States' contributions. On stantial increase in the appropriations for the the expenditure side, its purpose was lo adjust PHARE and TACIS programmes, Latin the forecasts of agricultural expenditure, takAmerica, Asia, Africa, the non-governmental ing into account both foreseeable savings due organisations (NGOs) and rehabilitation above all to the rise in world prices (ECU measures in South Africa. Finally, the appro1.5billion) and the additional requirements priations for fisheries agreements came to connected with 'mad cow' disease (around ECU 280 million. ECU 1.3 billion, of which 650 million is for compensating producers for incoine loss), (o Administrative expenditure came to ECU amend certain budget remarks and to increase 4 129million, an increase of 3.2% over 1995: the administrative appropriations of the CounECU 62.4 million was thus still available cil and Parliament..
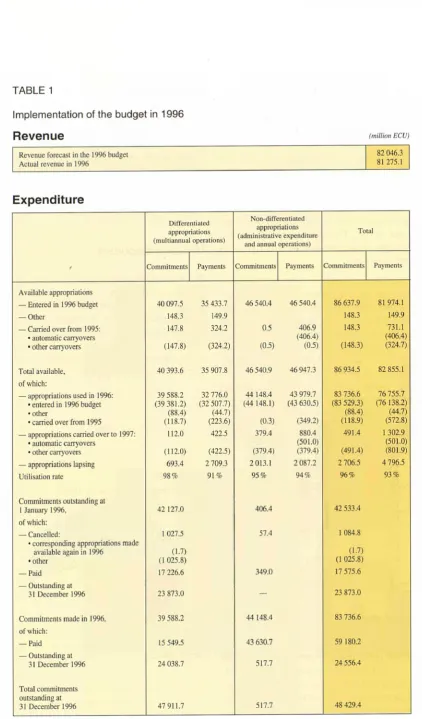
(13) TABLE 1 Implementation of the budget in 1996. Revenue. (million ECU) 82 046.3 81 275.1. Revenue forecast in the 1996 budget Actual revenue in 1996. Expenditure Differentiated appropriations (multiannual operations). f. Commitments. Payments. Non-differentiated appropriations (administrative expenditure and annual operations) Commitments. Payments. Total. Commitments. Payments. Available appropriations 46 540.4. 40 097.5. 35 433.7. — Other. 148.3. 149.9. — Carried over from 1995: • automatic carryovers • other carryovers. 147.8. 324.2. 0.5. (147.8). (324.2). (0.5). — Entered in 1996 budget. Total available. of which: — appropriations used in 1996: •entered in 1996 budget • other • carried over from 1995 — appropriations carried over to 1997: • automatic carryovers • other carryovers — appropriations lapsing Utilisation rate Commitments outstanding at 1 January 1996,. 46 540.4 406.9 (406.4) (0.5). 86 637.9. 81974.1. 148.3. 149.9. 148.3. 731.1 (406.4) (324.7). (148.3). 40 393.6. 35 907.8. 46 540.9. 46 947.3. 86 934.5. 82 855.1. 39 588.2 (39 381.2) (88.4) (118.7). 32 776.0 (32 507.7) (44.7) (223.6). 44 148.4 (44 148.1). 43 979.7 (43 630.5). (0.3). (349.2). 83 736.6 (83 529.3) (88.4) (118.9). 76 755.7 (76 138.2) (44.7) (572.8). 379.4. 880.4 (501.0) (379.4). 112.0 (112.0) 693.4 98%. 422.5 (422.5). (379.4). 2 709.3. 2013.1. 2 087.2. 91%. 95%. 94%. 491.4 (491.4) 2 706.5 96%. 42 127.0. 406.4. 42 533.4. 1 027.5. 57.4. 1 084.8. of which: — Cancelled: • corresponding appropriations made available again in 1996 • other — Paid. 17 226.6. 349.0. 17 575.6. — Outstanding at 31 December 1996. 23 873.0. —. 23 873.0. Commitments made in 1996,. 39 588.2. 44 148.4. 83 736.6. (1.7) (1 025.8). (1.7) (1025.8). of which: — Paid — Outstanding at 31 December 1996. 15 549.5. 43 630.7. 59 180.2. 24 038.7. 517.7. 24 556.4. Total commitments outstanding at 31 December 1996. 47 911.7. 517.7. 48 429.4. 1 302.9 (501.0) (801.9) 4 796.5 93%.
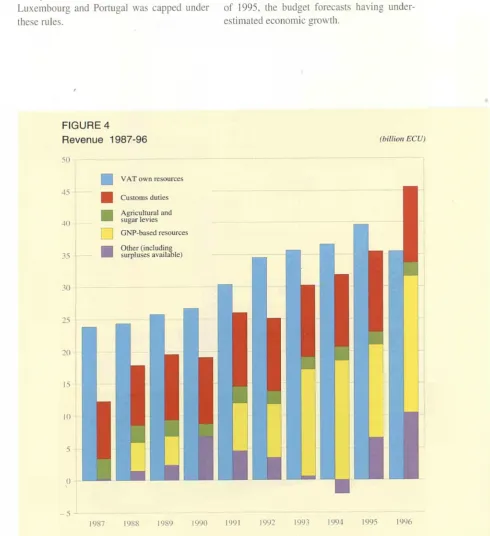
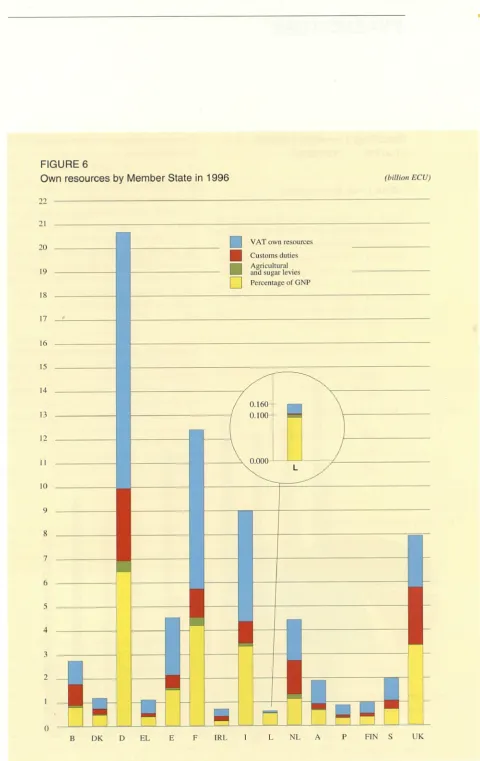
(14) 14. REVENUE. The budget of the European Union was financed from a number of sources in 1996. the breakdown being shown in Figure 3. Total revenue came to ECU 81 billion.. Traditional own resources The EU's traditional own resources are made up of customs duties, agricultural duties and sugar levies. They are established by the Member States, which keep 10% to cover collection costs. Customs duties are levied on trade with nonmember countries, at rates based on the Common Customs Tariff. These rates have often been subject to reductions as a result of negotiation rounds under the General Agreement on Tariffs and Trade (GATT) and specific agreements granting preferential tariffs to certain trading partners. The amount of customs duties collected was down by 6.0% on last year. This is due to the reduction in the average rate of duty from 2.8 % to 2.6 %, which was not offset by the modest 1.5% growth in imports. Agricultural duties are charged when a Member State imports agricultural products from a non-member country. The yield has fallen by 4.2 % compared with last year.. Sugar and isoglucose producers pay levies on production to cover market support arrangements and to finance a system for the equalisation of sugar-storage cosis. thus ensuring that sugar supplies reach the market steadih throughout the year. These levies offset expenditure of virtually the same amount. This year revenue from this source was 7.8r< lower than in 1995. maini} because of the fall in production and storage levies.. VAT own resources The VAT own resources arc calculated by applying a uniform rate to the national VAT bases, which are determined in accordance with Community rules. In accordance with the June 1988 reform and the recently ratified decision on the Communities own-resources system, the uniform rate is determined by applying a percentage, set al 1.24'i for 1996, to. FIGURE 3 Community revenue in 1996. In the cereals sector the purpose of the duties is to offset differences between the world price and the Community price. The proportion of EU revenue accounted for by agricultural levies is declining as the reform of the agricultural policy brings internal cereal prices closer to world prices. In most other sectors the fall in the proportion of revenue provided by levies has been due mainly to negotiated commitments for a steady reduction in agricultural duties (by 6 % per year).. VAT own resources. 43.9%. Customs duties. 14.5%. Agricultural and sugar levies. 2.2%. Percentage of Member States' GNP. 25.9%. Other (including surpluses available). 13.5 %.
(15) 15. the VAT base and deducting the compensation for the United Kingdom. The base used must not exceed the percentage of the Member State's GNP laid down in the decision on own resources. For 1996, this limit was 50% for four Member States and 53 % for the others. This year, the VAT base for Greece, Ireland, Luxembourg and Portugal was capped under these rules.. Payments for a given year derive from the forecasts for that year and the negative or positive adjustments for previous years established using the final statements of the bases. This year, positive adjustments totalling ECU 858 million were made, particularly in respect of 1995, the budget forecasts having underestimated economic growth.. FIGURE 4 Revenue 1987-96. (billion ECU). 50 VAT own resources Customs duties Agricultural and sugar levies. 1987. 1988. 1989. 1990. 1991. 1992. 1993. 1994. 1995. 1996.
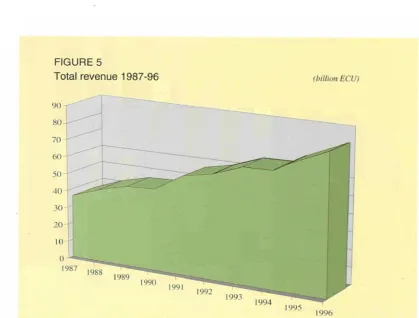
(16) 16. GNP-based own resources A new source of revenue based on a proportion of each Member State's GNP was first introduced in 1988 to balance budget revenue and expenditure, i.e. to finance the part of the budget not covered by other revenue. The rate is fixed during the budgetary procedure and depends on the total of other revenue; the rate is applied to the aggregate GNP of all the Member States, determined in accordance with Community rules. This year, this additional resource was called in, with each Member State paying 0.303 % of its GNP (not including the EAGGF monetary reserve, the loan guarantee reserve and the emergency aid reserve). In addition, five Member States had to finance their share of. the compensation for the United Kingdom bv making a payment based on GNP as their VAT payments had reached the maximum rate. i.e. 1.24 % of their base. Net negative adjustments totalling ECU 27 million were made for 1988-95.. Miscellaneous revenue The general budget is also financed by miscellaneous revenue, including tax and other deductions from staff remuneration, bank interest, outside contributions to research programmes, repayments of unused aid and interest on late payments. The revenue for 1996 also includes the ECU 9.215 billion surplus from 1995.. FIGURE 5. Total revenue 1987-96. (billion ECU). I 995. 1996.
(17) 17. FIGURE 6 Own resources by Member State in 1996. (billion ECU). 22 21 VAT own resources. a. Β. DK. D. EL. Customs duties Agricultural and sugar levies Percentage of GNP. FIN. S. UK.
(18) EXPENDITURE. 18. Heading 1 —Agricultural market guarantees. J to ensure that supplies reach consumers at reasonable prices.. Objectives and means. Although these objectives have largel) been met. certain permanent adjustments have had to be made, the most recent oí which is the re form of the common agricultural policy (CAP) adopted by the Council in May \W1. The reform is based on more competitive prices and direct aid to the farmers in greatest need. Its aim is to reduce surpluses, stem the tide of rural depopulation and preserve the en vironment by discouraging intensive produc tion.. Article 38 of the EC Treaty provides that the common market shall extend to agriculture and trade in agricultural products, and that the operation and development of the common market for agricultural products must be ac companied by the establishment of a common agricultural policy among the Member States. Article 39 defines the objectives of the com mon agricultural policy as: D to increase agricultural productivity: D to ensure a fair standard of living for the agricultural community; D to stabilise markets: D to guarantee the availability of supplies;. FIGURE 7 Community expenditure in 1996. [\ \. ^^^_^_^ /. ___^-^. In pursuit of the above objectives, the com mon market in agricultural produce is based on three principles: the single market. Com munity preference and financial solidarity. The third of these principles is fundamental to the policy, and in April 1962 the Member States accordingly decided to sci up a Com munity fund — the European Agricultural Guidance and G uarantee Fund (EAG G F) — which is part of the EU budget. Il is subject Io the general budgetary rules, with the addition of specific provisions. The fund was subdivided into two sections in 1964: the G uarantee Section covers expendi ture on markets and prices and the G uidance Seclion covers expenditure on farm structures.. À. Constraints. /. ^^^^ Commor agricultural policy. 46.8%. Structural operations. 34.2%. Research and technological developments. 4.0%. Internal policies other than research. 2.4%. External action. 6.6%. Administration. 4.9%. Other (guara ntee, reserves, etc.). 1.1%. ■ :. ■ ■ ■ π. In June 1988, when own resources had run out as a result of everincreasing agricultural expenditure triggered by imbalances on cer tain markets, the European Council agreed on principles of budgetary discipline in order to establish a better balance between the various categories of expenditure and keep their growth under control. These principles were reaffirmed by the Edinburgh European Coun cil in December 1992..
(19) 19. To bring agricultural expenditure under con trol, the European Council adopted the princi ple of a guideline. Within this guideline, the EAGGF Guarantee Section has to finance: Π export refunds; Π market intervention operations, including depreciation of new stocks;. D market-related rural development opera tions and measures to combat fraud. However, in line with the conclusions of the Edinburgh European Council, the guideline was extended with effect from 1993 to cover: D new flanking measures to accompany the reform of the common agricultural policy (early retirement, environment, afforesta tion);. FIGURE 8 Development of expenditure 1987-96. (billion ECU). 40. |. Common agricultural policy. | | Structural operations Research and technological development. □ ■. Internal policies other than research External action. α. 1987. 1988. 1989. 1990. 1991. 1992. 1993. 1994. 1995. 1996. Administration Other (refunds, guarantees, reserves, etc.).
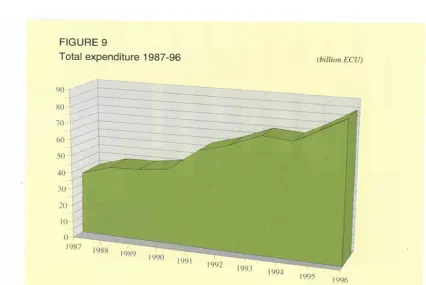
(20) 20. Π all of the expenditure relating to the with drawal of land from production. 50% of which was financed by the EAG G FG uar antee (heading 2 of the financial perspec tive); D expenditure on income aid (under heading 2 of the financial perspective in 1992); D Guarantee Fund expenditure on fisheries (under heading 4 in 1992).. 1996 budget General assessment. The appropriations covered by heading l of the financial perspective amounted to the full ECU 40.828 billion allowed for under the agricultural guideline, not counting the ECU 500million monetary reserve, which is called. on only if needed. The figure does include the ECU 69.5 million entered in Chapter B040 'Provisional credits'. Supplementary and amending budget No 1/96 (SAB No 1/96) When the proposal on agricultural prices and related measures for 1996/97 was presented in January, the Commission followed the cus tomary procedure of updating ¡is expenditure forecast. Taking the dollarecu rate used for the budget, i.e. USD 1 = ECU 0.79, the Com mission forecast that the budget appropriai ion would exceed requirements for 1996 by ECU 698 million, primarily as a result o\ favourable trends on a number of agricultural markets. Over the following months, the situation re mained good and, in some cases, improved. FIGURE 9 Total expenditure 1987-96. (billion ECU). 1993. 1994. 1995. 1996.
(21) 21. further. However, at the end of March 1996, the bovine spongiform encephalopathy (BSE) crisis struck in the United Kingdom, necessitating some costly measures aimed at eradicating the disease and restoring consumer confidence both inside and outside the Union. In addition, market intervention was required and producers had to be compensated for loss of income. The savings from other unexpectedly buoyant markets were large enough to enable the cost of this operation, amounting to some ECU 1.5 billion, to be funded from the 1996 budget allocation. The budget authority adopted a supplementary and amending budget (No 1/96) to take account of these events. There was no change in the overall amount of the allocation for the Guarantee Section of the EAGGF, but it was redistributed. Total requirements amounted to ECU 40.630 billion. The balance of ECU 198 million, still available within the agricultural guideline of ECU 40.828 billion, was entered in a temporary reserve within the Guarantee Section of the EAGGF, to finance the compulsory selective cattle-slaughter programme in the United Kingdom and any additional intervention on the beef market. Spending for 1996, before carryovers, totalled ECU 39.1078 billion, i.e. ECU 1.7208 billion (4.2%) below the appropriation in the initial budget and supplementary and amending budget (SAB) No 1/96. Discrepancies between spending forecasts and out-turns always raise questions concerning the agricultural forecast. However, it must be remembered that the budget for the Guarantee Section of the EAGGF is a forecast, not a spending target. Most of the Commission's forecasts are based on a large number of unpredictable factors, such as the harvest, world. prices, internal prices, trade flows, exchange rates, etc. Furthermore, the Commission has to make its forecasts in time for its preliminary draft budget, a year before these factors can be gauged with sufficient accuracy. The Commission forecasts in the preliminary draft budget are then scrutinised by the Member States and the two arms of the budget authority. In accordance with the 1993 interinstitutional agreement, an ad hoc conciliation procedure was introduced in 1995, whereby Parliament, the Council and the Commission examine the preliminary draft budget forecasts in detail and agree on expenditure before the first reading in the Council. It is clear from the above that the agricultural forecasts are based on a number of factors which are hard to predict a year in advance and that no single authority is responsible for forecasting. As part of Stage III of SEM 2000, the Commission intends to propose a programme of measures designed to improve the forecasting and implementation of expenditure through even closer cooperation between the Commission and the Member States. It should also be borne in mind that the 1996 budget coincided with implementation of the last stage of the reform of the common agricultural policy and was the first to deal with the full budgetary impact of the last enlargement. On top of this came the upheavals on the beef market as a result of the BSE outbreak. Fortunately, the significant costs arising from the crisis were more easily met than they might have been because of the favourable conditions on a number of important markets (high world prices for cereals, sugar and milk) and the fact that the beef crisis drove up internal prices for other meats..
(22) 22. FIGURE 10 Expenditure on agricultural market guarantees 1996. (billion ECU). Arable crops. Sugar Olive oil and dried fodder Fruit and vegetables Products of the winegrowing sector Tobacco. Milk and milk products. Beef/veal Sheepmeat and goalmeat. Expenditure 1995 Expenditure 1996. Other 0. I. 2. 3. 4. 5. 6. 7. 8. 9. It). II. I2. 13. 14. 15. 16. 17.
(23) 23. Specific comments The table below compares expenditure for each chapter with appropriations in the initial budget and in the amending budget. (million ECU). Chapter. Sector. Budget appropriation. SAB No 1/96 appropriation ('). Expenditure. Expenditure budget. Expenditure SAB. a. b. c. d. e. f=e-c. g = e-d. 10 II 12 13 14 15 16 17 18. Arable crops Sugar Olive oil Dried fodder and vegetables Fibre plants Fruit and vegetables Wine Tobacco Other sectors. 20 21 22 23 24 25 26. Milk and milk products Beef and veal Sheepmeat Pigmeat Eggs and poultry Other animal product measures Fisheries. 30 33 34 35 36 37 38 39. Non-Annex II products Food aid Pre-financing interest Distribution to the needy Anti-fraud measures Clearance of accounts Rural development Other measures. 17 185 1 942 1 781 386 894 1 729 1 113 1 106 314. 16 998 1 843 2 113 385 850 1 575 805 1 043 306. 16 372.3 1 711.3 2 007.7 365.2 831.6 1 589.3 782.2 1 025.6 294.9. -812.7 - 230.7 226.7 -20.8 -62.4 -139.7 - 330.8 -80.4 -19.1. - 625.7 - 131.7 - 105.3 -19.8 -18.4 14.3 -22.8 -I7.4 - 11.1. 4 214 5 458 1 353 168 150 146 48. 3 718 6 744 1 447 126 160 134 39. 3 582.0 6 687.0 1 321.2 124.2 138.7 116.1 34.1. -632.0 1 229.0 -31.8 -43.8 -11.3 -29.9 - 13.9. - 136.0 -57.0 - 125.8 -1.8 -21.3 - 17.9 -4.9. 616 83 0 200 44 - 1 090 520 194. 541 66 0 200 44 - I 122 521 208. 491.1 28.8 0.0 102.1 28.9 - 1 122.7 498.8 225.3. - 124.9 -54.2 0.0 -97.9 -15.1 -32.7 -21.2 31.3. -49.9 -37.2 0.0 -97.9 - 15.1 -0.7 -22.2 17.3. 38 554. 38 744. 37 235.9. - 1 318.1. - 1 508.1. 20 2 254. 20 1 866 198. 19.5 1 852.3 0.0. -0.5 - 4 01.7 0.0. -0.5 - 13.7 -198.0. 40 828. 40 828. 39 107.8. - 1 720.2. - 1 720.2. -4.21. -4.21. Titles 1, 2 and 3 — Total 40 50 70. Income aids Accompanying measures BSE reserve Total EAGGF-Guarantee Percentage difference. (')Inclt iding transfers after adoption of SAB No 1/96.. As explained above, the difference between the appropriations and expenditure levels is accounted for primarily by market trends in a number of sectors and the BSE outbreak. The differences were greatest for the following sectors (figures for appropriations in the initial budget and SAB No 1/96 and for expenditure are in billion ECU)..
(24) 24. Arable crops. around ECU 200million was saved in additional aid for durum wheal in Italy for the 1994 and 1995 harvests as a result of more rigorous checks by the Italian authorities;. Initial SAB No 1/96 Expenditure appropriations 17.185. 16.998. 16.3723. Expenditure came to ECU 812.7 million less than initially budgeted, largely as a result of lower-than-expected refund and storage costs. This, in turn, was the result of the favourable conditions on the internal market, with domestic consumption up and output lower than forecast (175 million rather than 180million tonnes). Production was particularly low in Spain and Portugal because of the persistent drought. This coincided with a poor harvest worldwide and low stocks, pushing up world prices, sometimes to levels above the already high prices on the Union's internal market. These factors together prompted the Commission to suspend export subsidies for a time, which had a dampening effect on exports and reduced refund payments. Furthermore, to meet domestic demand, more cereal was sold from public stocks at prices exceeding the book value of the products, generating unexpected revenue gains. In addition, intervention-related storage costs were kept down and average stocks were lower than usual. On the other hand, the difference between supplementary and amending budget No 1/96 and expenditure is only partially explained by favourable market conditions as these had already been taken into account in the SAB. There are other reasons: D applications for per-hectare aid for rape seed fell, as many producers decided not to sow spring rape on land that was under winter rape destroyed by frost, thus cutting expenditure on the advance on Oilseed' aid for 1996 by around ECU 130 million;. D expenditure on five-year set-aside in Germany and Italy was ECU 70 million lower than expected: payments worth ECU 45 million were suspended for failure to meet deadlines, in accordance with Article 13 of the regulation on budget discipline.. • Su«ar. Initial SAB No 1/96Expenditure appropriations 1.942. 1.843. 1.7113. The savings made on the initial budget were largely due to the buoyant world price, which kept the average refund rate down to ECU 450 per tonne for 1995/96. compared with the forecast rate of ECU 470. The supplementary and amending budget took account of this, so the ECU 131.7million difference between the amended figure and actual expenditure must be attributed to the 150000 tonne fall in the amount exported under quotas: high world prices led traders to export C sugar in the lasi few months of the year without refunds.. 1. Olive oil. Initial SAB No 1/96 Expenditure appropriations 1.781. 2.113. 2.0077.
(25) 25. Overspending in this sector is linked to the level of olive-oil production, which is used to determine the amount of production aid paid to producers. The budget figure was based on an assumed production figure of 1.1 million tonnes. However, in accordance with the relevant rules, production for 1994/95 was set at 1.408 million tonnes in October 1995 on the basis of requests from the Member States.. This adjustment was taken into account in the supplementary and amending budget. The fact that ECU 105.3 million of the appropriation in that budget was not used is due to the Italian authorities' decision to recover a part of the advances paid by way of production subsidies, since the number of aid applications was overestimated when the production figure for 1994/95 was set. Furthermore, Italy was unable to pay all outstanding production subsidies for 1994/95 within the relevant time limits. • Fruit and vegetables Initial appropriations 1.729. SAB No 1/96 Expenditure 1.575. 1.5893. The savings with regard to the initial budget can be put down to modest production levels for peaches, nectarines, apples and oranges, which kept withdrawals below the expected levels. The budget was based on forecast withdrawals of 2.2 million tonnes, whereas the actual figure was around 1.2 million.. The ECU 14.3 million overspend at the end of the year was due to bad weather, affecting the quality of the fruit, with the result that more peaches and nectarines had to be withdrawn than forecast in the supplementary and amending budget.. • Wine Initial appropriations 1.113. SAB No 1/96 Expenditure 0.805. 0.7822. The lower-than-expected expenditure figure for this sector reflects historically low production, amounting to only 80 million hectolitres, compared with the 101 million hectolitres forecast in the budget. This led to savings on the cost of distillation and the buying-in of the alcohol obtained. This downward revision of the supply balance was taken into consideration in the supplementary and amending budget and actual expenditure was practically the same as the amount in that budget. •Milk Initial appropriations 4.214. SAB No 1/96 Expenditure 3.718. 3.582. Here again, there were unused appropriations at the end of the year. As with cereals, the reason was the very favourable conditions on both the world and Community markets, particularly at the beginning of the year. High world prices led to savings of ECU 373 million in refunds, while on the internal market, around ECU 100 million was saved thanks to reduced spending on special disposal measures for butter. Lastly, in response to the fact that quotas were exceeded in most Member States, a supplementary levy was raised, generating some ECU 200 million in income. The main reason why expenditure was still ECU 136 million below the level forecast in the supplementary and amending budget is that the extra revenue from the supplementary levy was expected to total around ECU 90 million, whereas the actual figure was ECU 194 million..
(26) 26. Beef and veal Initial SAB No 1/96 Expenditure appropriations 5.458. 6.744. 6.687. The 'mad cow' crisis explains the increase in expenditure in 1996, directly accounting for some ECU 1.450 billion. Of this additional expenditure, over half (ECU 815 million) was spent on measures linked to the Council's decision to compensate producers for loss of earnings. In addition, the BSE crisis hit beef sales very hard. Before the crisis, the 1996 budget had allocated ECU 221 million to intervention, on the assumption that 150000 tonnes of beef and veal would be bought in. In the supplementary and amending budget, this figure had risen to 300000 tonnes. By the end of August, tenders for intervention had been submitted for 296 000 tonnes and the tenders for September, 50% of which are attributed to the 1996 budget, totalled 48000 tonnes. Intervention spending had risen to ECU 621 million. ECU 400 million higher than the amount forecast before the crisis. As one of the measures aimed at eradicating BSE from the United Kingdom through voluntary slaughter, the Commission adopted Regulation (EC) No 716/96 of 19 April 1996, which provides that the budget will supply 70% of the compensation paid to UK producers for the purchase of animals over the age of 30 months, with a view to their complete destruction. It had been estimated that this would require ECU 194 million for 1996. for the destruction of 480 000 animals. The United Kingdom encountered a number of logistical difficulties, particularly with incineration capacity, leading to delays in getting the destruction of animals under way. However, by 15 October 1996, 632000 animals had been slaughtered and 550 000 rendered, but only 26 000 had been incinerated after rendering. The entire Community contribution towards. compensation was supposed tq be withheld until after complete destruction but. follow ing changes to the relevant regulations, the Commission decided to pay an 80% advance prior to incineration, as a result of which around ECU 147 million was spent in 1996. A further ECU 8million was paid out in full compensation, making ECU 155 million in total.. Other related measures include: the destruction of fattening calves of British origin in France and the Netherlands, costing ECU 53 million, ECU 11 million more than forecast in the supplemen larv and amending budget because of the higher-than-expected average weight o( the animals, partially compensated for by a smaller number (121000 instead o( 134000): ECU 24 million, the amount forecast in the supplementary and amending budget, which was spent on processing premiums for newborn male calves; D selective slaughter programmes which were adopted in the United Kingdom and Portugal, the cost of which was pul at ECU 102 million and ECU 1 million respectively. Only the Portuguese programme was actually implemented in 1996, and cost ECU 0.93 million. However, the cost of the programmes was not entered in the supplementary and amending budget: ECU 198 million was entered in a special 'tem porary BSE reserve' in Chapter B1-70 to meet these and other costs. The reserve was not used. The cost of these measures was offset by the savings on refunds amounting to some ECU 250million, partly as a result of the ban on meat exports from the UK and the increase in the amount of frozen beef exports, which attract smaller refunds..
(27) 27. With only ECU 57 million left unused in relation to the supplementary and amending budget, the out-turn is very close to the forecast given that the sector was seriously disrupted throughout the year. • Sheepmeat Initial SAB No 1/96 Expenditure appropriations 1.3212 1.447 1.353 Price trends on the domestic market constitute one of the mcjst significant factors in determining expenditure in this sector. The spending figure was raised in the supplementary and amending budget to allow for delays in the payment of premiums for 1994 and 1995, worth around ECU 200 million. This was partially offset by the fact that, for 1995 and 1996, the market price was higher than forecast in the budget. Actual expenditure was ECU 125.8 million below the supplementary and amending budget because price trends in 1996 were far more favourable than expected, primarily as a result of the beef crisis, which boosted consumption. The average price for 1996 was around ECU 3 630 per tonne, compared with forecasts of ECU 3 200 in the initial budget and ECU 3 250 in the supplementary and amending budget. • Non-Annex II products. Initial SAB No 1/96 Expenditure appropriations 0.4911 0.541 0.616 The relatively high world prices for cereals and dairy produce were the main factor in determining the level of expenditure. • Distribution to the needy Initial SAB No 1/96 Expenditure appropriations 0.1021 0.200 0.200. The low expenditure levels, ECU 97.9 million below the budget, are linked to the delay in the adoption of a Community regulation allowing goods to be bought on the open market. This change was proposed because the low level of public stocks was undermining the effectiveness of the measure. • Accompanying measures Initial SAB No 1/96 Expenditure appropriations 2.254. 1.866. 1.8523. The allocations for each of the three measures in this chapter were underutilised. There was little change from 1995 with regard to the early-retirement programme: the schemes were not implemented in full in Spain or Greece and the Italian scheme's teething troubles persisted. Spending on measures to promote environmentally friendly farming did not quite reach the budget forecast either, despite extra spending in Austria and Finland, which, as new Member States, had been unable to implement the relevant schemes in 1995 and had to catch up. In addition, Austria's target expenditure ceiling was raised to ECU 81 million (ECU 162 million for the two years together). Lastly, initial appropriations for afforestation programmes were also underutilised, particularly in Italy, Germany and Spain.. Heading 2 — Structural operations Community initiatives and most of the Community support frameworks (CSFs) and the single programming documents (SPDs) were adopted in 1994 and 1995. In 1996 the Objective 2 SPD for Finland, the Objective 3 SPD for the United Kingdom and the Objective 5b SPD for Sweden were adopted..
(28) 28. FIGURE 11 Breakdown by Member State of Community contribution under the various objectives of the Structural Funds. (billion ECU). Π Objective 1 1 Objective 2 I Objectives 3 and 4 I Objective 5a (Agriculture) I Objective 5u (Fisheries) I Objective 5b 1 Objective 6. Β. DK. D. EL. E. F. IRL. I. L. NL. A. I» KIN. S U K. NB: Figures relate to Üie period 199499, except in the case of Objective 2 ( 199496) and the three new Member States — Austria, Finland and Sweden ( 199599)..
(29) 29. Important policy papers concerning Community structural measures, employment, cohesion policy, the environment and culture were adopted by the Commission, usually in the form of communications to the Council. The 1996 budget earmarked ECU 26.580 billion for operations under the three Structural Funds and the Financial Instrument for Fisheries Guidance (FIFG). Of this total, ECU 26.143 billion was actually committed:. (billion ECU) t. 3.935. EAGGF Guidance Section. 13.812. ERDF ESF. 7.985. FIFG. 0.411 Total. 26.143. (top priority), competitiveness and development of small firms, research, development and innovation, the environment and equal opportunities. On 26 July, it drew up the list of declining industrial areas eligible under Objective 2 for 1997-99. It also set the indicative allocation among the Member States other than Austria, Sweden and Finland of the Structural Fund commitment appropriations for the same period: (Belgium: ECU 86 million; Denmark: ECU 65 million; France: ECU 2.059 billion; Germany: ECU 854 million; Italy: ECU 798 million; Luxembourg: ECU 8 million; Netherlands: ECU 359 million; Spain: ECU 1.318billion; United Kingdom ECU 2.500 billion). The allocation of appropriations for the three new Member States had been fixed in 1995 prior to preparation of the SPDs (Austria: ECU 101 million; Finland (1995-96): ECU 69 million; Sweden: ECU 160 million). The Community's total contribution for 1996 came to ECU 2.726 billion, of which ECU 2.705 billion was committed.. The Union supports six specific objectives through the Structural Funds and the FIFG.. Regions lagging behind in their development (Objective 1). On 4 March and 24 June respectively, the Commission amended the SPDs for Merseyside (United Kingdom) and for Hainaut (Belgium). The Community's total contribution for 1996 came to ECU 15.439 billion, of which ECU 15.369 billion was committed.. Regions suffering industrial decline (Objective 2). On 29 April, the Commission sent Member States a note for guidance setting out the Objective 2 priorities for 1997-99: job creation. Combating long-term unemployment and facilitating the integration into working life of young people and of persons exposed to exclusion from the labour market (Objective 3). The SPD for the United Kingdom for 1997-99 was adopted by the Commission on 16 December. The following priorities were selected in partnership with the national authorities: improving the job prospects of the long-term unemployed; promoting the integration into working life of young people seeking jobs; improving the job prospects of persons threatened by exclusion from the labour market; and promoting equality of opportunity for men and women on the labour market. The Community's total contribution for 1996 came to ECU 2.798 billion, all of which was committed..
(30) 30. Adjustment of the workforce to industrial change and to changes in production systems (Objective 4) The priorities are as follows: anticipating trends on the labour market and vocational qualification needs: developing training, guid ance and advice facilities: improving new and existing training schemes so that workers are better qualified to meet new requirements: and technical assistance measures in the fields of information, counselling, services and assess ment. The measures taken concentrate on training workers to meet the need for skills identified by advance measures. Priority is given to small firms and workers threatened by unemploy ment as a result of industrial change. On 29 May, the Commission amended the SPD for G ermany, on 13 September the CSF for Belgium and the SPD for Luxembourg and on 19 December the SPD for Denmark, extending their application for three years in those areas where the initial programme only covered 199496. The Community's total contribution for 1996 came to ECU 271.5 million, all of which was committed.. Adjustment of agricultural structures (Objective 5a) (million ECU). Available Objective. Appro. appropriations priations in 1996. committed. 5a outside 1 and 5b. 425.8. 425.8. 5a in 5b. 376.6. 376.6. 5a. 156.0. 115.0. 958.4. 917.4. Total. On 11 March, the Commission adopted the SPD for improving processing and marketing conditions for agricultural and forestry prod ucts (Regulations (EEC) Nos S66/90 and 867/90) in Sweden until 1999. The Commis sion also modified the United Kingdom SPD. On 23 July, the Council amended the Commu nity list of less favoured agricultural areas to include further areas in Ireland. On 26 Febru ary, the Commission also adopted three pro posals for regulations consolidating Regula tions (EEC) Nos 1360/78 on producer groups ami associations thereof. 866/90 on improving the processing and marketing conditions for agricultural producís and 2328ΛΜ tin improv ing the efficiency of agricultural structures. The Community's total contribution for 1996 came to ECU 958.4 million, of which 917.2 million was committed.. Fisheries structure (Objective 5a). On 28 May. the Council adopted a regulation amending Regulation (EC) No 3699/93 laving down the criteria and arrangements regarding Community structural assistance in the fish eries and aquaculture sector, ami the process ing and marketing of ils producís. 'I'hc new regulation seis oui ihc limits lor premiums for the scrapping of vessels over 30 years old and puis a ceiling on aid from the financial Instru ment for Fisheries Guidance lor the temporary layingup of vessels. On 20 December, il adopted a regulation amending Regulation (EC) No 3699/93 to introduce a reference in the new aid scheme for producer organisa tions and confirm thai FIFG assistance would use only the budgetary rate for the ecu. and not the agricultural rate. The Community's total contribution for 1996 came to ECU 156million. of which 115mil lion was committed..
(31) 31. TABLE 2 Commitment appropriations — Cohesion Fund Transport. Environment Million ECU Greece Spain Ireland Portugal Total. %. Million ECU. %. Total. Breakdown. Million ECU. %. 235.9 663.5 99.9 218.0. 53.8 49.4 45.1 49.6. 202.4 678.4 121.8 221.5. 46.2 50.6 54.9 50.4. 438.3 1341.9 221.7 439.5. 18.0 55.0 9.0 18.0. 1 217.3. 49.9. 1 224.1. 50.1. 2441.4. 100.0 2.2 0.3. Technical assistance Anti-fraud measures. Development of rural areas (Objective 5b). provement, the environment and Community social measures.. Objective 5b is concerned with the development of rural areas in difficult circumstances which are not located in Objective 1 regions; 12 Member States are involved. The Objective 5b areas designated for the period 199499 have a total population of approximately 32745000, i.e. 8.8% of the Community's population including the three new Member States, and a combined surface area of 840 876 km:.. The Community's total contribution came to ECU 91.45 million, of which 88.65 million was committed.. On 8 May, the Commission adopted the Objective 5b SPDs for Sweden. The Community's total contribution for 1996 came to ECU 971.5 million, of which 917.4 million was committed. Regions with an extremely low population density (Objective 6). Finland and Sweden are the only countries affected by this objective. Its main priorities are economic and commercial development, human resources, promotion of know-how, agriculture, forestry, fisheries, farmland im-. Community initiatives. Total funding for the Community initiatives represents 9% of the total volume of the Structural Funds, in accordance with Article 12 of Council Regulation (EEC) No 2081/93. This figure was obtained by taking 8 % of the total funding allocated to each objective (including transitional measures and innovative schemes) and adding 1 % of total Structural Fund appropriations, taken from the funding of Objectives 3 and 4. On 8 May, following consultation of the European Parliament and the Economic and Social Committee, the Commission formally adopted the decision on the allocation of the reserve for the Community initiatives. The total came to ECU 1.665 billion at 1996 prices. Appropriations available for 1996 totalled ECU 2.989 billion, of which 2.819 billion was committed..
(32) 32. Other structural operations. These comprise innovative schemes and other regional operations. In 1996, the Commission selected the first pilot projects covered by the guidelines adopted the previous year under Article 10 of Regulation (EEC) No 4254/88; 135 innovatory projects were selected in the field of regional and local economic development and over 50 projects were chosen involving interregional cooperation with non-member countries. Calls for proposals have also been published regarding interregional cooperation schemes within the Community and cooperation networks between local and regional authorities. The Commission also selected 35 pilot or demonstration projects under Regulation (EEC) No 4256/88. These projects concerned non-food crops, agri-environmental aspects, the forest economy and rural development. Appropriations available for 1996 totalled ECU 334.8 million, of which 200.9 million was committed.. Cohesion Fund. The Cohesion Fund was set up by the Treaty on European Union and first started operation in 1993. Its allocation for the period covered by the financial perspective for 1993-99 amounts to ECU 15.15 million (at 1992 prices). On 4 September, the Commission adopted its annual report on the work of the Cohesion Fund in 1995, the first full year of operation of the Fund. It stresses the progress made in the search for balance in financing between environmental and transport projects. On 19 April, Parliament adopted a resolution stressing the need for a careful assessment of the environmental impact of Cohesion Fund projects and the importance of these projects supporting rail rather than road transport. Article 2(3) of Regulation (EC) No 1164/94 requires a mid-term review to be carried out. in 1996 to ascertain that the GNP in the Member States eligible under the Cohesion Fund (Greece. Spain. Ireland and Portugal) remains below 909c of the Community average. Following the review, the Commission found at its meeting on 12 June that they were still eligible to benefit from the Cohesion Fund. In a communication adopted on 6 November, the Commission confirmed that the government deficits of the countries with an excessive deficit (Greece. Spain and Portugali were within the limits for the objectives recommended by the Council and that, pursuant to Article 6 of the regulation, assistance to those countries would continue. In 1996, the appropriations committed to financing projects in Greece. Spain. Ireland and Portugal totalled ECU 2.4414billion. The breakdown by country of the sums committed is shown in Table 2. In 1996. a total of 338 projects were financed by the Cohesion Fund (122 in Greece. 109 in Spain. 47 in Ireland ami 60 in Portugal).. Heading 3 — Internal policies Research and technological development The year 1996 was a particularly busy year for Community research policy. The fourth framework programme (1994-98) was in full swing, calls for proposals were published and contracts negotiated throughout the year. On 4 March, the budget for the fourth framework programme was increased by ECU 800 million to take account of the accession of Austria, Finland and Sweden, bringing the overall amount up to ECU 13.1 billion for the period 1994-98..
(33) 33. On 31 January, the Commission adopted two proposals to amend the fourth framework programme (European Community and Euratom) with a view to using an extra ECU 700 million for the framework programme in accordance with Article 1(3) of the programme decision. This request was made independently of a request for a review of the financial perspective made at the same time which was not adopted by the Council. On 5 December, the Council reached a political agreement on a common position on an amended Commission proposal increasing financing of the fourth research and technological development (RTD) framework programme by ECU 100 million. The year 1996 was the second year of operation of the new framework programme. Budgetary implementation amounted to over 99 % in commitments and over 90% in payments even though funding was increased during the year, by means of an end-of-year overall transfer of ECU 50 million and supplementary appropriations transferred as part of cooperation agreements, notably between the European Economic Area (EEA) and Israel. This additional funding involved appropriations for non-nuclear specific programmes, which were increased by 2.64 % in commitment appropriations (1.58% for the EEA and 1.06% for Israel). The appropriations available for RTD in 1996 (excluding appropriations carried over or made available again) thus came to: (million ECU). (a) Budget, not including EEA support Indirect action and shared-cost projects 2 998 Direct action by Joint Research Centre 236 (b) EEA support Indirect action and shared-cost projects 42 Direct action by Joint Research Centre 2. In 1996, ECU 3.3 billion was committed for research policy in the form of budgetary appropriations and additional funding, more than 3 billion of which was for indirect action within the framework programme. The breakdown of the commitments for the different areas of shared-cost projects is as follows: (million ECU). Information technology and communications Industrial technologies. 743 495 171. Environment Life sciences and technologies. 553. Non-nuclear energy. 174. Transport Targeted socioeconomic research Scientific and technical support for Community policies Cooperation with third countries and international organisations. 85 18 28 147. Dissemination and utilisation of research results. 61. Training and mobility of researchers Nuclear fission safety. 281 69. Controlled thermonuclear fusion. 198. The remaining ECU 278 million was committed for direct action by the Joint Research Centre (JRC) and work under contract with third parties. This year the Joint Research Centre continued to implement two framework programmes which it is carrying out for the European Community in the non-nuclear field and the European Atomic Energy Community in the nuclear field. Parallel to these activities, it carried out institutional research and scientific and technical support for the European Union's policies, competitive activities involving participation in shared-cost projects and work carried out under contract with third.
(34) 34. parties. In June, the Council adopted the new supplementary programme (1996-99) to be implemented by the JRC concerning the Petten high-flux reactor. In order to enable the JRC to continue to perform its role as effectively as possible, the Commission decided on a reorganisation whereby the JRC became an autonomous Directorate-General and two institutes at the Ispra site were merged, thus reducing the number of institutes to seven, at the sites in Ispra (Italy), Geel (Belgium), Petten (Netherlands), Karlsruhe (Germany) and Seville (Spain). The Commission continued its international cooperation activities under European scientific and technical cooperation (COST) and Eureka with the European Free Trade Association (EFTA) and with the main industrialised countries and also strengthened ils links with various European scientific organisations, such as the European Organi sal ion for Nuclear Research (CERN), the European Molecular Biology Laboratory (EMBL). the European Science Foundation (ESF) and the European Space Agency (ESA). The Commission continued its negotiations with Switzerland concerning a scientific and technical cooperation agreement and continued scientific and technical cooperation with non-European countries. An agreement granting full association to Israel in all non-nuclear programmes in the fourth framework programme was signed in March and entered into force in August, involving the payment of a financial contribution by Israel calculated on the basis of a formula that takes into account its relative strength vis-à-vis the European Union ( 1.06 %) and enabling its researchers to participate on an equal footing with their European partners.. safety, pilot schemes for combined transport, the development of long-term transport policy and inland waterways. The appropriations entered in the 1996 budget for this purpose (ECU 41 million) were committed in their entirety. Specifically addressing multimodal transport. on 24 July the Commission adopted a communication on an action programme to promote the combined transport of goods (PACT), together with a proposal for a regula tion authorising the granting of financial support in the period 1997-2001 to major schemes to promote combined goods transport, in continuation of pilol schemes already carried out. The overall budget is ECU 35 million. As part of ils strategy to organise the inland waterway transport market mapped oui in 1995. the Council adopted, on I1) November. the regulation providing for new structural improvement measures over the period 1996 98 and the possibility, in 1996 only, oí a Community financial contribution (ECU 20million) to national scrapping schemes.. Education, vocational training and youth policy The appropriations available in subsection B3 of the 1996 budget (contributions from EFTA countries excluded) were as follows: (1 lillion ECU). Transport. Education, vocational training anil youth policy Culture and audiovisual media Information and communication Employment, social protection and public health. To pave the way for the common transport policy, the Community budget helped finance a variety of measures relating to transport. The purpose of Decision 95/2493/EC of 23 October 1995 establishing 1996 as the European Year of Lifelong Learning was to. 397 119 113 190.
(35) 35. promote the role of education and training for the personal development of individuals and their integration into working life and society. ECU 5.2million was allocated for this purpose.. cember a proposal for a decision establishing a multiannual Community action programme. The aim of the proposal is to create a legal framework enabling this initiative to be pursued on a large scale.. The aim of Community action in the field of education, vocational training and youth is to promote European awareness among young people and help to integrate them into working life. The Socrates programme (with a budget of ECU 173 million in 1996) covers the entire educational spectrum, while the Youth for Europe programme (ECU 24 million) is concerned with cooperation in the field of youth policy. These two programmes cover the period 1995-99.. In the field of vocational training, implementation of the Leonardo da Vinci programme, covering the years from 1995 to 1999, continued in 1996, with available appropriations for the programme amounting to ECU 152 million. Leonardo da Vinci has four objectives: enhancing the quality of vocational training in Europe; developing exchange schemes; acquiring a better understanding of the way training operates and actual training requirements; and making it easier to adapt to the information society.. At the start of 1996, the Commission launched a European voluntary service pilot scheme with a budget for 1996 of ECU 15 million on the basis of guidelines adopted on 24 January 1996. The scheme enabled some 2 500 young people between the ages of 18 and 25 to take part in voluntary activities of a social or humanitarian nature lasting for six months to one year. In view of the response, the Commission adopted on 23 De-. Some appropriations were also allocated to the less widespread languages and cultures (ECU 4.0 million) and cooperation with nonmember countries (ECU 3.9 million). The European Centre for the Development of Vocational Training (Cedefop) received a subsidy of ECU 12.3 million, with a further ECU 2.3 million to cover the cost of its relocation to Thessaloniki (Greece)..
(36)
(37) 37. Education, vocational training and youth policy Education, vocational training and youth policy are now clearly among the European Union's political priorities. As well as helping to develop skills to improve employment possibilities, this field is closely connected with the desire to bring Europe closer to the people and to guarantee the protection and strengthening of the European social model. The prospects'presented in the White Paper on education and vocational training adopted by the Commission at the end of 1995 must be seen as the most likely scenario and the objective to be aimed at. Our societies are going to become 'cognitive' societies, in the sense that access to knowledge and skills will become a factor determining their future. This trend is increasingly acquiring a European dimension, in that the Union is seen as the level at which to respond to globalisation, the building of the information society and the scientific and technical revolution. Action at Community level is growing in importance regarding problem analysis, the search for solutions and economies of scale that can be made through cooperation. Since the Erasmus and Comett programmes were adopted some 10 years ago, Community action in this field has been based on various programmes, which have now been rationalised and reinforced in three programmes covering the period from 1995 to 1999: D Socrates, covering cooperation in the field of education; D Leonardo da Vinci, in the field of vocational training; D Youth for Europe, which covers youth policy.. The 1996 European Year of Lifelong Learning was an opportunity to raise awareness of the importance of education and training for the future of European society. The year also saw the launch of the pilot scheme for a European voluntary service, as a new strand of youth policy. The Socrates programme. The main aim of the Socrates programme is to contribute to the development of quality education by stimulating cooperation between Member States. The objective of the activities it supports is to further the gradual building of a single European area for education by developing the ability of teaching to adapt and to anticipate political, social, economic and technological change so that young and adult learners may receive an education that enables them to live and work within the new framework of the European Union. This new programme incorporates aspects of the old Erasmus and Lingua programmes, supporting them with new measures addressing all levels of teaching. Chapter I (Erasmus) deals with higher education, offering financial assistance to universities to help them develop projects with a European dimension: institutional contracts (to increase mobility of students and teachers, to prepare programmes and courses, the European credit transfer system (ECTS), preparatory visits, etc.) and university joint projects on subjects of mutual interest (thematic networks). Chapter I also finances student grants to encourage mobility. Chapter II (Comenius) deals with school education and is one of the important new elements in the programme. It supports partnership between schools in different countries built around European education projects (including teacher exchanges and visits). This chapter also includes and extends measures for the children of migrant workers, gypsies and travellers and occupational travellers..
(38) 38. Finally, it finances transnational in-service training projects for teachers. Chapter III of Socrates comprises a series of horizontal measures, notably the Lingua programme promoting the learning of languages (European joint programmes for teachers, inservice training, assistant posts for future teachers, joint projects for language learning). There are specific measures covering open and distance learning and the promotion of the European dimension in adult education. These activities are supported by various measures (the Eurydice education information network, study visits for education policymakers, etc.).. The Leonardo da Vinci programme. Its main aim is to ensure the implementation of a vocational training policy, supporting and complementing measures taken by Member States. More precisely, the programme aims to promote cooperation between Member States with the purpose of gradually developing a single area for training and vocational qualifications. It includes former Community programmes such as PETRA (initial training), FORCE (in-service training), Comett (cooperation between universities and companies) and Eurotecnet (the promotion of qualifications linked to technological innovation). The Leonardo da Vinci programme therefore aims to improve the effectiveness and quality of vocational training systems and mechanisms that need to satisfy the training requirements of individuals and business, particularly small firms. It is trying to improve the quality of training methods, processes and tools. Its aims are also to support innovation in the management, methodology and equipment involved in vocational training, to use vocational training to promote and disseminate technological innovation and developments in production systems, to increase the ability of. training and vocational qualification systems to respond to change and to encourage the development of open and distance learning. Lastly, it contributes to the development of a European dimension at all levels of training, particularly through the learning and diffusion of Community languages and the support it gives to the European vocational training network. It order to achieve these objectives, the programme offers Community support to three types of transnational cooperation: pilot projects promoting exchange and pooling of know-how and experience; placements in a company or training body in another country to further the transfer of experience through physical mobility; and studies and analyses carried out at European level to encourage the sharing of ideas and common points of reference.. The Youth for Europe programme. The Youth for Europe programme is the main mechanism for promoting cooperation in the field of youth policy. Its general objective is to contribute to the educational process for all young people, through activities which are complementary to both those of the Member States and those at Community level in education and training. The main aspect of the Youth for Europe programme concerns activities directly involving young people. The programme supports youth exchanges, designed to promote greater comprehension of the diversity of European society and the value of that diversity. It also finances projects set up and managed by young people, helping them to develop a sense of initiative and creativity. This is backed up by other aspects which promote the training of youth workers (exchanges of experience and knowledge,.
Figure


+7


Related documents