This is a repository copy of Atom probe tomography analysis of the reference zircon gj-1:
An interlaboratory study.
White Rose Research Online URL for this paper: http://eprints.whiterose.ac.uk/137226/
Version: Accepted Version
Article:
Exertier, F, La Fontaine, A, Corcoran, C et al. (23 more authors) (2018) Atom probe tomography analysis of the reference zircon gj-1: An interlaboratory study. Chemical Geology, 495. pp. 27-35. ISSN 0009-2541
https://doi.org/10.1016/j.chemgeo.2018.07.031
© 2018 Elsevier B.V. Licensed under the Creative Commons
Attribution-NonCommercial-NoDerivatives 4.0 International License (http://creativecommons.org/licenses/by-nc-nd/4.0/).
Reuse
This article is distributed under the terms of the Creative Commons Attribution-NonCommercial-NoDerivs (CC BY-NC-ND) licence. This licence only allows you to download this work and share it with others as long as you credit the authors, but you can’t change the article in any way or use it commercially. More
information and the full terms of the licence here: https://creativecommons.org/licenses/
Takedown
If you consider content in White Rose Research Online to be in breach of UK law, please notify us by
Atom probe tomography analysis of the reference Zircon GJ-1: a
round-robin experiment
A. La Fontaine1,2,*, F. Exertier1,2, C. Corcoran3, S. Piazolo3,4, E. Belousova4, Z. Peng5, B.
Gault5, D. W. Saxey6, D. Fougerouse6, S. M. Reddy6, S. Pedrazzini7, P. A. J. Bagot8, M. P.
Moody8, B. Langelier9, D.E. Moser10, G.A. Botton9, F. Vogel11, G.B. Thomson11, P.T.
Blanchard12, A.N. Chiaramonti12, D.A. Reinhard13, K.P. Rice13, D. Schreiber14, K.
Kruska14,W. Jing14, J. M. Cairney1,2
1School of Aerospace, Mechanical, Mechatronic Engineering, University of Sydney, NSW
2006, Australia
2Australian Centre for Microscopy and Microanalysis, University of Sydney, NSW 2006,
Australia
3Australian Research Council and Centre of Excellence for Core to Crust Fluid Systems /
GEMOC, Department of Earth and Planetary Sciences, Macquarie University, NSW 2109, Australia
4School of Earth and Environment, University of Leeds, UK
5Max-Planck-Institut für Eisenforschung GmbH, Max-Planck-Straße 1, 40237 Düsseldorf,
Germany
6Geoscience Atom Probe, Advanced Resource Characterisation Facility, John de Laeter
Centre, Curtin University, WA, 6102, Australia
7Department of Materials Science and Metallurgy, University of Cambridge, Cambridge CB3
0F3, UK
8Department of Materials Science, University of Oxford, Parks Road, Oxford, OX1 3PH, UK
9Department of Materials Science and Engineering, and Canadian Centre for Electron
Microscopy, McMaster University, 1280 Main Street West, Hamilton, ON, L8S 4M1, Canada
10Department of Earth Sciences, University of Western Ontario, 1151 Richmond Street,
London, ON, N6A 5B7, Canada
11Department of Metallurgical & Materials Engineering, University of Alabama,Tuscaloosa,
AL 35401
12National Institute of Standards and Technology, NIST Boulder, U.S. Departement of
commerce
13CAMECA Instruments, Inc., 5470 Nobel Dr, Madison, WI 53711
14Pacific Northwest National Laboratory, MSIN J4-55 Richland, WA 99352 USA
*corresponding author: A. La Fontaine, [email protected]
ABSTRACT
In recent years, atom probe tomography (APT) has been increasingly used to study minerals,
and in particular Zircons. The mineral Zircon (ZrSiO4) is ideally suited for geochronology by
utilising the U-Th-Pb isotope systems, and trace element compositions are also widely used to
constrain petrogenetic processes. However, while standard geoanalytical techniques provide
information at micron scale lengths, the unique combination of chemical/isotopic sensitivity
and spatial resolution of APT allows compositional measurements at the nanoscale. This round
and assessing the role of different aspects of the atom probe workflow on reproducibility. This
is essential to allow correct evaluation of APT results and full utilization of this emerging
technique within the geoscience community. In this study, nine samples from the same GJ-1/87
grain were sent to nine APT institutes in Europe, USA, Canada and Australia. Each institute
conducted three different rounds of APT analyses: using (i) unconstrained analysis parameters,
[1] pre-defined analysis parameters, and (iii) a data analysis exercise. Data such as the measured
composition, acquisition parameters, or mass spectrum peak identifications, were recorded and
analyzed. We observe a significant variation in the measured composition across this round
robin study as well as the number of trace elements identified. These differences are thought to
directly result from the user’s choice of peak identification, ranging and background correction model. The type of instrument does not seem to be a critical factor.
Consequently, comparison of absolute trace element data on zircon using APT between
laboratories is only valid if the same workflow has been ensured.
KEY WORDS
Round robin; Atom probe tomography; zircon
1. INTRODUCTION
The accessory mineral zircon (ZrSiO4) is commonly used in geoscience as a geochronometer
utilising the U-Th-Pb isotope systems and also as a trace element monitor. This is essentially
due to its ability to specifically incorporate very specific trace elements such as U and Th, but
exclude Pb during crystallization as well as the robustness of its lattice structure, composed of
isolated SiO4 tetrahedra, which leads to refractory and weather-resistant properties. [2, 3] The
extremely slow diffusivity of solutes, even at high temperature, and the homogeneity of trace
element distribution, both contribute to zircon’s use as a “recording system”. [4-6]
Laser ablation inductively coupled mass spectrometry (LA-ICPMS) is commonly used to
measure the trace element composition in zircons because of its high chemical sensitivity,
despite a spatial resolution limited to ~10 µm. [7] In the last decade, studies using advanced
electron microscopy, cathodoluminescence and secondary ion mass spectrometry showed that
trace elements can be heterogeneously distributed within zircons at the micrometer and
and trace element mobility, the geoscience community requires techniques that combine
sub-micrometer spatial resolution with high chemical sensitivity. For example, high-resolution ion
microprobe (nano-SIMS) can reach a lateral resolution as small as to 50 nm while maintaining
a high chemical sensitivity, usually below 1 ppm. [16-18] In parallel, atom probe tomography
(APT) has recently emerged as a technique providing three-dimensional, subnanometer-scale
analysis of minerals with a unique combination of chemical/isotopic sensitivity and near-atomic
resolution. [19, 20] In recent years, APT has been increasingly applied to the study of trace
element distribution in zircons. [21-25]
APT relies on the effect of an intense electric field generated at the tip of a 50-100 nm diameter
needle-shaped specimen biased to a high voltage, in the range of 3–11kV. As this electrostatic
field reaches a critical value in the range of 1010–1011 Vm-1, the surface atoms are progressively
ionized and desorbed from the surface in a process known as field evaporation. Upon
laser-assisted field evaporation, the ions are accelerated away from the specimen and projected onto
a position-sensitive detector, with a magnification that routinely reaches 106x. Field evaporation
is a thermally-assisted process, critically dependent on the amplitude of the electric field.
Time-control of the field evaporation process is gained by superimposing laser pulses to the DC
voltage, allowing for time-of-flight mass spectrometry with unrivalled spatial resolution.
Modern atom probe microscopes are of two main types, with some fitted with a reflectron lens,
which acts as an electrostatic mirror that modifies the flight path of ions having different kinetic
[image:4.595.74.236.531.659.2]energies to improve the mass resolution, while maintaining the field-of-view. [26, 27]
After some early attempts [28, 29], improvements in APT instrumentation and specimen
preparation methods have supported a rising interest by the geoscience community in recent
years [22-25, 30], as evidenced by the number of published documents reported in
Figure 1. Hence, it is timely for the APT community to evaluate the reproducibility of the
technique on well-characterized, standard geological materials. It has been widely reported that
the composition measured by APT is dependent on the analysis conditions, namely the base
temperature, the pulsing mode (high-voltage vs. laser), the laser pulse energy, the amplitude of
the DC field, detection rate, the type of instrument and detector used. [31-41]. In order to
monitor experimental biases and results reproducibility, the geoscience community relies on
stable and homogenous reference zircons that have enabled routine compositional analysis
using LA-ICPMS [42]. One such reference zircon (GJ-1) was developed by the ARC National
Key Centre for Geochemical Evolution and Metallogeny of Continents (GEMOC) and the ARC
Centre of Excellence for Core to Crust Fluid Systems (CoE/CCFS) at Macquarie University in
Australia. In recent years, it has been widely distributed and used as a chemical reference
material for zircon U-Pb geochronology and Hf-isotope analysis. [43]
Here, we report on a round-robin APT experiment making use of one grain of this reference
zircon GJ-1. To date, only few round-robin experiments in APT have been reported in the open
literature [44, 45], but the community is increasingly using this approach to assess analysis
methods and techniques. For example, testing the reliability of clustering analysis methods on
the same simulated and experimental data sets [1], or the influence of the user on the definition
of ranges to translate a mass spectrum into an elemental composition [46]. Our effort,
coordinated at the University of Sydney, is the first of its kind on a geological material and has
utilised nine state-of-the-art instruments spread across Europe, Canada, USA and Australia.
Fragments from the same zircon GJ-1 grain (grain # 87) were cut and sent to the different
laboratories for analysis. The round-robin consisted of 3 different rounds of analysis: (i)
unconstrained acquisition parameters and data processing; (ii) pre-defined acquisition
parameters, and (iii) data processing solely, on a constrained dataset. Here we present the results
from this round robin experiment, namely, recording the acquisition parameters, the quality of
the mass spectra, the identification of peaks in the mass spectrum, and the subsequent
measurement of the composition, for the primary and trace elements. From our analysis, we
2.1 Round robin experiments
This round robin study was set up as a collaboration between nine APT laboratories in five
different countries equipped with four different models of commercial Local Electrode Atom
[image:6.595.72.526.463.656.2]Probes (CAMECA LEAP®) , all equipped with UV ( =355nm) laser systems as summarized in
Table 1. The single grain of reference zircon was obtained from GEMOC/CCFS at Macquarie
University in Australia.
LEAP 5000XS Straight Flight Path 3 instruments LEAP 5000XR Reflectron 2 instruments LEAP 4000X HR Reflectron 3 instruments LEAP 4000X Si Straight Flight Path 2 instruments
Table 1: Instruments used in this round robin experiment
Eleven fragments were sectioned from zircon GJ-1/87 to a size of a few mm2 each. Those
samples were given directly to the participants at the Atom Probe Tomography and Microscopy
conference in 2016 (APT&M 2016), without providing any information on the sample, except
that it was a reference zircon. All participants received a document that defined the protocol of
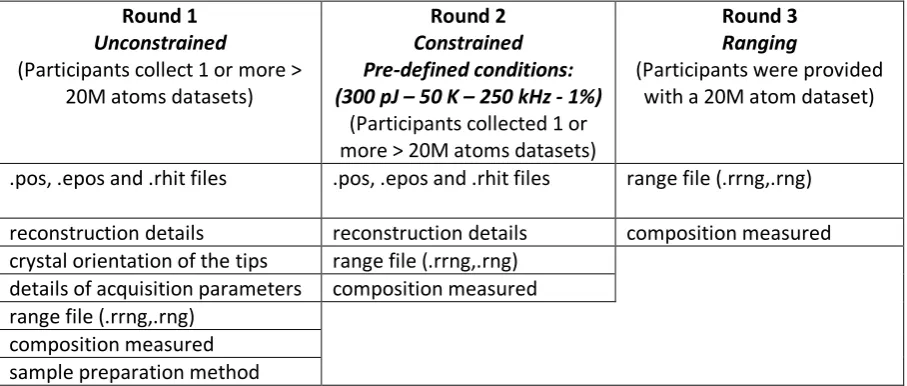
the round robin. The participants were asked to share the results listed in table 2.
Round 1
Unconstrained
(Participants collect 1 or more > 20M atoms datasets)
Round 2
Constrained Pre-defined conditions: (300 pJ 50 K 250 kHz - 1%)
(Participants collected 1 or more > 20M atoms datasets)
Round 3
Ranging
(Participants were provided with a 20M atom dataset)
.pos, .epos and .rhit files .pos, .epos and .rhit files range file (.rrng,.rng)
reconstruction details reconstruction details composition measured crystal orientation of the tips range file (.rrng,.rng)
details of acquisition parameters composition measured range file (.rrng,.rng)
composition measured sample preparation method
Table 2: Summary of data provided by participants.
The reference zircon used in this study is GJ-1/87 (grain 87): a centimeter size gem quality
zircon obtained from GEMOC/CCFS at Macquarie University in Australia. This
well-characterized zircon is exceptionally homogeneous from atomic to millimeter scale, as shown
in a recent study utilising APT, LA-ICPMS, transmission Kikuchi diffraction (TKD) and
electron backscattered diffraction (EBSD). [43] Prior to cutting the samples from the
single-crystal GJ-1/87, its homogeneity was evaluated by using EBSD (2a). For EBSD, the zircon
grain was mechanically polished and then finished with a colloidal silica-water solution. The
sample was then carbon coated. EBSD was performed on a Zeiss EVO scanning electron
microscope (SEM) coupled with a HKL NordlysNano high sensitivity EBSD detector and a
tungsten source operated at 20 kV. AzTec software (Oxford Instruments) was used to index the
EBSD patterns, and the results confirmed that GJ-1/87 is a single grain with no noticeable
crystal plastic deformation. The sample was then sectioned using a diamond saw into eleven
pieces with a section of approximately 1 mm2 and nine of them were given to the participants.
In this study, the samples were named with the following convention:
- Number : 4 (LEAP 4000) or 5 (LEAP 5000)
- Letter: R (Reflectron) or S (Straight flight path)
[image:7.595.71.527.443.631.2]- Roman number: I, II or III for different samples
Figure 2: Multi-scale analysis of reference zircon GJ-1/87, confirming absence of structural
disturbances and macro-to-nano homogeneity. (a) optical image of a small piece from GJ-1/87 (spare piece 87 K) and EBSD analysis of GJ-GJ-1/87 (b) Cathodoluminescence and
Most participants independently performed electron imaging and EBSD analysis. Figure 2b
shows images from the SEM and EBSD analyses performed at The University of Sydney
(sample piece 4R-I). TKD was also performed on most of the atom probe specimens. TKD
analysis on a tip and the associated atom maps from the reconstructed APT dataset is displayed
in figure 2c (sample piece 4S-II).
Analysis Al P Ti Cu Ga Ge As Rb Y Nb Hf Ta Pb Th U
Average 5.38 30.5 4.51 0.10 0.45 0.18 0.21 0.06 197 2.01 5535 0.48 76.9 14.1 222
0.21 3.0 0.23 0.01 0.02 0.05 0.05 0.01 6.7 0.07 186 0.02 3.3 0.5 8.4
Analysis La Ce Pr Nd Sm Eu Gd Tb Dy Ho Er Tm Yb Lu
Average 0.002 15.2 0.03 0.71 1.51 0.89 5.53 1.59 17.3 5.55 23.7 5.46 58.3 8.98
0.001 0.64 0.002 0.03 0.06 0.03 0.23 0.05 0.6 0.18 0.83 0.18 2.1 0.30
Table 3: Summary of LA-ICPMS trace element concentrations (ppmw) for the GJ-1/87
zircon standard. (Full data in table S1)
No major cracks or other structural disturbances were observed at the micrometer and
sub-micrometer scale in the sample shown. However, we note that one participant reported unusual
cracks at the sub-micron scale that complicated the APT specimen preparation and successful
analysis. This sample may have been damaged during or after sectioning. The nominal
composition of zircon (ZrSiO4) is 66.6 at. % O, 16.6 at. % Zr and 16.6 at. % Si. Trace element
concentrations (Table 3) for the GJ-1/87 zircon sample were acquired in-situ using a Photon
Machine Analyte Excite Excimer Laser Ablation System (193 nm) attached to an Agilent
7700cx quadrupole inductively coupled plasma mass spectrometer (ICPMS). The working
conditions for these analyses were as follows: 5.29 j/cm2 fluence (or intensity), 50 µm spot size,
and a frequency of 5 Hz for the laser pulse rate. The internal standards chosen were CaO for
the reference materials (STD610 & BCR2G) and ZrO2for the sample analyses.
3. Results and discussion
3.1 Peak identification
Species identification in APT is based on the time-of-flight (TOF) of the field-evaporated ions,
converted into a mass-to-charge-state ratio, reported in daltons (Da). The mass-to-charge data
is usually represented in a histogram, or ‘mass spectrum’, with peaks in the spectrum
corresponding to the detected ions. The shapes of these peaks in APT mass spectra result from
time delays in the field evaporation process (laser pulsing), or from a spread in the energy of
This tail can overlap with other peaks from the same or other elements located at higher
mass-to-charge ratios. The background in the mass spectrum is caused by a combination of dark
current from the detector, ionization of residual gases from the vacuum chamber by the
electrostatic field, and potentially field evaporation of atoms from the specimen thermally
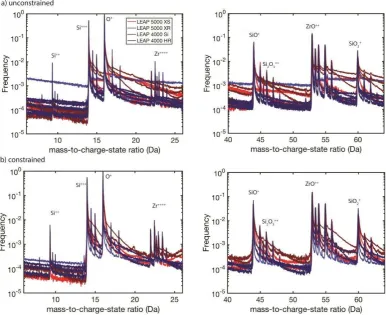
activated at the base temperature (generally 20–80 K). A representative mass spectrum is shown
in figure 3, and its main features are typical of those acquired from zircons. This mass spectrum
was compiled from the sum of all the mass spectra recorded in the unconstrained round and
represents over 380 million detected ions.
During the data processing, the user is assisted in a series of automated correction steps by the
commercial software package, CAMECA IVASTM, which was used by all participants in the
round robin study. For instance, necessary calibration and correction of the measured
time-of-flight is performed via application of the methods outlined in [20, 48]. It is performed in a
two-step process, successively adjusting the voltage and the flight distance (i.e bowl) corrections
for a single mass spectrum peak in order to optimize the peak resolution. These corrections are
followed by a mass-to-charge conversion. [20] Here, we are not discussing the influence of
those corrections on the overall composition measurements as they are performed blind by all
users and are expected to behave in a similar way on all versions of the commercial software
used here. We instead focus on the following steps of the data processing, namely the mass
spectrum peak identification, ranging and background estimation and correction. The
identification of the peaks in the mass spectrum is done manually by the user, who specifies a
range of mass-to-charge-state ratios in the mass spectrum to which a specific type of atomic or
molecular ion is associated. These mass ranges are one of the key input files in the commercial
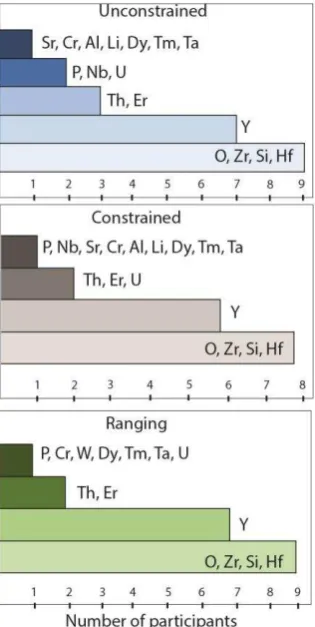
software package. As shown in Figure 4, four elements were identified consistently by all
Figure 3: Mass spectrum from zircon GJ-1/87 obtained from the sum of all mass spectra
collected in the unconstrained round. Different background correction models highlighted in red.
The majority of participants also identified Y for all rounds. Th, Er and U were identified by
two participants and one participant identified more than seven trace elements. The chemical
sensitivity of APT is influenced by the position and number of peaks associated with a single
element in the mass spectrum, which may include peaks arising from multiple isotopes,
molecular ion complexes, and different charge states. In addition, the background level varies
across the mass spectral range. In ideal situations, the chemical sensitivity of APT may be below
10 ppma for some elements (Al for example) and as high as hundreds of ppma for others (U for
example). The detection of minor trace elements also depends on the size of the dataset. The
peaks for some trace elements, such as Th or Er, may be very challenging to quantify with high
confidence because they are often similar in magnitude to the local background noise, and may
also suffer from isobaric interference or non-detection of their minor isotopes, which can make
it difficult to identify them using expected isotopic ratios. It currently falls to the user to decide
whether or not to identify and include a peak with a low signal-to-background ratio. In this
study, the user choice appeared to be the main factor determining the number of elements
identified. There was also no apparent trend between the type of instrument used and the
[image:10.595.76.278.74.240.2]Figure 4: Elements identified in the round robin (excluding C, H and Ga).
The identification of the main elements (O, Zr and Si) and the two main trace elements (Hf and
Y; 5535 and 197 ppmw based on LA-ICPMS data) by most of the participants is consistent with
previous APT studies of homogeneous zircons in the absence of clustering. [24, 25, 43] (Fig.
4) It is important to note the potential for incorrect ranging in the more detailed trace element
analyses, which mostly results from molecular interferences with Zr, Si and O complexes.
Essentially, it is up to the participant to push the trace element ranging and confidently address
the molecular interferences. In this round robin study, no guidance was given to the participants
with respect to data ranging and the difference in participants’ geochemistry background is
significant, which could explain the distribution observed in the zircon trace element
identification.
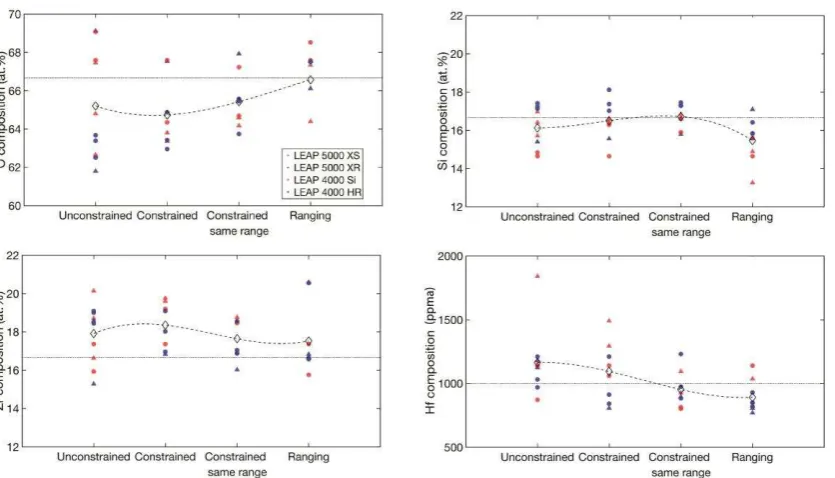
Figure 5 shows the composition of O, Zr, Si and Hf measured for all three rounds. The full
compositions for this study are shown in supplementary tables S3 and S4. The average O
content for all rounds (~ 65 at. %) is below its expected nominal composition and its maximum
Figure 5: Composition measured for the 4 main elements identified by all participants (O, Zr,
Si and Hf) in all rounds. The “constrained same range” data points represent the compositions
measured in the constrained round using a prescribed same range that was best fitted to the mass spectra. The average composition is displayed as diamonds. The expected stoichiometric values are also displayed in each case (dashed lines).
The Zr content is consistently overestimated with an average of ~ 18 at.%, while the Si content
is closer to its nominal value with an average of ~ 16 at. %. These results are consistent with
previous APT studies of zircons, which reported both a deficit of O and a variation in Zr and Si
content. [22-25] Hf composition is quite consistent with LA-ICPMS results at around ~ 1000
ppma (~ 5000 ppm).
Figure 5 shows a substantial decrease in the composition value dispersion between the
unconstrained and constrained rounds for O and Si. It shows that the different analysis
parameters lead, as expected, to a substantial variation in the resulting composition. The
harmonization of the ranging and background correction model decrease the deviation in the
measured composition even further, as shown in Figure 5. The data points corresponding to
the ranging round confirm the importance of ranging, and the associated background correction
models, by showing a greater variation in measured composition compared to the constrained
round using the same range.
Once the majority of peaks have been identified and ranged, the background contribution needs
to be subtracted in order to obtain an accurate composition. There are three background
correction models available in IVAS: (i) global TOF-based which is a background estimate
based on the TOF spectrum of the entire dataset that is calculated before reconstruction; (ii)
local mass-based correction, which is similar to the global TOF-based estimate but is calculated
separately for each mass spectrum created; and (iii) local ranged-assisted background
correction, which is calculated for each ranged peak based on the number of counts on either
side of the range. [49] The three models are schematically represented in the mass spectrum
presented in figure 2.
The data is summarized in supplementary table S2. Seven out of nine participants used the local
ranged-assisted background correction. One participant used a background removal method
developed in-house, one used the local mass-based correction. The choice of background
correction model can be made after the reconstruction.. For complex mass spectra such as those
from zircon, the background level varies greatly across the TOF range with the contribution of
several, overlapping peak tails. Hence, a more localized evaluation of the background for each
peak yields more accurate results. Here, most participants chose the local ranged-assisted
background correction, hinting towards a possibility to standardize the background correction
model.
3.3 Acquisition and reconstruction parameters
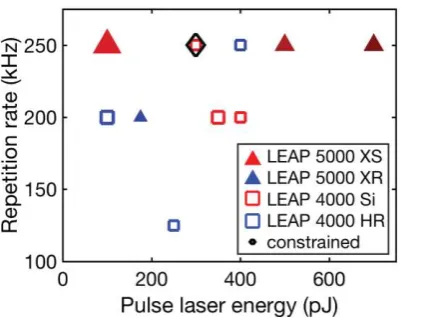
Figure 6 summarizes the principal acquisition parameters used by participants in the
unconstrained round. Nearly 20 % of the atom probe data sets were collected with a laser energy
of 100 pJ and about 70 % with a laser energy of 400 pJ and below. The majority of participants
used an evaporation flux of 1 ion or less per 100 pulses on average, and a specimen base
temperature between 45 K and 55 K. The laser pulse frequency varied from 125 kHz to 250
kHz. However, it is irrelevant to compare straight flight path and reflectron-fitted systems in
terms of pulse frequency. Often the laser pulse frequency for reflectron-fitted systems is
lowered in order to include species with longer times-of-flight..
There is no evident correlation between the acquisition parameters used and the LEAP models
(fig. 6). The laser pulse energy is the parameter that varied the most between participants. It is
data obtained in a typical APT experiment must be reconstructed in order to visualize the 3D
volume. Using the simple flight path geometry and the assumption that the specimen is a
hemi-spherical cap on a truncated cone, the ion impact detector coordinates can be used to determine
the lateral position of the atoms at the surface of the specimen, and the sequence of evaporation
is used to deduce the depth of the atoms within the specimen. The most common APT
reconstruction algorithm is based on the work from Bas et al., Geiser et al. and Gault et al.
[50-52]. The reconstruction is generally completed with CAMECA’s commercial software package
IVASthrough semi-automated steps where the user can choose to use default parameters or
[image:14.595.73.291.265.424.2]calculate their own reconstruction parameters.
Figure 6: Acquisition parameters used in the unconstrained round: laser pulse energy vs
repetition rate. Sample temperature is represented as color brightness (bright 45 K to dark 60 K). Markers are scaled in size according to the detection rates, ranging from 5 ions per 1000 pulses to 2 ions per 100 pulses on average. The black diamond represents the acquisition parameters set in the constrained round. (The full data is reported in Supplementary Table S2)
Optimization of the reconstruction accuracy is widely considered to be a crucial aspect of the
APT data processing, as it directly affects the spatial accuracy with which the 3D representation
of the field-evaporated volume reflects the true specimen microstructure. In the case we
investigate here, where the material is expected to be homogeneous, and we are mainly
concerned with composition, the reconstruction step is less critical.
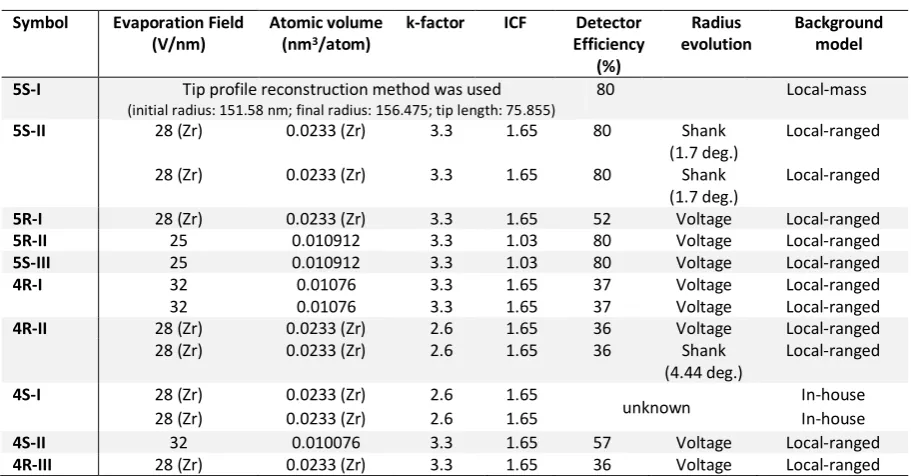
Table S2 shows that the majority of participants calculated their own image compression factor
(ICF) and k-factor or used the combination of calculated field evaporation value and atomic
volume for Zr. A few participants used the default parameters provided in IVASTM and a single
participant used the so-called “tip profile” reconstruction method. [20]
The reconstruction method principally influences the spatial accuracy of the 3d reconstructed
GJ-1/87 sample is perfectly homogenous and as such does not contain any small features that could
be used to calibrate the reconstruction, and the nature of zircon field evaporation also does not
allow for calibration using crystallographic information. As a result, in this study the spatial
accuracy of the 3D volume was not tested.
3.4 Mass spectra and the resulting measured composition
Two close-ups of the mass spectra between 5–26 Da and 40–65 Da collected in both constrained
and unconstrained rounds are shown in Figure 7 (a) and (b) respectively. There are noticeable
differences in the background levels and the extent of thermal tails behind major peaks, both of
which are influenced by experimental parameters such as the shape of the specimen, the base
temperature which influences the thermal diffusivity of the material, the amplitude of the
electrostatic field, the laser pulse energy and the instrument vacuum quality. Not all of these
factors are easily controllable or reproducible, especially the parameters that are related to the
[image:15.595.74.461.403.718.2]A more quantitative way to compare mass spectra from different origins is to look at the
signal-to-background ratio for a selected peak versus charge-state-ratio (which gives an indication of
the field intensity) or background level around the H peak (informing on the vacuum state of
the instrument). Here the signal-to-background ratios were measured for the Y+++ peak, which
corresponds to one of the major trace elements within the zircon under investigation. Y+++ was
detected by most of the participants at a level of ~ 200 ppma on average (close to the level
detected by LAICPMS (197 ppmw). As shown in the inset in Figure 8 (b), the peak position in
the mass spectrum, at 29.66 Da, is clear of major thermal tails or isobaric overlaps. It is plotted
against the charge-state-ratio of ZrO (ZrO3+/ (ZrO3+ + ZrO2+)) in order to reflect the field
intensity (Figure 8 (a)). The charge-state-ratio of a peak has previously been shown to
qualitatively reflect the intensity of the field, [53, 54] where a higher charge-state-ratio
corresponds to higher field. The ZrO species was chosen for its abundance and the absence of
Figure 8: Measures of background noise and their dependence on the evaporation field, as
indicated by the ZrO charge state ratio
Interestingly, the signal-to-background ratios are higher for the reflectron-fitted systems and
also display less dispersion than for the straight flight path instruments (Figure 8 (a) and (b)).
[image:17.595.74.418.75.611.2]reflectron-smaller field of view for these systems. In order to sustain an equivalent detection rate,
experiments performed with reflectron-fitted systems will require a higher evaporation field
compared to a straight flight path system. Note that the field can be lowered with a higher laser
pulse energy or lower detection rate. The level of background is also slightly higher with a more
intense field, but this seems to have a limited impact on the signal-to-background ratios (Figure
8 (b) and (c)). While the instrument model (4000 vs 5000) does not appear to play a role in the
mass spectra quality, there is some improvement in signal-to-background ratios with
reflectron-fitted systems.
4. Conclusions
The variation in the measured composition across this round robin study highlights the need to
provide guidelines and/or standards for the APT study of specific types of materials. This study
confirms the importance of the user’s choice in identifying and ranging peaks. The local
ranged-assisted background model used by most of the participants is thought to be a good fit for such
complicated mass spectra and as a result should be a standard correction for APT of zircons.
The dispersion of parameters used by our participants to analyze and reconstruct the zircon
GJ-1/87 reflects the multiple factors that influence an APT experiment, posing a challenge for the
standardization of APT experimental protocols. The type of instrument has a small influence
on the data acquired, hence does not seem the most critical factor. Interestingly, in this study,
the experiments were performed at higher fields in the reflectron-fitted instruments due to the
detection efficiency being lower. Reflectron systems yield slightly better signal-to-background
ratios for the selected Y peak examined in this paper. Values of the laser pulse energy or
parameters that relate to the specimen geometry are too difficult to control or to be reproduced,
and only parameters from the analysis itself should be considered. The background has a strong
influence, and better ways to quantify this may be needed. Finally, the charge state ratios seem
an interesting parameter to use for APT data comparison as it can be monitored during the
REFERENCES
[1] E.A. Marquis, V. Araullo-Peters, A. Etienne, S. Fedotova, K. Fujii, K. Fukuya, E. Kuleshova, A. Legrand, A. London, S. Lozano-Perez, Y. Nagai, K. Nishida, B. Radiguet, D. Schreiber, N. Soneda, M. Thuvander, T. Toyama, F. Sefta, P. Chou, A Round Robin Experiment: Analysis of Solute Clustering from Atom Probe Tomography Data, Microscopy and Microanalysis 22(S3) (2016) 666-667.
[2] J. MacDonald, Zircon—Earth's timekeeper, Geology Today 29(3) (2013) 113-117.
[3] A. Möller, P. O'brien, A. Kennedy, A. Kröner, Polyphase zircon in ultrahigh temperature
granulites (Rogaland, SW Norway): Constraints for Pb diffusion in zircon, Journal of metamorphic Geology 20(8) (2002) 727-740.
[4] D. Cherniak, J. Hanchar, E. Watson, Rare-earth diffusion in zircon, Chemical Geology 134(4) (1997) 289-301.
[5] D.J. Cherniak, E.B. Watson, Diffusion in zircon, Reviews in mineralogy and geochemistry 53(1) (2003) 113-143.
[6] P.W.O. Hoskin, U. Schaltegger, The Composition of Zircon and Igneous and Metamorphic Petrogenesis, Reviews in Mineralogy and Geochemistry 53(1) (2003) 27-62.
[7] A. Radionova, I. Filippov, P.J. Derrick, In pursuit of resolution in time of flight mass
spectrometry: A historical perspective, Mass spectrometry reviews (2015).
[8] S.M. Reddy, N.E. Timms, P. Trimby, P.D. Kinny, C. Buchan, K. Blake, Crystal-plastic deformation of zircon: A defect in the assumption of chemical robustness, Geology 34(4) (2006) 257-260.
[9] S.M. Reddy, N.E. Timms, W. Pantleon, P. Trimby, Quantitative characterization of plastic deformation of zircon and geological implications, Contributions to Mineralogy and Petrology 153(6) (2007) 625-645.
[10] S.M. Reddy, N.E. Timms, P.J. Hamilton, H.R. Smyth, Deformation-related microstructures in magmatic zircon and implications for diffusion, Contributions to Mineralogy and Petrology 157(2) (2009) 231-244.
[11] S. Piazolo, H. Austrheim, M. Whitehouse, Brittle-ductile microfabrics in naturally deformed zircon: Deformation mechanisms and consequences for U-Pb dating, American Mineralogist 97(10) (2012) 1544-1563.
[12] N.E. Timms, P.D. Kinny, S.M. Reddy, Enhanced diffusion of uranium and thorium linked to crystal plasticity in zircon, Geochemical Transactions 7(1) (2006) 10.
[13] M.A. Kusiak, M.J. Whitehouse, S.A. Wilde, D.J. Dunkley, M. Menneken, A.A. Nemchin, C. Clark, Changes in zircon chemistry during Archean UHT metamorphism in the Napier Complex, Antarctica, American Journal of Science 313(9) (2013) 933-967.
[14] E. Kovaleva, U. Klötzli, G. Habler, J. Wheeler, Planar microstructures in zircon from paleo-seismic zones, American Mineralogist 100(8-9) (2015) 1834-1847.
[15] S.L. Harley, L.P. Black, A revised Archaean chronology for the Napier Complex, Enderby Land, from SHRIMP ion-microprobe studies, Antarctic Science 9(1) (2004) 74-91.
[16] M. Petrelli, K. Laeger, D. Perugini, High spatial resolution trace element determination of geological samples by laser ablation quadrupole plasma mass spectrometry: implications for glass analysis in volcanic products, Geosciences Journal 20(6) (2016) 851-863.
[19] B. Gault, M.P. Moody, J.M. Cairney, S.P. Ringer, Atom probe microscopy, Springer2012. [20] D.J. Larson, T.J. Prosa, R.M. Ulfig, B.P. Geiser, T.F. Kelly, Local electrode atom probe tomography, New York, US: Springer Science (2013).
[21] J.W. Valley, A.J. Cavosie, T. Ushikubo, D.A. Reinhard, D.F. Lawrence, D.J. Larson, P.H. Clifton, T.F. Kelly, S.A. Wilde, D.E. Moser, Hadean age for a post-magma-ocean zircon confirmed by atom-probe tomography, Nature Geoscience 7(3) (2014) 219-223.
[22] S. Piazolo, A. La Fontaine, P. Trimby, S. Harley, L. Yang, R. Armstrong, J.M. Cairney, Deformation-induced trace element redistribution in zircon revealed using atom probe tomography, Nature communications 7 (2016).
[23] E.M. Peterman, S.M. Reddy, D.W. Saxey, D.R. Snoeyenbos, W.D. Rickard, D. Fougerouse, A.R. Kylander-Clark, Nanogeochronology of discordant zircon measured by atom probe microscopy of Pb-enriched dislocation loops, Science Advances 2(9) (2016) e1601318. [24] A. La Fontaine, S. Piazolo, P. Trimby, L. Yang, J.M. Cairney, Laser-Assisted Atom Probe Tomography of Deformed Minerals: A Zircon Case Study, Microscopy and Microanalysis (2017) 1-10.
[25] S.M. Reddy, A. van Riessen, D.W. Saxey, T.E. Johnson, W.D. Rickard, D. Fougerouse, S. Fischer, T.J. Prosa, K.P. Rice, D.A. Reinhard, Mechanisms of deformation-induced trace element migration in zircon resolved by atom probe and correlative microscopy, Geochimica et Cosmochimica Acta 195 (2016) 158-170.
[26] P. Panayi, Atom probe, Google Patents, 2007.
[27] P. Clifton, T. Gribb, S. Gerstl, R.M. Ulfig, D.J. Larson, Performance Advantages of a Modern, Ultra-High Mass Resolution Atom Probe, Microscopy and Microanalysis 14(S2) (2008) 454-455.
[28] K. Kuhlman, R. Martens, T. Kelly, N. Evans, M. Miller, Fabrication of specimens of metamorphic magnetite crystals for field ion microscopy and atom probe microanalysis, Ultramicroscopy 89(1) (2001) 169-176.
[29] M. Miller, K. Russell, An APFIM investigation of a weathered region of the Santa Catharina meteorite, Surface science 266(1-3) (1992) 441-445.
[30] P.R. Heck, F.J. Stadermann, D. Isheim, O. Auciello, T.L. Daulton, A.M. Davis, J.W. Elam,
C. Floss, J. Hiller, D.J. Larson, Atom probe analyses of nanodiamonds from Allende,
Meteoritics & Planetary Science 49(3) (2014) 453-467.
[31] M. Miller, G. Smith, An atom probe study of the anomalous field evaporation of alloys containing silicon, Journal of Vacuum Science and Technology 19(1) (1981) 57-62.
[32] T. Hashizume, Y. Hasegawa, A. Kobayashi, T. Sakurai, Atom probe investigation of
III V semiconductors: Comparison of voltage pulse and laser pulse modes, Review of
scientific instruments 57(7) (1986) 1378-1380.
[33] M. Müller, B. Gault, G. Smith, C. Grovenor, Accuracy of pulsed laser atom probe tomography for compound semiconductor analysis, Journal of Physics: Conference Series, IOP Publishing, 2011, p. 012031.
[34] D. Saxey, Correlated ion analysis and the interpretation of atom probe mass spectra, Ultramicroscopy 111(6) (2011) 473-479.
[35] D. Santhanagopalan, D.K. Schreiber, D.E. Perea, R.L. Martens, Y. Janssen, P. Khalifah, Y.S. Meng, Effects of laser energy and wavelength on the analysis of LiFePO 4 using laser assisted atom probe tomography, Ultramicroscopy 148 (2015) 57-66.
[36] L. Mancini, N. Amirifar, D. Shinde, I. Blum, M. Gilbert, A. Vella, F. Vurpillot, W. Lefebvre, R. Lardé, E. Talbot, Composition of wide bandgap semiconductor materials and nanostructures measured by atom probe tomography and its dependence on the surface electric field, The Journal of Physical Chemistry C 118(41) (2014) 24136-24151.
contribution of the US Government and therefore is not subject to copyright in the United States, New Journal of Physics 18(3) (2016) 033031.
[38] I. Blum, L. Rigutti, F. Vurpillot, A. Vella, A. Gaillard, B. Deconihout, Dissociation dynamics of molecular ions in high DC electric field, The Journal of Physical Chemistry A 120(20) (2016) 3654-3662.
[39] F. Tang, B. Gault, S.P. Ringer, J.M. Cairney, Optimization of pulsed laser atom probe
(PLAP) for the analysis of nanocomposite Ti–Si–N films, Ultramicroscopy 110(7) (2010)
836-843.
[40] L. Yao, J. Cairney, C. Zhu, S. Ringer, Optimisation of specimen temperature and pulse fraction in atom probe microscopy experiments on a microalloyed steel, Ultramicroscopy 111(6) (2011) 648-651.
[41] G.D. Costa, H. Wang, S. Duguay, A. Bostel, D. Blavette, B. Deconihout, Advance in multi-hit detection and quantization in atom probe tomography, Review of Scientific Instruments 83(12) (2012) 123709.
[42] E. Belousova, Y. Kostitsyn, W.L. Griffin, G.C. Begg, S.Y. O'Reilly, N.J. Pearson, The growth of the continental crust: constraints from zircon Hf-isotope data, Lithos 119(3) (2010) 457-466.
[43] S. Piazolo, E. Belousova, A. La Fontaine, C. Corcoran, J.M. Cairney, Trace element homogeneity from micron-to atomic scale: Implication for the suitability of the zircon GJ-1 as a trace element reference material, Chemical Geology (2017).
[44] A.J. Melmed, J.J. Carroll, S.S. Brenner, Round-robin atom-probe experiment: Preliminary results, Ultramicroscopy 4(3) (1979) 386.
[45] S. Nakamura, Round-robin atom probe experiment: preliminary results in Japan Le Journal de Physique Colloques 47(C2) (1986) C2-459-C2-464.
[46] D. Hudson, G. Smith, B. Gault, Optimisation of mass ranging for atom probe microanalysis and application to the corrosion processes in Zr alloys, Ultramicroscopy 111(6) (2011) 480-486.
[47] D. Arvizu, P. Balaya, L. Cabeza, T. Hollands, A. Jäger-Waldau, M. Kondo, C. Konseibo, V. Meleshko, W. Stein, Y. Tamaura, H. Xu, R. Zilles, 2011: Direct Solar Energy. In IPCC Special Report on Renewable Energy Sources and Climate Change Mitigation [O. Edenhofer, R. Pichs-Madruga, Y. Sokona, K. Seyboth, P. Matschoss, S. Kadner, T. Zwickel, P. Eickemeier, G. Hansen, S. Schlömer, C. von Stechow (eds), (2011).
[48] J.T. Sebastian, O.C. Hellman, D.N. Seidman, New method for the calibration of three-dimensional atom-probe mass spectra, Review of Scientific Instruments 72(7) (2001) 2984-2988.
[49] Cameca, IVASTM 3.6.6 User Guide, 2013.
[50] B. Geiser, D. Larson, E. Oltman, S. Gerstl, D. Reinhard, T. Kelly, T. Prosa, Wide-field-of-view atom probe reconstruction, Microscopy and Microanalysis 15(S2) (2009) 292-293. [51] P. Bas, A. Bostel, B. Deconihout, D. Blavette, A general protocol for the reconstruction of 3D atom probe data, Applied Surface Science 87 (1995) 298-304.
[52] B. Gault, D. Haley, F. De Geuser, M. Moody, E. Marquis, D. Larson, B. Geiser, Advances in the reconstruction of atom probe tomography data, Ultramicroscopy 111(6) (2011) 448-457. [53] D.R. Kingham, Charge state of ions in liquid metal field ion sources, Applied Physics A 31(3) (1983) 161-164.
SUPPLEMENTARY
Analysis Al P Ti Cu Ga Ge As Rb Y Nb Hf Ta Pb Th U
GJ-87-01 5.35 34.0 4.63 0.12 0.43 <0.15 0.213 0.06 197 2.02 5563 0.50 76.6 14.1 222
GJ-87-02 5.43 29.0 4.42 0.07 0.45 <0.14 <0.15 0.08 198 2.02 5567 0.49 77.0 14.3 223
GJ-87-03 5.37 30.8 4.13 0.10 0.43 0.19 0.22 0.08 200 2.02 5573 0.48 75.6 14.4 216
GJ-87-04 5.38 29.7 4.64 0.08 0.44 <0.14 <0.15 0.05 202 2.00 5600 0.48 74.2 14.1 212
GJ-87-05 5.26 30.6 4.55 0.10 0.46 0.14 0.23 0.06 198 2.02 5546 0.46 75.1 14.1 215
GJ-87-06 5.27 30.6 4.45 0.10 0.43 <0.13 0.21 0.05 195 1.99 5541 0.49 76.0 14.2 221
GJ-87-07 5.28 28.5 4.34 0.08 0.43 0.17 <0.12 0.07 195 1.96 5549 0.48 73.5 13.8 213
GJ-87-08 5.41 32.2 4.95 0.11 0.46 0.21 0.15 0.06 196 2.00 5483 0.46 79.6 14.1 230
GJ-87-09 5.54 27.4 4.67 0.11 0.46 0.16 <0.12 0.05 192 1.97 5458 0.48 79.3 14.1 230
GJ-87-10 5.59 31.9 4.34 0.08 0.46 <0.12 0.23 0.06 192 2.06 5473 0.46 82.6 13.7 233
Average 5.38 30.5 4.51 0.10 0.45 0.18 0.21 0.06 197 2.01 5535 0.48 76.9 14.1 222
1SD 0.11 1.93 0.22 0.01 0.01 0.02 0.03 0.01 3.2 0.03 47 0.01 2.8 0.2 7.7
0.21 3.0 0.23 0.01 0.02 0.05 0.05 0.01 6.7 0.07 186 0.02 3.3 0.5 8.4
RSD% 3.9 9.8 5.1 10 4.9 28 24 14 3.4 3.7 3.4 3.8 4.2 3.9 3.8
Analysis La Ce Pr Nd Sm Eu Gd Tb Dy Ho Er Tm Yb Lu
GJ-87-01 0.002 15.2 0.03 0.66 1.46 0.84 5.44 1.55 17.2 5.55 23.7 5.49 58.0 9.04
GJ-87-02 0.002 15.3 0.03 0.65 1.47 0.91 5.38 1.59 17.3 5.59 23.8 5.46 58.7 9.03
GJ-87-03 0.001 15.0 0.03 0.72 1.50 0.87 5.48 1.64 17.2 5.59 24.2 5.52 57.7 9.2
GJ-87-04 0.002 14.8 0.03 0.72 1.48 0.87 5.54 1.61 17.7 5.68 24.2 5.54 57.9 9.15
GJ-87-05 0.001 14.9 0.02 0.72 1.46 0.89 5.56 1.6 17.2 5.55 23.8 5.39 57.8 9.06
GJ-87-06 0.001 15.2 0.03 0.69 1.43 0.87 5.61 1.61 17.5 5.53 23.4 5.45 58.0 8.93
GJ-87-07 <0.001 14.7 0.03 0.70 1.54 0.90 5.55 1.55 17.2 5.46 23.4 5.49 57.2 8.87
GJ-87-08 <0.002 15.5 0.04 0.72 1.50 0.92 5.65 1.59 17.2 5.54 23.7 5.41 59.1 8.95
GJ-87-09 <0.001 15.6 0.03 0.72 1.58 0.89 5.68 1.57 17.3 5.53 23.3 5.42 59.3 8.77
GJ-87-10 <0.002 15.2 0.03 0.73 1.50 0.91 5.48 1.57 17.1 5.51 23.3 5.43 58.8 8.78
Average 0.002 15.2 0.03 0.71 1.51 0.89 5.53 1.59 17.3 5.55 23.7 5.46 58.3 8.98
1SD 0.001 0.3 0.003 0.028 0.04 0.02 0.09 0.02 0.2 0.05 0.34 0.05 0.70 0.14
a 0.001 0.64 0.002 0.03 0.06 0.03 0.23 0.05 0.6 0.18 0.83 0.18 2.1 0.30
RSD% 48 4.2 7.5 4.8 4.1 4.1 4.2 3.6 3.4 3.3 3.5 3.4 3.5 3.3
a1 calculated using GLITTER 2008.
Symbol Temperature (K) Laser energy (pJ) Laser pulse (kHz) Detection rate (%)
5S-I 50 100 250 2
5S-II 40 500 250 1
30 700 250 1
5R-I 55 100 125 1
5R-II 50 175 Variable 0.5
5S-III 50 175 Variable 0.5
4R-I 54.7 100 200 0.8
54.7 100 200 0.7
4R-II 59.7 350 200 0.75
59.7 250 125 0.5
4S-I 54.7 100 200 0.7
57.3 400 200 0.5
4S-II 50 300 250 0.5
4R-III 50 400 250 0.5
Symbol Evaporation Field (V/nm)
Atomic volume (nm3/atom)
k-factor ICF Detector Efficiency (%) Radius evolution Background model
5S-I Tip profile reconstruction method was used (initial radius: 151.58 nm; final radius: 156.475; tip length: 75.855)
80 Local-mass
5S-II 28 (Zr) 0.0233 (Zr) 3.3 1.65 80 Shank
(1.7 deg.)
Local-ranged
28 (Zr) 0.0233 (Zr) 3.3 1.65 80 Shank
(1.7 deg.)
Local-ranged
5R-I 28 (Zr) 0.0233 (Zr) 3.3 1.65 52 Voltage Local-ranged
5R-II 25 0.010912 3.3 1.03 80 Voltage Local-ranged
5S-III 25 0.010912 3.3 1.03 80 Voltage Local-ranged
4R-I 32 0.01076 3.3 1.65 37 Voltage Local-ranged
32 0.01076 3.3 1.65 37 Voltage Local-ranged
4R-II 28 (Zr) 0.0233 (Zr) 2.6 1.65 36 Voltage Local-ranged
28 (Zr) 0.0233 (Zr) 2.6 1.65 36 Shank
(4.44 deg.)
Local-ranged
4S-I 28 (Zr) 0.0233 (Zr) 2.6 1.65
unknown In-house
28 (Zr) 0.0233 (Zr) 2.6 1.65 In-house
4S-II 32 0.010076 3.3 1.65 57 Voltage Local-ranged
[image:23.595.70.526.286.524.2]4R-III 28 (Zr) 0.0233 (Zr) 3.3 1.65 36 Voltage Local-ranged
Table S2 Acquisition and reconstruction parameters for unconstrained and constrained
unconstrained O Zr Si Hf Y
at % at % at % ppma ppma
5S-I 64.8 ±0.02 18.7 ±0.01 16.4 ±0.01 1840 ±7.37 126 ±1.93
5S-II 62.66 ±0.01 20.14 ±0.01 16.97 ±0.01 1126.75 ±100 191.81 ±100
62.66 ±0.01 20.14 ±0.01 16.97 ±0.01 1070.79 ±5.58 232.57 ±2.6
5R-I 61.80 ±0.01 18.58 ±0.01 15.40 ±0.01 1125.12 ±4.30
5R-II 67.45 ±0.03 16.63 ±0.02 15.71 ±0.02 1155.04 ±22.19 98.23 ±12.37
69.12 ±0.02 15.40 ±0.01 15.28 ±0.01 1180.20 ±16.97 106.39 ±9.42
5S-III 70.83 ±0.05 14.61 ±0.02 14.36 ±0.02 1283.34 ±58.13
4R-I 62.51 ±0.02 18.44 ±0.01 17.13 ±0.01 1030.77 ±7.05 52.51 ±1.59
62.23 ±0.02 18.16 ±0.01 17.13 ±0.01 1021.05 ±7.06 60.21 ±1.71
4R-II 63.67 ±0.01 19.00 ±0.01 17.23 ±0.01 969.42 ±6.93
63.76 ±0.01 18.96 ±0.01 17.19 ±0.01 900.29 ±7.15
4S-I 69.07 ±0.05 15.93 ±0.02 14.84 ±0.02 871.48 ±20.13 56.79 ±7.58
66.92 ±0.04 17.23 ±0.02 15.68 ±0.01 894.18 ±15.11 54.91 ±5.56
4S-II 69.61 ±0.02 15.14 ±0.01 15.13 ±0.01 829.53 ±6.54 50.53 ±1.61
4R-III 63.38 ±0.01 19.08 ±0.01 17.41 ±0.01 1210.00 ±10.00 90.00 ±10.00
63.24 ±0.01 19.16 ±0.01 17.48 ±0.01 1110.00 ±10.00 70.00 ±10.00
constrained O Zr Si Hf Y
at % at % at % ppma ppma
5S-I 63.80 ±0.02 19.60 ±0.01 16.40 ±0.01 1490.00 ±7.76 117.00 ±2.17 5S-II 63.35 ±0.01 19.75 ±0.01 16.60 ±0.01 1293.29 ±100.00 198.72 ±100.00
5R-I 67.53 ±0.01 16.83 ±0.01 15.56 ±0.01 806.41 ±2.08
4R-I 62.95 ±0.02 16.96 ±0.01 18.12 ±0.01 841.97 ±5.60 38.59 ±1.20
4R-II 64.87 ±0.00 18.02 ±0.00 17.02 ±0.00 912.25 ±0.69
4S-I 64.34 ±0.04 19.20 ±0.02 16.29 ±0.01 1059.70 ±21.16 70.91 ±5.95 4S-II 69.61 ±0.02 15.14 ±0.01 15.13 ±0.01 829.53 ±6.54 50.53 ±1.61 4R-III 63.42 ±0.01 19.08 ±0.01 17.37 ±0.01 1210.00 ±10.00 70.00 ±10.00
Ranging O Zr Si Hf Y
at % at % at % ppma ppma
5S-I 64.39 ±0.01 20.60 ±0.01 14.89 ±0.01 1036.30 ±4.59 204.37 ±2.04 5S-II 67.33 ±0.01 16.70 ±0.01 13.26 ±0.01 823.19 ±5.39 1389.86 ±63.69
5R-I 67.53 ±0.01 16.83 ±0.01 15.56 ±0.01 806.41 ±2.08
5R-II 66.11 ±0.01 16.70 ±0.01 17.09 ±0.01 771.40 ±8.73 58.76 ±3.80 4R-I 62.61 ±0.02 20.55 ±0.01 16.41 ±0.01 929.29 ±4.61 40.83 ±0.97
4R-II 67.51 ±0.01 16.59 ±0.01 15.82 ±0.01 849.07 ±5.46
[image:24.595.129.516.79.665.2]4S-I 68.52 ±0.03 15.75 ±0.01 15.59 ±0.01 849.70 ±11.91 53.99 ±3.94 4S-II 67.59 ±0.02 17.36 ±0.01 14.65 ±0.01 1739.44 ±7.94 68.20 ±7.13 4R-III 67.50 ±0.01 16.57 ±0.01 15.84 ±0.01 820.00 ±10.00 100.00 ±10.00
unconstrained Er Th Nb P U Cr
ppma ppma ppma ppma ppma ppma
5S-II 54.43 ±10 70.59 ±10 298.81 ±100 460.42 ±10
122.62
±1.89 105.34 ±1.75
332.85 ±3.11
444.41 ±3.59
5R-II 41.82 ±7.08 99.50 ±7.70 159.64
±18.11 70.63 ±9.30 11.62 ±5.47 11.62 ±5.47
36.82 ±5.36 52.64 ±5.79 158.58
±13.92 81.32 ±7.24 52.76 ±9.24 52.76 ±9.24
5S-III 195.22
±21.51
114.39 ±18.01
4S-I 664.05
±40.99 608.77 ±29.98
4S-II 22.80 ±1.08 9.51 ±0.70 47.99 ±1.57
Sc C Dy Li Al Tm Ta
ppma ppma ppma ppma ppma ppma ppma
5S-II 109.08 ±10 15.08 ±10 32.46 ±10
83.74 ±1.56 40.27 ±1.08 17.37 ±0.71
5R-II 289.55 ±7.25 84.08 ±6.83 14.32 ±6.92 13.67 ±5.47
230.28 ±5.24 61.93 ±5.17 21.96 ±4.66 16.24 ±4.07
5S-III 406.76 ±15.56
Table S4 Composition of minor trace elements measured by APT for the three rounds.
constrained Th Er U Nb
ppma ppma ppma ppma
5S-II 614.30 ±10.00 595.68 ±10.00 128.22 ±10.00
4S-I 544.42 ±23.81
4S-II 9.51 ±0.70 22.80 ±1.08
Cr C P Al Li
ppma ppma ppma ppma ppma
5S-II 64.23 ±10.00 57.01 ±10.00 48.50 ±10.00 11.28 ±10.00
4S-I
4S-II 47.99 ±1.57
ranging Er N U P Cr
ppma ppma ppma ppma ppma
5S-II 23360.39 ±28.36 66.55 ±6.96 1375.55 ±6.96
5R-II 33.95 ±2.12 50.96 ±5.96
4S-I 490.79 ±24.83
Th Dy W Tm
ppma ppma ppma ppma
5S-II 25.55 ±6.96 63.42 ±6.96
5R-II 31.95 ±2.21 14.53 ±2.48
[image:25.595.117.529.87.389.2]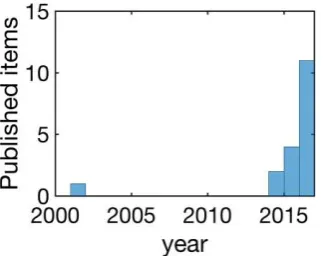
![Figure 2: Multi-scale analysis of reference zircon GJ-1/87, confirming absence of structural secondary electron images of sample 4R-I, EBSD and X-ray Energy Dispersive Spectrometry [47] analysis; disturbances and macro-to-nano homogeneity](https://thumb-us.123doks.com/thumbv2/123dok_us/1959719.156593/7.595.71.527.443.631/reference-confirming-structural-secondary-dispersive-spectrometry-disturbances-homogeneity.webp)