This content has been downloaded from IOPscience. Please scroll down to see the full text.
Download details:
IP Address: 143.167.30.96
This content was downloaded on 20/07/2017 at 16:25 Please note that terms and conditions apply.
Performance of the ATLAS Transition Radiation Tracker in Run 1 of the LHC: tracker
properties
View the table of contents for this issue, or go to the journal homepage for more 2017 JINST 12 P05002
(http://iopscience.iop.org/1748-0221/12/05/P05002)
Home Search Collections Journals About Contact us My IOPscience
You may also be interested in:
A neural network clustering algorithm for the ATLAS silicon pixel detector The ATLAS collaboration
Triggers for displaced decays of long-lived neutral particles in the ATLAS detector
A study of the material in the ATLAS inner detector using secondary hadronic interactions The ATLAS collaboration
Tracking properties of the ATLAS Transition Radiation Tracker (TRT) D V Krasnopevtsev
Performance of the ATLAS Transition Radiation Tracker read-out with cosmic rays and first high energy collisions at the LHC
D Olivito
Operation and performance of the ATLAS semiconductor tracker The ATLAS collaboration
2017 JINST 12 P05002
Published by IOP Publishing for Sissa Medialab
Received:February 22, 2017
Accepted:April 21, 2017
Published:May 3, 2017
Performance of the ATLAS Transition Radiation Tracker in
Run 1 of the LHC: tracker properties
The ATLAS collaboration
E-mail: atlas.publications@cern.ch
Abstract: The tracking performance parameters of the ATLAS Transition Radiation Tracker (TRT) as part of the ATLAS inner detector are described in this paper for different data-taking conditions in proton-proton, proton-lead and lead-lead collisions at the Large Hadron Collider (LHC). The performance is studied using data collected during the first period of LHC operation (Run 1) and is compared with Monte Carlo simulations. The performance of the TRT, operating with two different gas mixtures (xenon-based and argon-based) and its dependence on the TRT occupancy is presented. These studies show that the tracking performance of the TRT is similar for the two gas mixtures and that a significant contribution to the particle momentum resolution is made by the TRT up to high particle densities.
Keywords: Particle tracking detectors (Gaseous detectors); Transition radiation detectors
2017 JINST 12 P05002
Contents1 Introduction 1
2 Simulation 4
3 The Transition Radiation Tracker 5
3.1 General description 5
3.2 The TRT readout electronics 6
4 Calibration of the drift-time measurement 7
5 Alignment 10
6 Performance at low occupancy 12
6.1 Basic tracking properties with a xenon-based gas mixture 12
6.2 Basic tracking properties with an argon-based gas mixture 14
7 Tracking properties at high occupancy 18
8 Performance in dense track environments 21
9 Conclusion 24
The ATLAS collaboration 27
1 Introduction
The ATLAS detector [1] at the Large Hadron Collider (LHC) is a general-purpose detector designed to make precision measurements of known physics processes and to search for new physics at the energy frontier of the LHC. At the centre of the detector is an optimised, multi-technology tracking detector immersed in a 2 T axial magnetic field produced by a solenoid. This central tracking detector, also called the inner detector (ID) [2], is designed to provide a high-precision reconstruction of charged-particle trajectories (“tracks”). The ID was successfully commissioned in 2008 [3], and since 2009 was operated with efficiency greater than 97% during the first period of the LHC operation (Run 1 in 2009–2013).
The ID covers the pseudorapidity range |η| <2.5 and has full coverage inφ1(see figure1). It consists of a silicon pixel detector at the innermost radii (pixel), surrounded by a silicon microstrip
2017 JINST 12 P05002
Figure 1. The inner detector of the ATLAS experiment (during the first LHC data-taking period in 2009– 2013) is viewed in ther–zplane, whereris the radial distance from the z-axis. The detector is symmetric with respect to the plane perpendicular to the beam line and passing through the collision point (0,0). Only the positivezside is shown.
detector (SCT), and a straw-tube detector called the Transition Radiation Tracker (TRT) that com-bines continuous tracking capabilities with particle identification based on transition radiation (TR). Each detector consists of a barrel and two end-caps (see figure2), where the positive (negative)z
side is named “A” (“C”).
The precise measurement of the particle trajectories is fundamental for most of the data analyses in ATLAS. The positions of signals in individual detector elements (“hits”) are used to reconstruct tracks inside the tracker. The track reconstruction algorithms employ local and global pattern recog-nition to identify a coherent pattern of hits corresponding to a track produced by a charged particle. An iterative track-fitting procedure is used to estimate the compatibility of the detector measure-ments with the track hypothesis and to compute the final track parameters [4]. These measurements correspond to the combination of neighbouring hits called “clusters” in the pixel and SCT detectors and to the distance of closest approach of the charged-particle track to each straw in the TRT.
Figure 3shows an event display illustrating reconstructed tracks in the ID with pT > 2 GeV and|η| < 1.4. A track from a particle traversing the ID volume with|η| <2 would typically have 3 pixel clusters, 8 SCT strip clusters, and more than 30 TRT straw hits.
Another important feature of the ATLAS ID is the particle identification capability implemented in the TRT. The particle identification is based on TR, which arises when ultra-relativistic charged particles cross a boundary between media with different dielectric constants [5]. The probability of a given particle to emit transition radiation is determined solely by its Lorentzγ-factor. In the X-ray energy range of the TR photons, this probability is a step-like function which rises from about zero to
its maximum when theγ-factor changes from about 500 to 2000. The TRT was built to exploit this
effect, in particular to distinguish between electrons and pions up to momentum values of∼100 GeV. During Run 1 the TRT operated with an efficiency greater than 97%, contributing significantly to the particle momentum measurement, pattern recognition accuracy and particle identification.
2017 JINST 12 P05002
Figure 2. A schematic view of the ATLAS ID barrel (left) and left end-cap side (right). Particle tracks crossing the ID are shown by red lines.
Figure 3. An event display containing a close-up view perpendicular to the beam direction of hits and reconstructed tracks in the ID withpT>2 GeV and|η|<1.4. Only the hits in the pixel, SCT and TRT layers
within−1< η <0 are shown. Here pixel hits (45.5<r<242 mm) are shown as magenta dots, and SCT space points (255 < r < 549 mm) are shown in green. TRT hits (554<r <1082 mm) above tracking threshold are shown as blue dots, with red dots corresponding to hits above the TR threshold. A photon conversion vertex (large brown dot in the second pixel layer) as well as the associated reconstructed electron (blue line) and positron (red line) tracks are also shown.
straw occupancies, are presented in this paper. The straw occupancy characterises the particle density in the TRT and is defined as the probability to have a straw signal above a given threshold value in the TRT read-out window of 75 ns, equivalent to three bunch crossings at the nominal 25
ns LHC bunch spacing. For proton-proton (pp) collisions, the occupancy depends on the average
number of interactions per bunch crossinghµi. Theppcollisions studied in this paper are collected
at √s = 8 TeV either with a 50 ns bunch interval in low straw-occupancy conditions or with
[image:5.595.170.428.285.495.2]2017 JINST 12 P05002
in the text “heavy ion” collisions) are collected at√s=2.76 TeV with a 200 ns bunch interval andproton-lead collisions are collected at√s =5.02 TeV with a 50 ns interval.
The simulations used to describe the data are reported in section2. A general description of the TRT, including a brief summary of the data acquisition system is given in section3. Position coordinates of hits in the TRT are measured using drift-time information. The straw coordinate accuracy depends strongly on the calibration of ther–trelation, whereris the track position radius in the straw andtis the measured drift time. Section4describes ther–tcalibration procedure. The track reconstruction accuracy substantially depends on precisely knowing the position of all TRT straw anode wires. A dedicated TRT alignment procedure was developed and the results of this procedure are presented in section5. Results from studies of the TRT tracking parameters at low straw-occupancy are presented in section6.1for straw tubes filled with a xenon-based (Xe-based) gas mixture, which was the baseline operation during Run 1. The TRT tracking parameters are the straw efficiency, the straw track position measurement accuracy, and the number of TRT precision hits. These parameters are defined later in the text.
During the 2012 data-taking period, several leaks developed in the gas pipes which bring the active gas to the cleaning and mixing stations. In most cases, the leaks are located in inaccessible areas and their repair is not possible. Because of the high cost of losing the Xe-based gas mixture, the possibility to operate the most affected modules with a significantly less expensive argon-based (Ar-based) gas mixture was investigated. In order to understand the TRT performance with such an Ar-based mixture, dedicated studies were performed during the proton-lead collisions in 2013 where leaking modules in the barrel and end-caps were supplied with the Ar-based mixture. The results of these studies are presented in section6.2. TRT modules with high leak rates have been routinely operated with the Ar-based gas mixture since the beginning of the second period of LHC operation, Run 2, which started in 2015.
At an LHC design luminosity of 1034cm−2s−1a TRT straws occupancy can reach 60%. Large detector occupancies present many challenges for track reconstruction, including a degradation of the track parameter resolution due to incorrect hit assignments, a decrease of hit efficiencies, and an increase in the rate of fake tracks due to random hit combinations. Studies of the TRT tracking capabilities in a high-density particle environment are reported in section7. For these studies, special LHC high-intensityppcollision fills withhµiup to 70 and heavy-ion collision runs were analysed. In section 8, tracking performance studies in jet cores at different TRT occupancies are pre-sented. Conclusions are presented in section9.
2 Simulation
Simulated events are produced with various Monte Carlo event generators, processed through a full ATLAS detector simulation [6] using Geant4 [7], and then reconstructed with the same procedure as for data.
2017 JINST 12 P05002
For the high-occupancy studies, a special pile-up-only sample with a uniformhµidistributionbetween 38 and 71 is used. The same conditions for bunch spacing as in data are simulated. The response of the ATLAS detector and the performance of the reconstruction algorithms for heavy-ion collisions are evaluated using simulated minimum-bias events produced with the version 1.38b of the HIJING event generator [10], and using the same bunch-spacing and pile-up conditions as in data.
Performance in a dense track environment is studied using simulatedppdijet events from the
Pythia 8.1 [11] generator with parameter values set to the AU2 CT10 tune [12].
3 The Transition Radiation Tracker
3.1 General description
The TRT is a straw tracker composed of 298,304 carbon-fibre-reinforced kapton straws, 4 mm in diameter, with 70 µmwalls and held at a potential of−1530 V with respect to a 31µmdiameter
gold-plated tungsten ground wire at the centre [13]. The TRT has two different geometrical
arrangements of straws. The barrel section, where 52,544 straws are aligned parallel to the direction
of the beam axis, covers the radial region 560 < r < 1080 mm and the longitudinal region
|z|< 712 mm [14]. Two end-cap sections, each with 122,880 straws that are aligned perpendicular to the beam axis and point outwards in the radial direction, cover the regions 644<r < 1004 mm and 827< |z| <2744 mm [15]. The TRT acceptance range is|η| <2.0.
The TRT barrel consists of 73 layers of straws organised in 3 cylindrical rings (green colour
in figure1), each containing 32 identical and independent modules. All the straws are embedded
in stacks of polyproplylene or polyethylene fibres which produce transition radiation X-rays used for electron identification. The distance between straws is on average 6.8 mm in both the radial and azimuthal directions, and the length of the straws is 142.4 cm. In order to reduce the straw occupancy, the anode wires are separated electrically by glass wire joints atz=0 so that each side is read out separately. The straws closest to the beam line have the largest occupancy. To further reduce occupancy, the wires in the innermost 9 of the 73 straw layers of the barrel are split into three parts, with only 34 cm of straw length being read out from each side, while the middle wire is not read out. These straws with shorter active region are referred to as short straws.
Both end-cap sections consist of two sets of identical and independent wheels, in turn organised in sub-wheels (brown colour in figure1). The first type of wheels (type A: 12 wheels per side at 827< |z| < 1684 mm) contains 12288 radial straws positioned in 8 consecutive layers spaced by 8 mm alongz. Each layer contains 768 straws inr–φand the 4 mm gap between successive layers is filled with radiator material made from thin polypropylene foils. The distance between straws in the
r–φdirection is varied from about 5.2 mm at the innermost radius to 8.4 mm at the outer radius. The second type of wheels (type B: 8 wheels per side at 1687< |z| <2744 mm) contains 6144 straws positioned exactly as in the type A wheels inr–φbut with a spacing of 16 mm in thez direction. The space of 12 mm between straw layers is filled with the same type of radiator material. The total number of layers in each of the two end-caps is 160 with a straw active length of about 36 cm.
2017 JINST 12 P05002
typical energies of 6–15 keV. Oxygen is used in this mixture in order to maximise the differencebetween the operating voltage and the breakdown voltage. During Run 2, straws belonging to modules with large gas leaks are filled with a gas mixture of 70% Ar, 27% CO2and 3% O2. Argon has a much lower efficiency to absorb the TR photons in this energy range, but has similar tracking capabilities as xenon, as it is shown in section6.2.
The TRT operates as a drift chamber: when a charged particle traverses a straw, it deposits about 2.5 keV of energy in the active gas, creating about 5–6 primary ionisation clusters per mm of path length. The electrons then drift towards the wire and cascade in the strong electric field very close to the wire with a coefficient of 2.5×10⁴(gas gain), producing a detectable signal. The signal on each wire is then amplified, shaped, and discriminated against two adjustable thresholds [16]: low level (LL) and high level (HL). The LL threshold is used to measure an electron drift time for the tracking and is usually set to about 250–300 eV in absolute scale for the Xe-based gas mixture. The HL threshold is used to identify large energy deposits. The separation of particle types is based on the probability of a particle’s signal in a straw to exceed the HL threshold, which is different for electrons which produce TR, and other particles with Lorentz factors below 1000 which do not produce TR. The HL threshold is optimised to obtain the best electron-pion separation and is set at about 6–7 keV for a Xe-based gas mixture. The settings for an Ar-based gas mixture is discussed in section6.2.
3.2 The TRT readout electronics
The TRT read-out electronics play a crucial role in the detector performance. A detailed description of the TRT electronics is presented in ref. [16]. Here, a basic description of the front-end electronics design relevant for the understanding of the TRT performance is given.
The TRT front-end read-out system consists of analogue and digital components. The TRT analogue read-out is based on a custom-designed analogue chip (ASDBLR) which performs am-plification, shaping, discrimination, and baseline restoration. The peaking time of the analogue signal from the point-like ionisation in the straw gas is about 7.5 ns, with a semi-Gaussian shape after ion tail cancellation. The signals after discrimination are sampled by a second digital chip, the drift-time measuring read-out chip (DTMROC), which performs the time measurement of the signals and provides a digitised result to the off-detector electronics.
The ASDBLR chip has two discrimination paths which allow the setting of both the LL and HL thresholds. For LL threshold signals, the DTMROC divides each 25 ns LHC bunch period into eight equal-time bins so that the LL discriminator output pulse is recorded in 3.125 ns bins and stored in a pipeline to that precision. For HL threshold signals the information is recorded in the DTMROC chip as a status bit for each of the three 25 ns intervals inside the TRT read-out window. In total 24 LL bits and 3 HL bits, representing the information over 3 bunch crossings in the nominal LHC running conditions (75 ns) are stored in the pipeline for each read-out channel. Each DTMROC provides timing, storage, and control for two ASDBLR chips. After the ATLAS Level-1 trigger (which receives and buffers the data from the read-out electronics) accepts an event, the DTMROC data is shipped to the back-end electronics for further processing and integration.
2017 JINST 12 P05002
corresponding to 0.2 femtoCoulomb (fC) of collected charge per primary electron with the TRTgas gain of 2.5×10⁴.
Since the goal is to detect the earliest clusters of electrons arriving at the wire, the LL threshold is set to a minimum value defined by a 2% noise occupancy in each channel, which is equivalent to a 300 kHz total noise rate for each channel. The resulting LL threshold is quite uniform across
the detector and corresponds to 250-300 eV in absolute scale (∼ 2 fC), which corresponds to the
energy of 3-4 primary ionization clusters.
The thresholds are kept constant over an entire operation period using regular electronics calibration procedures.
4 Calibration of the drift-time measurement
The spatial position of charged-particle tracks in the TRT detector is determined from the drift-time measurement. The TRT records the time at which the signal produced by ionisation electrons in the region of closest approach of the track to the wire first exceeds the LL threshold, referred to as the leading-edge time. It is measured as the time interval between the 40 MHz LHC clock tick, corresponding to a triggered bunch, and the leading edge of the discriminator signal within the TRT read-out window of 75 ns. An example of the leading-edge time distribution for the TRT end-caps straws, comparing data and simulation, is shown in figure4.2
The differences between the shapes of the leading-edge distributions observed in data and predicted in simulation are explained by coherent (in time) electronic noise associated with the 40 MHz clock, which is continuously supplied to the digital part of the TRT front-end electronics. The noise modulates the amplifier baseline (ground), changing the effective low-threshold discriminator setting in a way that is not modelled by the simulation. For signals coming at around 25 ns (see figure 4) the clock signal raises the baseline, effectively reducing the rise time to reach the low threshold. This results in an increase of the counting rate and a reduction of the measured drift time. This effect has an opposite direction for times around 38 ns, where the effective threshold is increased, reducing the counting rate and increasing the measured drift time.
The leading-edge time of the signal in the time window depends on various factors such as the signal propagation in the electronic circuits, the time of flight of the particle through the straw and the effect of different threshold settings. This leads to different shifts in the leading-edge time distributions for straws, which are compensated for by using a parameterT0, adjusted during the calibration procedure for each DTMROC chip. The corrected drift time is obtained by subtracting the value of this parameter to the measured leading-edge time for each chip. Once the drift time is known, it can be translated into a drift-circle radius, making use of the relation between drift time and drift distance, called ther–trelation. This relation is obtained from data using the measured drift time and the actual drift radius calculated as the distance of closest approach of the reconstructed track to the anode wire (the so-called “track-to-wire distance”). Figure 5 depicts a typical r–t
relation in the TRT barrel in 2012ppdata. Ther–trelation is determined by fitting ther–t data distribution with a third-order polynomial. The drift radius is subsequently used by the track fitter
2017 JINST 12 P05002
0 10 20 30 40 50 60 70
Arbitrary units
0 0.02 0.04 0.06 0.08 0.1 0.12 0.14
ATLAS
=8 TeV s
>=5-10 µ <
End-cap Data 2012
Simulation
Leading edge [ns]
0 10 20 30 40 50 60 70
Data
[image:10.595.206.385.87.267.2]Simulation 0.5 1 1.5
Figure 4. Distribution of the leading-edge time for hits on track in the TRT end-caps for 5 ≤ hµi ≤ 10. Data (closed circles) and simulation (histogram) are shown for the 2012 data-taking period operating with the Xe-based mixture. The bins in this histogram correspond to the TRT digitisation binning of 3.125 ns.
) [ns]
t
Drift time (
0 5 10 15 20 25 30 35 40 45 50
) [mm]r
Track-to-wire distance (
0 0.2 0.4 0.6 0.8 1 1.2 1.4 1.6 1.8 2
0 2000 4000 6000 8000 10000 12000 14000
ATLAS
< 25
〉 µ 〈
= 8 TeV, 20 < s
> 5 GeV, Xe T
Barrel, p
Figure 5. Ther–t relation for the TRT barrel operating with the Xe-based gas mixture during the 2012 data-taking period. The points show the peak position of the fit to the track-to-wire distance (r) distribution in 3.125 ns slices of measured drift time (t). The fitted line through these points is the relation used to determine the drift distance based on the measured drift time.
during the track-reconstruction procedure. In the calibration procedure, ther–trelation is fitted for each new data-taking session for the four TRT regions (barrel sides A and C, end-cap sides A and C).
[image:10.595.197.406.344.485.2]2017 JINST 12 P05002
Position residual [mm]
1
− −0.5 0 0.5 1
Arbitrary units
0 0.02 0.04 0.06 0.08 0.1
ATLAS
End-cap =8 TeV s
>=5-10
µ
<
m
µ
0.3
±
=109.1 Data σ
Data 2012
m
µ
1.1
±
=108.3 MC σ
[image:11.595.202.386.89.266.2]Simulation
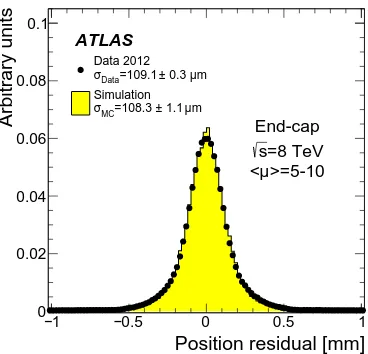
Figure 6. Position residual distribution in the TRT end-caps operating with Xe-based gas mixture for muons withpT>30 GeV. Data (solid circles) and simulation (histogram) are shown for a 2012 data-taking
period with 5 ≤ hµi ≤ 10. The straw track position measurement accuracy, obtained from an iterative fit procedure to the central 1.5σof the distribution as described in the text, is 109.1±0.3µm for the data and 108.3±1.1µm for the simulation.
the residual distributions becomes smaller than∼ 1% (which needs typically two steps). The new
T0andr–tvalues are used to perform the full reconstruction of the tracks.
An example of the position residual distribution in the end-cap region after the calibration
procedure is performed, is shown in figure 6, for 5 ≤ hµi ≤ 10. The straw track position
measurement accuracy is defined in an iterative procedure as the widthσf of a Gaussian function fitted to the peak of the residual distribution within the range±1.5σi, whereσiis obtained from the previous iteration. The fitting procedure is repeated until stable results are achieved. The straw track position measurement accuracy is about 110 µm in both the barrel and end-caps for 5 ≤ hµi ≤10. Good agreement between data and simulation is observed. These resolution values are below the typical 130µm resolution obtained in test-beam campaigns [14].
The uncertainty in the drift-radius measurement is also needed as an input for the track-fitting algorithm. This uncertainty is defined as the widthσof a Gaussian function fitted to the full range of the position residual distribution and thus is expected to be larger than the straw track position measurement accuracy. This uncertainty (referred to as the “drift-circle error”) depends on the shortest distance between the anode wire and the particle crossing the straw. It is calibrated for both the data and Monte Carlo samples as a function of the drift time. An accurate determination of this uncertainty is necessary for track reconstruction [4], as it plays a role in the decision whether or not to include a given drift-radius measurement in the track-fitting procedure. Once a measurement is added to the track fitting, the uncertainty is also used to determine the weight of its contribution to the track fit. TRT hits with a track-to-wire distance within 2.5 times the drift-circle error (referred to as “precision hits”) have the largest weight in the track fit.
2017 JINST 12 P05002
Drift time [ns]
0 5 10 15 20 25 30 35 40 45 50
m]
µ
Drift circle error [
60 80 100 120 140 160 180 200 220
240 ATLAS
2012, s = 8 TeV
Barrel
Data
Simulation
Drift time [ns]
0 5 10 15 20 25 30 35 40 45 50
m]
µ
Drift circle error [
60 80 100 120 140 160 180 200 220
240 ATLAS
2012, s = 8 TeV
End-cap
Data
[image:12.595.91.504.88.271.2]Simulation
Figure 7. Drift-circle error as a function of the drift time for the TRT barrel (left) and end-caps (right) operating with the Xe-based gas mixture for data (solid circles) and simulation (open circles).
are assigned the anode wire coordinate during the track-fitting procedure. This procedure reduces the time jitter effect related to different arrival times of ionisation clusters at the anode wire as well as the effect of the left-right ambiguity (the ambiguity of the hit position being on the left or right side of the TRT straw centre) for the track-reconstruction procedure. As a result the drift-circle error decreases for this low drift-time interval. For tracks crossing the straw at distances larger than 300 µm from the wire (corresponding to drift times larger than≈10 ns), the drift circles are accepted as track coordinates. This leads to an increase of the drift-circle error that rapidly drops with increasing drift radius, due to a reduction in the fluctuations of the first ionisation cluster arrival times (the clusters reach the wires at almost the same times, known as a “focusing” effect in wire chambers). The discrepancy between simulation and data is predominantly caused by differences in the tails of the residual distributions in data and simulation. Another effect contributing to the difference between simulation and data results from the approximations and models used to simulate the electrical behaviour of a straw tube as a transmission line. This effect is more pronounced for the barrel detector straws which are twice as long as the straws in the end-caps.
5 Alignment
2017 JINST 12 P05002
The alignment procedure calculates the TRT element positions at the level of 1µm precision,which is a much more precise than the typical TRT position resolution of 110µm. This makes the
calibration procedure, which is discussed in previous section, insensitive to any small misalignments. The determination of the position of the active elements of the TRT is performed within the ATLAS alignment framework using a track-based technique which minimises the position residuals. The alignment of each ID detector is performed at several levels of granularity. Each structure has six basic degrees of freedom, corresponding to three translations along, and three rotations about, the x-, y-, and z-axes, whose origin and orientation depends on the alignment level. First, large structures such as the full barrel or the end-caps are aligned as individual units to correct for collective movements of the active elements (Level-1 alignment). Then, single sensitive devices are aligned (Level-2 and Levl-3 alignments). At Level 1, the alignment reference frame coincides with
the ATLAS global coordinate frame (described in Footnote1) and the TRT detector has the same
granularity as the pixel and SCT detectors: one barrel component and two end-cap components. At Level 2, the alignment reference frame for the barrel modules has the y-axis parallel to the straw direction, thez-axis perpendicular to the module plane and thex-axis perpendicular to they -andz-axes, forming a right-handed Cartesian system. For the end-cap wheels it originates from the centre of each wheel with thez-axis pointing along the beam direction, thex-axis being horizontal and the y-axis pointing upwards. At this level, the TRT barrel modules are aligned usingx andy translations and rotations with respect to thex-,y-, andz-axes. The end-cap wheels are aligned using only three degrees of freedom: xandytranslations and a rotation with respect to thez-axis. At this level, 620 degrees of freedom are used for the 96 barrel modules and 80 (4-plane) end-cap wheels. Level 3 is the level where the position of each individual detector element is corrected relative to its neighbours. Single wires are aligned using a translation in the φ direction and a rotation around the radial direction (for the barrel) or an axis parallel to the beam direction and passing through the midpoint of the straw (for the end-caps). At this alignment level a total of 701,696 degrees of freedom are used.
As the ATLAS alignment procedure relies on the minimisation of the position residuals, the straw track position measurement accuracy is calculated using the distribution of the unbiased resid-uals. The unbiased residuals are the position residuals built for tracks reconstructed after removing all the hits from the detector element which is being aligned. In the absence of misalignment, these position residual distributions are centred at zero, with their width representing the uncertainty in the drift radius measurement. In order to converge on the best alignment for such a complex system, many iterations of the alignment procedure are performed.
The alignment performance is checked using muon tracks fromZboson decays in both data and
simulation. The events are selected by requiring two muon tracks withpT >25 GeV and|η| <2.5. In addition, the muon tracks are required to have at least one pixel hit and five SCT hits, and at
most two pixel or SCT missing hits where they are to be expected. Figure8shows examples of the
mean position residual distributions for the TRT barrel layer 0 and end-cap A. In the simulation a perfect alignment of the detectors is assumed. The small structures seen in the simulation position residuals are due to systematic mismodelling of the single detector elements’ response and variation in the data-driven conditions that can affect the track-to-hit residuals. Similar levels of agreement are observed for the other parts of the TRT.
2017 JINST 12 P05002
-indexφ
Module
0 5 10 15 20 25 30
m]
µ
Residual Mean [
10 − 5 − 0 5 10 ATLAS
TRT Barrel layer 0 >25 GeV T Track p Simulation =8 TeV s Data 2012 End-cap Ring
0 5 10 15 20 25 30 35 40
m]
µ
Residual Mean [
5 − 4 − 3 − 2 − 1 − 0 1 2 3 4 5 ATLAS TRT End-cap A
[image:14.595.86.498.88.223.2]>25 GeV T Track p Simulation =8 TeV s Data 2012
Figure 8. Mean of the unbiased residual distributions as a function of the φsector for TRT barrel layer 0 (left) and TRT end-cap A (right), operating with Xe-based gas mixture. The residuals are from aZ→ µ+µ−
data sample reconstructed with the 2012 alignment constants (open circles) and are compared to the Monte Carlo simulation (full circles).
6 Performance at low occupancy
There are two basic straw performance parameters that define the TRT tracking properties: the straw efficiency and the straw track position measurement accuracy. The straw efficiency is defined as the probability for the straw to produce a signal above the LL threshold for a particle traversing the straw gas volume. This efficiency depends on the track-to-wire distance, and is on average about 96% for a typical straw channel. The straw track position measurement accuracy was defined in section4and is typically of the order of∼110µm. The individual straw performance is defined by the physics processes occurring inside the straw and by the signal processing in the TRT front-end electronics (described in section3).
As the TRT straw drift-time parameters are measured for reconstructed tracks, their values depend on the track reconstruction quality, which itself is a function of the straw occupancy. To disentangle the effect of the occupancy, baseline TRT performance studies are first performed at relatively low straw occupancy and compared with Monte Carlo simulations. Low-occupancy events in data correspond to events with an average straw occupancy lower than 20%. The results of the studies at low occupancy are presented in the following two subsections for Xe-based and Ar-based gas mixtures.
6.1 Basic tracking properties with a xenon-based gas mixture
The performance of the TRT filled with a Xe-based gas mixture is studied using pp collisions
data taken in 2012 with a 50 ns LHC bunch spacing. The average number of interactions per
bunch crossing was in the range 5 ≤ hµi ≤ 30, corresponding to straw occupancies of less
than 20%. To minimise the effects of the interaction of particles with the detector material on tracking performance, and to simplify the particle identification, the studies were carried out with
muons from Z boson decays. Events were selected in data and simulation by requiring two
opposite-charge muon candidates with pT > 30 GeV and an angular separation between them
2017 JINST 12 P05002
Straw efficiency
0.5 0.6 0.7 0.8 0.9
1 ATLAS
>=25-30
µ
=8 TeV, < s Barrel
Data 2012 Simulation
Track-to-wire distance [mm] 2
− −1.5 −1 −0.5 0 0.5 1 1.5 2
Data
Simulation 0.8 1 1.2
Straw efficiency
0.5 0.6 0.7 0.8 0.9
1 ATLAS
>=25-30
µ
=8 TeV, < s End-cap
Data 2012 Simulation
Track-to-wire distance [mm] 2
− −1.5 −1 −0.5 0 0.5 1 1.5 2
Data
[image:15.595.89.504.86.271.2]Simulation 0.8 1 1.2
Figure 9. Straw efficiency in the TRT barrel (left) and end-caps (right) as a function of the track-to-wire-distance for muons withpT >30 GeV fromZ → µ+µ−events. Data (solid circles) and simulation (open
circles) are shown for 25 ≤ hµi ≤ 30 during the 2012 running period operating with the Xe-based gas mixture at√s=8 TeV.
within 75 < mµ+µ− < 105 GeV. In addition, muon tracks were required to fall within the TRT pseudorapidity acceptance of|η| <2.0 and to have more than 15 TRT hits.
A comparison of the straw efficiency fromZ →µ+µ−data and simulation is shown in figure9
as a function of the track-to-wire distance for the barrel and end-caps. One can see a plateau at about 96% in straw efficiency for absolute values of track-to-wire distance below 1.5 mm, and a significant decrease in the region where the track passes close to the edge of the straw, due to the shorter track length in the straw. As mentioned earlier, the TRT LL threshold is set according to the TRT noise occupancy requirements and its absolute value in terms of energy scale is not a priori exactly known. Consequently, the LL threshold setting in the simulation was tuned to obtain agreement with the data for the plateau region of the straw efficiency distributions, separately for the barrel and end-caps. Agreement is best when the effective LL threshold is set to about 280 eV for the TRT barrel and to about 250 eV for the end-caps.
Figure 10 shows the maximum straw efficiency as a function of the trackη. In this figure,
the maximum straw efficiency is extracted from a constant fit to the plateau of the straw efficiency
vs track-to-wire distance for each bin ofη. The maximum straw efficiency is found to be 96% on
average. The few percent variations around this value are related to the variation of the particle incident angle relative to the straw and to the change of the signal amplitude along the wire. The straw efficiency is smaller for particle crossing the straws close to the barrel edge (in the barrel to end-cap transition region) because the number of straws crossed by particles in this region is smaller and because this is where the services for the SCT and TRT stands, along with the TRT barrel electronics. This leads to some reduction of the track reconstruction accuracy and hence decrease of the straws efficiency.
[image:15.595.317.502.89.267.2]2017 JINST 12 P05002
η2
− −1.5 −1 −0.5 0 0.5 1 1.5 2
Maximum straw efficiency
0.7 0.75 0.8 0.85 0.9 0.95 1 1.05
ATLAS
Data 2012 Simulation
>=25-30
µ
=8 TeV, < s
η
2
− −1.5 −1 −0.5 0 0.5 1 1.5 2
Data
[image:16.595.205.387.87.263.2]Simulation 0.96 1 1.04
Figure 10. Maximum straw efficiency as a function ofηfor muons withpT>30 GeV fromZ → µ+µ−
events. Data (solid circles) and simulation (open circles) are shown for 25 ≤ hµi ≤ 30 during the 2012 running period operating with the Xe-based gas mixture at√s=8 TeV.
TRT, while for the barrel the simulation predicts a smaller position accuracy than observed in the data (up to about 10µm). As described in section4for figure7, this different degree of agreement between data and simulation in the barrel and the end-cap regions results from approximations and models used to simulate the electrical behavior of a straw tube as a transmission line. For the barrel detector, straws are twice as long as the straws in the end-caps. As already observed for the straw efficiency, there is a variation of the straw track position measurement accuracy around the central value of∼110µm for the same reasons as mentioned earlier. In particular, the change of the signal amplitude along the wire has a significant effect for the long straws in the barrel.
Although low-occupancy LHC fills were chosen for these studies (5 ≤ hµi ≤ 30) there is still
some dependence of the straw track position measurement accuracy on occupancy. Figure12shows
the averaged straw track position measurement accuracy as a function of hµi for the TRT barrel
and end-caps, comparing data with simulation. As seen in figure11, the simulation underestimates the straw track position measurement accuracy in the barrel straws by about 6µm on average, but the general trend as a function of hµi is well reproduced. For the end-caps the simulation is in agreement with data. In the data, the average straw track position measurement accuracy over the entire TRT is in the range 105µm–115 µm.
6.2 Basic tracking properties with an argon-based gas mixture
2017 JINST 12 P05002
η
2
− −1.5 −1 −0.5 0 0.5 1 1.5 2
m]
µ
Position accuracy [
60 80 100 120
140 ATLAS
Data 2012 Simulation >=5-10
µ
[image:17.595.205.387.88.265.2]< =8 TeV s
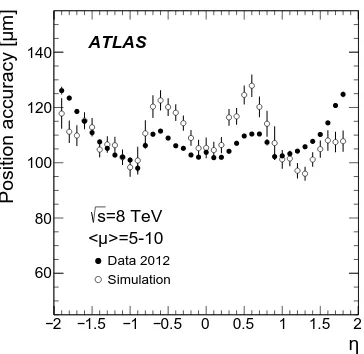
Figure 11. Straw track position measurement accuracy as a function ofηfor muons withpT>30 GeV from
Z → µ+µ−
events. Data (solid circles) and simulation (open circles) are shown for the 2012 running period operating with Xe-based gas mixture with 5≤ hµi ≤10.
> µ <
5 10 15 20 25 30 35
m]
µ
Position accuracy [
80 90 100 110 120
130 ATLAS
Data 2012 Simulation =8 TeV s Barrel
> µ <
5 10 15 20 25 30 35
m]
µ
Position accuracy [
80 90 100 110 120
130 ATLAS
Data 2012 Simulation =8 TeV s End-cap
Figure 12. Straw track position measurement accuracy for muons withpT>30 GeV fromZ → µ+µ−events
in the TRT barrel (left) and end-caps (right) as a function ofhµi. Data (solid circles) and simulation (open circles) are shown for the 2012 running period operating with a Xe-based gas mixture and for 5≤ hµi ≤30.
[image:17.595.91.505.338.516.2]2017 JINST 12 P05002
Track to wire distance (mm)2
− −1.5 −1 −0.5 0 0.5 1 1.5 2
Straw efficiency
0.4 0.5 0.6 0.7 0.8 0.9 1 1.1
Data 2013 Simulation
=5.02 TeV, End-cap s
p-Pb, Argon mixture ATLAS
Track to wire distance (mm) 2
− −1.5 −1 −0.5 0 0.5 1 1.5 2
Data
[image:18.595.202.387.88.273.2]Simulation 0.950.9 1 1.051.1
Figure 13. Straw efficiency in the end-cap wheels filled with an Ar-based mixture versus track-to-wire distance in the data (solid circles) and simulation (open circles).
Position residual (mm) 1
− −0.5 0 0.5 1
Arbitrary units
0 0.02 0.04 0.06 0.08 0.1
ATLAS
Argon mixture
p-Pb, End-cap
=5.02 TeV s
m
µ
0.7
±
=124.1 Data σ
Data 2013
m
µ
0.0
±
=104.0 MC σ
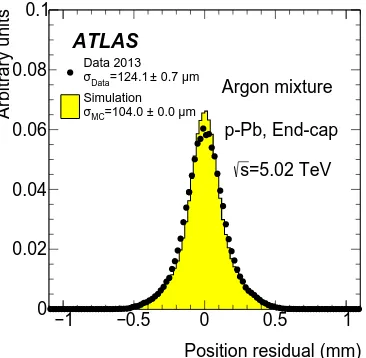
[image:18.595.206.389.330.509.2]Simulation
Figure 14. Position residual distribution for the Ar-based end-cap straws for data and simulation using the 100 eV threshold setting.
Figure 13 shows the straw efficiency for an Ar-based mixture in the end-cap wheels as a
function of the track-to-wire distance. This figure shows the same behaviour as seen previously for the Xe-based gas mixture (see section6.1), with a plateau close to 100% efficiency and agreement between simulation and data. The higher plateau found here reflects the fact that for argon, the effective threshold is about a factor of three lower than that for xenon, thus increasing the sensitivity of the read-out electronics to low ionisation-energy clusters.
2017 JINST 12 P05002
Low threshold (eV) 40 50 60 70 80 90 100 110 120
Maximum straw efficiency
0.75 0.8 0.85 0.9 0.95 1 1.05 ATLAS
=5.02 TeV, Barrel s
p-Pb,
Argon mixture Data 2013 Simulation
Low threshold (eV) 40 50 60 70 80 90 100 110 120
Maximum straw efficiency
0.75 0.8 0.85 0.9 0.95 1 1.05 ATLAS
=5.02 TeV, end-cap s
p-Pb,
[image:19.595.96.502.87.273.2]Argon mixture Data 2013 Simulation
Figure 15. Maximum straw efficiency as a function of the threshold setting for the barrel modules (left) and end-cap wheels (right) filled with an Ar-based gas mixture, for data (solid circles) and simulation (open circles).
Low threshold (eV) 40 50 60 70 80 90 100 110 120
m)
µ
Position accuracy (
0 20 40 60 80 100 120 140 ATLAS
=5.02 TeV, Barrel s
p-Pb,
Argon mixture Data 2013 Simulation
Low threshold (eV) 40 50 60 70 80 90 100 110 120
m)
µ
Position accuracy (
0 20 40 60 80 100 120 140 ATLAS
=5.02 TeV, end-cap s
p-Pb, Argon mixture
[image:19.595.96.504.352.538.2]Data 2013 Simulation
Figure 16. Straw track position measurement accuracy as a function of the threshold setting for the barrel modules (left) and end-cap wheels (right) filled with an Ar-based gas mixture, for the data (solid circles) and simulation (open circles).
2017 JINST 12 P05002
TRT occupancy
0.2 0.25 0.3 0.35 0.4 0.45 0.5
ATLAS
= 8 TeV s
No out-of-time pile-up
> MinBias
µ
Data: High-<
> MinBias
µ
Simulation: High-<
>
µ
<
35 40 45 50 55 60 65 70 75
Data
[image:20.595.205.387.86.264.2]Simulation 0.9 1 1.1
Figure 17. TRT straw occupancy as a function ofhµiin the TRT from special high-hµiLHC fill (no pile-up from adjacent bunches) during a ppdata-taking period in 2012 operating with Xe-based gas mixture at
√
s=8 TeV, for data (solid circles) and simulation (filled histograms).
7 Tracking properties at high occupancy
During the Run 1 data-taking period, the standard bunch spacing was set to 50 ns whereas the nominal LHC running condition was designed with 25 ns intervals between collisions. With the
50 ns spacing, the occupancy in ppcollisions reached in the TRT was at the level of∼25%, and
approached the 90% level in heavy ion collisions. During the Run-2 period, started in 2015, the LHC operates with the design 25 ns bunch spacing and provides higher instantaneous luminosity. In these conditions the TRT straw occupancy significantly increases not only due to the increased luminosity but also due to the contribution from additional collisions in neighbouring bunches (out-of-time pile-up), which become more probable with the reduced bunch spacing.
The TRT is designed to operate in a high occupancy environment thanks to the large number of measurements (30) provided by the TRT along reconstructed tracks. Even at very high occupancy there are always some precision hits which significantly contribute to the track-finding algorithm and to the particle momentum reconstruction accuracy. High-occupancy conditions are studied to understand the effect of large charged-particle densities on the TRT performance. The studies were carried out using a special high-hµiLHC fill during appdata-taking period in 2012, and using data from heavy ion collisions taken in 2011.
Figure 17 shows the correlation between the TRT occupancy andhµi for the high-hµi LHC
fill. The simulation well describes the linear dependence of the TRT occupancy on the pile-up. The average TRT occupancy forhµi=70 is about 35% in theseppcollisions and can even reach a level of 50% in some events due to the large fluctuation of the number of primary collisions.
The centrality of nuclei collisions is generally used to characterise events in heavy ion runs. This parameter cannot be directly translated to the parameters used forppcollisions, so the TRT occupancy is used as a reference to compare the results. In these collisions, TRT occupancies up to 90% were obtained.
2017 JINST 12 P05002
Total TRT occupancy
0 0.1 0.2 0.3 0.4 0.5 0.6
TRT track extension fraction
0.6 0.7 0.8 0.9 1 1.1 1.2 1.3
ATLAS
= 8 TeV s
< 100 GeV
T track p
0.5 GeV <
> 2012 data
µ
High-<
> simulation
µ
High-<
No out-of-time pile-up
Total TRT occupancy
0 0.1 0.2 0.3 0.4 0.5 0.6
TRT precision hit fraction
0 0.2 0.4 0.6 0.8 1 1.2 1.4
ATLAS
= 8 TeV s
< 100 GeV
T track p
0.5 GeV <
> 2012 data
µ
High-<
> simulation
µ
High-<
[image:21.595.91.501.87.275.2] [image:21.595.306.504.89.273.2]No out-of-time pile-up
Figure 18. The TRT track extension fraction (left), and the precision hit fraction (right), as a function of the total TRT occupancy from minimum-bias events with 40 ≤ hµi ≤ 70 for ppdata (solid circles) and simulation (open circles) collected during the 2012 period operating with a Xe-based gas mixture.
fill studied here was made of a single proton bunch in each direction colliding approximately every 25000 ns, resulting in no out-of-time pile-up. Results are thus expected to show an optimistic view of TRT performance in high-occupancy conditions compared to the ones with larger out-of-time pile-up during LHC data-taking operation with a 25 ns bunch spacing. However they are still useful for understanding the performances in high in-time pile-up conditions.
In this section, two TRT tracking parameters (TRT track extension fraction and precision hit fraction) are studied using particle tracks with pT in the 0.5–100 GeV range. The precision hit fraction is defined as the number of precision TRT hits (defined in section4) divided by the total number of hits on the selected track. In the standard ATLAS track-finding algorithm, tracks are first found in the silicon trackers (pixel and SCT) and then TRT hits are added to extend the number of measurements on the reconstructed track. If for some reason (for instance because of hard interactions of particles with the detector material) TRT hits are not found by the algorithm, then the track parameters are calculated using only the information from silicon detectors. The TRT track extension fraction is the fraction of tracks reconstructed in the pixel and SCT detectors with their corresponding efficiencies [20], which also have a continuation (extension) in the TRT. In these studies, at least 18 TRT hits are required to be on such tracks. The TRT track extension fraction reflects how efficiently the information from the TRT is used in the standard ATLAS track-finding algorithm. For an extension to be accepted, several criteria have to be fulfilled, related to the minimum number of TRT hits, the fraction of precision hits on this extension, or the overall goodness of the fit after inclusion of the TRT segment.
Figure 18 shows a comparison of data and simulation for pp collisions for both the track
2017 JINST 12 P05002
0 0.1 0.2 0.3 0.4 0.5 0.6 0.7 0.8 0.9 10.5 0.6 0.7 0.8 0.9 1 TRT occupancy 0 0.1 0.2 0.3 0.4 0.5 0.6 0.7 0.8 0.9 1 0.850.9
0.951 1.051.1 1.15
Extension fraction
< 100 GeV T
500 MeV < Ptrack s = 8 TeV pp
s = 2.76 TeV HI
High-<µ> pp Heavy ion
ATLAS
No out-of-time pile-up
HI
pp
0 0.1 0.2 0.3 0.4 0.5 0.6 0.7 0.8 0.9 1
Precision hit fraction
0.5 0.6 0.7 0.8 0.9 1 ATLAS TRT occupancy
0 0.1 0.2 0.3 0.4 0.5 0.6 0.7 0.8 0.9 1 0.850.9 0.951 1.051.1 1.15 HI pp High-<µ> pp Heavy ion
s = 2.76 TeV HI 500 MeV < PTtrack < 100 GeV
s = 8 TeV pp
No out-of-time pile-up
TRT occupancy 0 0.1 0.2 0.3 0.4 0.5 0.6 0.7 0.8 0.9 1
Transverse momentum resolution
[%] 1 1.5 2 2.5 3 ATLAS Simulation = 2.76 TeV NN s
[image:22.595.98.499.83.379.2]Pb+Pb 2.0<pT<2.5 GeV |η|<2.0 ID without TRT ID with TRT No out-of-time pile-up
Figure 19. The TRT track extension fraction (top left), and the precision hit fraction (top right), as a function of the total TRT occupancy from minimum-bias events with 40≤ hµi ≤70 forppand heavy-ion collision events during the 2011–2012 operation with a Xe-based gas mixture. The pT resolution of ID
tracks as a function of the TRT occupancy (bottom) with (triangle marker) and without (circle marker) TRT measurements for heavy-ion simulations with a Xe-based gas mixture. Tracks with TRT measurements correspond to 70% of the tracks in the ID in such high-occupancy conditions as shown in the top left panel.
required minimum number of TRT hits on the extension. With increasing occupancy, additional hits are collected in the TRT track which are not from the particle of interest (background hits) but this causes the requirement to be fulfilled more frequently. This is why a small rise (2%) of the TRT extension fraction is observed in this figure.
2017 JINST 12 P05002
Figure19shows the track extension fraction and precision hit fraction as a function of the TRToccupancy for proton-proton and heavy-ion collisions. The required fraction of precision hits on the extension is 30% in heavy-ion collisions while it is 50% inppcollisions. Good agreement between the two running conditions is seen in the overlapping range of occupancies for both the extension fraction and precision hit fraction distributions.
The TRT contribution to the particle momentum reconstruction accuracy is studied in heavy-ion simulatheavy-ions. The true particle momentum,ptrueT , is compared with the reconstructed momentum,
precoT , for the particle momentum range of 2< pT< 2.5 GeV. This lowpT range is chosen because this is where the occupancy effects are expected to be the most pronounced in this particular simula-tion sample. ThepTresolution is defined as the widthσof a Gaussian function fitted to the core part (within±1.5σ) of the distribution ofRq/pTin eq. (7.1) and is shown in the bottom panel of figure19.
Rq/pT =
q precoT −
q ptrueT
/ q
ptrueT (7.1)
The case where ID tracks are reconstructed without including TRT measurements is compared to the case where the tracks are required to have at least 20 TRT hits of which at least 30% are precision hits. Including the TRT hits in the particle momentum measurement improves the momentum resolution by about 25%. The contribution of the TRT is found to be almost constant for occupancies up to 50%. For occupancies larger than 60%, there is some reduction of the TRT contribution to the track measurement accuracy, but even at 90% occupancy the TRT improves the ID momentum resolution by about 10% for tracks with extensions in the TRT, which applies to about 70% of the tracks in such high-occupancy conditions in heavy-ion collisions.
8 Performance in dense track environments
One of the most challenging tasks for a tracking detector is finding and reconstructing tracks in regions with high track density, as in energetic jet cores where tracks can be very close to each other. The high pile-up LHC conditions during Run 1 and Run 2 lead to high TRT hit occupancies, making this task particularly difficult, when the distance between tracks in the jet cores becomes comparable to the straw diameter. Studies of the tracking inside jets is presented in this section, using minimum bias events produced during high-hµippLHC fills in 2012. Events with at least one high-energy jet (30 < pT < 400 GeV), and with at least one primary vertex with two associated tracks are selected. Each track is required to satisfy a number of selection criteria: |η| has to be less than 2.0 (excluding 0.625< |η| < 1.07 corresponding to the TRT barrel to end-cap transition regions), its transverse momentum has to be larger than 2 GeV and it needs to have hits in all active pixel layers and at least five hits in the SCT. For the track extension in the TRT, more than 18 TRT hits on the track are required.
Jets are reconstructed from topological calorimeter clusters [21] using the anti-ktalgorithm [22]
with a radius parameter of R = 0.4 and their energies are corrected for the non-compensating
response of the calorimeter and the effects of inactive material using energy- and η-dependent
2017 JINST 12 P05002
R(trk,jet)
∆
0 0.05 0.1 0.15 0.2 0.25 0.3 0.35 0.4
TRT track extension fraction
0.6 0.7 0.8 0.9 1 1.1 ATLAS
= 8 TeV s
> Data 2012
µ
High-<
No out-of-time pile-up
< 80 GeV
jet T p
30 <
< 160 GeV
jet T p
110 <
< 400 GeV
jet T p 200 < R(trk,jet) ∆
0 0.05 0.1 0.15 0.2 0.25 0.3 0.35 0.4
TRT track extension fraction
0.6 0.7 0.8 0.9 1 1.1 ATLAS
= 8 TeV s
> Data 2012
µ
High-<
< 160 GeV jet T
p 110 <
No out-of-time pile-up
[image:24.595.97.504.87.258.2] [image:24.595.90.263.88.255.2]Low occupancy High occupancy
Figure 20. TRT track extension fraction as a function of∆Rin jet cores for three jetpTranges in data (left).
TRT track extension fraction as a function of∆Rin jet cores ( 110<pjetT <160 GeV) for low (less than 24%) and high-occupancy (34% to 54%) conditions in data (right). Data events were collected during the 2012 period operating with a Xe-based gas mixture.
R(trk,jet)
∆
0 0.05 0.1 0.15 0.2 0.25 0.3 0.35 0.4
Mean number of TRT hits
30 35 40 45 50 55 60 ATLAS = 8 TeV s
> Data 2012
µ
High-<
No out-of-time pile-up
< 80 GeV
jet T p
30 <
< 160 GeV
jet T p
110 <
< 400 GeV
jet T p
200 <
Figure 21. Total averaged number of TRT hits on tracks found in a given bin of∆R= 0.02 as a function of∆Rin jet cores for three jetpTranges for data events collected during the 2012 period operating with a
Xe-based gas mixture.
algorithm. If the distance inη–φspace between the track and the jet,∆R(trk, jet)= p∆η2+∆φ2, is less than the radius parameter used in the jet reconstruction (R=0.4), the tracks are assigned to the jet.
The jet core becomes denser with increasing momentum, making the track finding more challenging. In order to study this effect, data are studied as a function of∆R(trk, jet) and for three jetpTregions: 30 < pT < 80 GeV, 110 < pT < 160 GeV and 200 < pT < 400 GeV.
Figure 20 shows the TRT track extension fraction as a function of∆Rin jet cores, averaged
[image:24.595.212.380.343.509.2]2017 JINST 12 P05002
R(trk,jet)
∆
0 0.05 0.1 0.15 0.2 0.25 0.3 0.35 0.4
TRT precision hit fraction
0.5 0.6 0.7 0.8 0.9 1 ATLAS = 8 TeV s
> Data 2012
µ
High-<
No out-of-time pile-up
< 80 GeV
jet T p
30 <
< 160 GeV
jet T p
110 <
< 400 GeV
jet T p
[image:25.595.211.383.88.257.2]200 <
Figure 22. TRT precision hit fraction on reconstructed tracks as a function of∆Rin jet cores for three jetpT
ranges and for data events collected during the 2012 period operating with a Xe-based gas mixture.
R(trk,jet)
∆
0 0.05 0.1 0.15 0.2 0.25 0.3 0.35 0.4 0 50 100 150 200 250 Data 2012 Simulation Position accuracy
[µm
]
[image:25.595.109.503.315.476.2] [image:25.595.87.247.316.472.2]High-<µ> Data 2012 No out-of-time pile-up ptrk> 6 GeV, 150 < pjet< 400 GeV
Barrel, |η|< 0.625 s = 8 TeV
T T
ATLAS
R(trk,jet)
∆
0 0.05 0.1 0.15 0.2 0.25 0.3 0.35 0.4 0 50 100 150 200 250
T T
ptrk> 6 GeV, 150 < pjet< 400 GeV
s = 8 TeV
Data 2012 Simulation High-<µ> Data 2012 No out-of-time pile-up
Position
accuracy
[µm
]
End-caps, 1.07 < |η|< 2.0
ATLAS
Figure 23. The straw track position measurement accuracy as a function of∆Rfor tracks withpT >6 GeV
for the barrel (left) and end-caps (right), for simulation (histograms) and data (points) events collected during the 2012 period operating with a Xe-based gas mixture. See the text for details of the discrepancies between data and simulation.
low (less than 24%) and high TRT occupancy ranges (between 34% and 54%). It is observed that higher TRT occupancies do not affect the track extension fraction in jet cores.
2017 JINST 12 P05002
Figure22shows the TRT precision hit fraction as a function of∆Rin jet cores averaged overthe entirehµirange for data events. Even in the core of the most energetic jets in this sample, where the average number of tracks is large, the precision hit fraction is similar to the one outside of the jet core. This implies that the reconstruction algorithm is able to find the correct hits and properly reconstruct the tracks even when tracks are close to each other.
In order to study the straw track position measurement accuracy in dense environments, jets with 150< pT < 400 GeV in the high-hµi run were selected and tracks were required to have
pT >6 GeV.
The results for different∆Rbins are shown in figure23for the TRT end-caps and barrel. The plot shows that the straw track position measurement accuracy for high-pTtracks is approximately constant even within the dense cores of the most energetic jets in this sample. Similarly to figure11, the simulation predicts slightly higher values (about 10%) for the straw track position measurement accuracy in the core of jets for the barrel, for the reasons mentioned in section6.1.
9 Conclusion
The TRT tracking performance at low and high occupancies based on proton-proton, heavy ion and proton-lead collisions during Run 1 of the LHC operation is presented. The TRT operation with either a xenon-based or an argon-based gas mixture is studied and similar tracking performance is found for the two gas mixtures. For both gas mixtures, the straw efficiency is found to be larger
than 96% and the straw track position measurement accuracy in the straws better than 130 µm in
low occupancy conditions. Straw efficiency and measurement accuracy are studied as a function of
η,hµiand occupancy for the Xe-based gas mixture and compared to simulations, and a fair level of agreement is observed everywhere. For the Ar-based gas mixture, the dependence of the straw efficiency and the straw track position measurement accuracy on the LL threshold are studied. For threshold variations between 55 eV and 100 eV in data, the straw efficiency changes only by 1–2% and the straw track position measurement accuracy varies from∼110µm to 130µm, respectively. No significant degradation of these parameters is found up to occupancies of about 20% (hµiup to 30) for 50 ns LHC bunch spacing.
For higher occupancies the TRT tracking performance parameters are studied using specialpp
and heavy ion data-taking fills with respectively 25000 ns and 200 ns bunch spacing, resulting in no out-of-time pile-up in events. The number of precision hits on track is reduced from 85% to 75% when the TRT occupancy increases from 10% to 50%. This is expected due to the shadowing effect from pile-up particles. However, the TRT significantly contributes to the particle momentum measurement by the ATLAS ID up to straw occupancies of 90%, which are reached in heavy ion collisions.
2017 JINST 12 P05002
AcknowledgmentsWe thank CERN for the very successful operation of the LHC, as well as the support staff from our institutions without whom ATLAS could not be operated efficiently.
We acknowledge the support of ANPCyT, Argentina; YerPhI, Armenia; ARC, Australia; BMWFW and FWF, Austria; ANAS, Azerbaijan; SSTC, Belarus; CNPq and FAPESP, Brazil; NSERC, NRC and CFI, Canada; CERN; CONICYT, Chile; CAS, MOST and NSFC, China; COLCIENCIAS, Colombia; MSMT CR, MPO CR and VSC CR, Czech Republic; DNRF and DNSRC, Denmark; IN2P3-CNRS, CEA-DSM/IRFU, France; GNSF, Georgia; BMBF, HGF, and MPG, Germany; GSRT, Greece; RGC, Hong Kong SAR, China; ISF, I-CORE and Benoziyo Center, Israel; INFN, Italy; MEXT and JSPS, Japan; CNRST, Morocco; FOM and NWO, Netherlands; RCN, Norway; MNiSW and NCN, Poland; FCT, Portugal; MNE/IFA, Romania; MES of Russia and NRC KI, Russian Federation; JINR; MESTD, Serbia; MSSR, Slovakia; ARRS and MIZŠ, Slovenia; DST/NRF, South Africa; MINECO, Spain; SRC and Wallenberg Foundation, Sweden; SERI, SNSF and Cantons of Bern and Geneva, Switzerland; MOST, Taiwan; TAEK, Turkey; STFC, United Kingdom; DOE and NSF, United States of America. In addition, individual groups and members have received support from BCKDF, the Canada Council, CANARIE, CRC, Compute Canada, FQRNT, and the Ontario Innovation Trust, Canada; EPLANET, ERC, ERDF, FP7, Horizon 2020 and Marie Skłodowska-Curie Actions, European Union; Investissements d’Avenir Labex and Idex, ANR, Région Auvergne and Fondation Partager le Savoir, France; DFG and AvH Foundation, Germany; Herakleitos, Thales and Aristeia programmes co-financed by EU-ESF and the Greek NSRF; BSF, GIF and Minerva, Israel; BRF, Norway; CERCA Programme Generalitat de Catalunya, Generalitat Valenciana, Spain; the Royal Society and Leverhulme Trust, United Kingdom.
The crucial computing support from all WLCG partners is acknowledged gratefully, in particu-lar from CERN, the ATLAS Tier-1 facilities at TRIUMF (Canada), NDGF (Denmark, Norway, Swe-den), CC-IN2P3 (France), KIT/GridKA (Germany), INFN-CNAF (Italy), NL-T1 (Netherlands), PIC (Spain), ASGC (Taiwan), RAL (U.K.) and BNL (U.S.A.), the Tier-2 facilities worldwide and large non-WLCG resource providers. Major contributors of computing resources are listed in ref. [24].
References
[1] ATLAS collaboration,The ATLAS experiment at the CERN Large Hadron Collider,2008JINST3
S08003.
[2] ATLAS collaboration,ATLAS inner detector: technical design report,1,CERN-LHCC-97-016, CERN, Geneva Switzerland, (1997).
[3] ATLAS collaboration,The ATLAS inner detector commissioning and calibration,Eur. Phys. J.C 70
(2010) 787[arXiv:1004.5293].
[4] ATLAS collaboration,Expected performance of the ATLAS experiment — detector, trigger and physics,arXiv:0901.0512.
[5] X. Artru, G.B. Yodh and G. Mennessier,Practical theory of the multilayered transition radiation detector,Phys. Rev.D 12(1975) 1289.
[6] ATLAS collaboration,The ATLAS simulation infrastructure,Eur. Phys. J.C 70(2010) 823
2017 JINST 12 P05002
[7] GEANT4 collaboration, S. Agostinelli et al.,GEANT4: a simulation toolkit,Nucl. Instrum. Meth.A 506(2003) 250.
[8] T. Gleisberg et al.,Event generation with SHERPA1.1,JHEP02(2009) 007[arXiv:0811.4622]. [9] H.-L. Lai et al.,New parton distributions for collider physics,Phys. Rev.D 82(2010) 074024
[arXiv:1007.2241].
[10] X.-N. Wang and M. Gyulassy,HIJING: a Monte Carlo model for multiple jet production inpp,pA and AAcollisions,Phys. Rev.D 44(1991) 3501.
[11] T. Sjöstrand, S. Mrenna and P.Z. Skands,A brief introduction to PYTHIA8.1,Comput. Phys. Commun.178(2008) 852[arXiv:0710.3820].
[12] ATLAS collaboration,Summary of ATLAS PYTHIA8tunes,ATL-PHYS-PUB-2012-003, CERN, Geneva Switzerland, (2012).
[13] ATLAS TRT collaboration,The ATLAS Transition Radiation Tracker (TRT) proportional drift tube: design and performance,2008JINST3P02013.
[14] ATLAS TRT collaboration,The ATLAS TRT barrel detector,2008JINST3P02014.
[15] ATLAS TRT collaboration,The ATLAS TRT end-cap detectors,2008JINST 3P10003.
[16] ATLAS TRT collaboration,The ATLAS TRT electronics,2008JINST3P06007.
[17] ATLAS collaboration,Calibration of the ATLAS Transition Radiation Tracker, ATLAS-CONF-2011-006, CERN, Geneva Switzerland, (2011).
[18] ATLAS collaboration,Alignment of the ATLAS inner detector tracking system with2010LHC proton-proton collisions at√s=7TeV,ATLAS-CONF-2011-012, CERN, Geneva Switzerland, (2011).
[19] ATLAS collaboration,Alignment of the ATLAS inner detector and its performance in2012, ATLAS-CONF-2014-047, CERN, Geneva Switzerland, (2014).
[20] ATLAS collaboration,The optimization of ATLAS track reconstruction in dense environments, ATL-PHYS-PUB-2015-006, CERN, Geneva Switzerland, (2015).
[21] ATLAS collaboration,Topological cell clustering in the ATLAS calorimeters and its performance in LHC Run1,arXiv:1603.02934.
[22] M. Cacciari, G.P. Salam and G. Soyez,The anti-ktjet clustering algorithm,JHEP04(2008) 063
[arXiv:0802.1189].
[23] ATLAS collaboration,Jet energy measurement with the ATLAS detector in proton-proton collisions at
√
s=7TeV,Eur. Phys. J.C 73(2013) 2304[arXiv:1112.6426].