This is a repository copy of Food suspensions study with SR microtomography.
White Rose Research Online URL for this paper: http://eprints.whiterose.ac.uk/122517/
Version: Accepted Version
Article:
Islam, S.F., Wysokinski, T.W., Belev, G. et al. (5 more authors) (2018) Food suspensions study with SR microtomography. Chemical Engineering Science, 175. pp. 208-219. ISSN 0009-2509
https://doi.org/10.1016/j.ces.2017.09.051
[email protected] https://eprints.whiterose.ac.uk/ Reuse
This article is distributed under the terms of the Creative Commons Attribution-NonCommercial-NoDerivs (CC BY-NC-ND) licence. This licence only allows you to download this work and share it with others as long as you credit the authors, but you can’t change the article in any way or use it commercially. More
information and the full terms of the licence here: https://creativecommons.org/licenses/
Takedown
If you consider content in White Rose Research Online to be in breach of UK law, please notify us by
Accepted Manuscript
FOOD SUSPENSIONS STUDY WITH SR MICROTOMOGRPAHY
Syed F. Islam, Tomasz W. Wysokinski, George Belev, Ramana V. Sundara, Steve Whitehouse, Stefan Palzer, Michael J. Hounslow, Agba D. Salman
PII: S0009-2509(17)30605-X
DOI: https://doi.org/10.1016/j.ces.2017.09.051
Reference: CES 13828
To appear in: Chemical Engineering Science
Received Date: 31 July 2017 Revised Date: 19 September 2017 Accepted Date: 28 September 2017
Please cite this article as: S.F. Islam, T.W. Wysokinski, G. Belev, R.V. Sundara, S. Whitehouse, S. Palzer, M.J. Hounslow, A.D. Salman, FOOD SUSPENSIONS STUDY WITH SR MICROTOMOGRPAHY, Chemical Engineering Science (2017), doi: https://doi.org/10.1016/j.ces.2017.09.051
1
FOOD SUSPENSIONS STUDY WITH SR MICROTOMOGRPAHY
Syed F. Islam
1, Tomasz W. Wysokinski
2, George Belev
2,
Ramana V. Sundara
3, Steve
Whitehouse
4, Stefan Palzer
5, Michael J. Hounslow
1& Agba D. Salman
11 Department of Chemical and Biological Engineering, University of Sheffield, Sheffield, S1 3JD, UK 2 Canadian Light Source Inc., 44 Innovation Boulevard, Saskatoon, SK S7N 2V3, Canada
3 Lincoln Institute for Agri-food Technology, University of Lincoln, Lincoln LN6 7TS 4 Nestlé Product Technology Centre Confectionery, Haxby Road, York, YO91 1XY, UK
5 Nestec Ltd., Nestlé Research Centre, Case Postale 44, 1000 Lausanne 26, Switzerland [email protected]
ABSTRACT
The incorporation of a small amount of secondary immiscible liquid to suspensions can lead to a shift from a fluid-like structure to a paste-like structure. This is ascribed to the higher attraction of the secondary liquid to the particles, in comparison to the continuous phase. However, visual observations on the micro-scale during both long and short term time-scales, dependant on the type of secondary immiscible liquid used are yet to be reported.
In the current study, the movement of various secondary immiscible liquids (water, sucrose solutions, saturated sucrose solution and glycerol) when added to a model food suspension (sucrose particles in sunflower oil) was investigated. Dynamic X-ray computed tomography was used, as a non-invasive approach, to study the mass transfer on the micro-scale and to observe the bulk movement of sucrose within the suspension. It was found that the affinity of the secondary liquid in dissolving sucrose was the primary contributor to the secondary liquid movement, with density/gravitational effects playing a minimal role.
KEYWORDS
Synchrotron Radiation X-ray microtomography; computed tomography; Dynamic µ CT; Suspensions; Sucrose; Secondary immiscible liquid; Sunflower oil; 05ID-2
1. INTRODUCTION
Numerous suspension based food products comprise of solid hydrophilic particles suspended throughout a continuous hydrophobic liquid phase. When a minor quantity of a secondary immiscible liquid (water or glycerol) is added, it results in a transition from a fluid-like material to a paste-like material [1, 2]. This transition into a paste-like material may be manipulated to offer sample stability, and allow products to retain their desired shape long term [3]. This rearrangement has been attributed to the establishment of liquid bridges between the hydrophilic particles by the secondary liquid, varying the rheological properties of the suspension several-fold [4-6]. The secondary liquid has a superior affinity to the solid particles, in contrast to the continuous phase, because of their hydrophilic characteristic. However, there are very few published results showing the microscale changes responsible for these transitions in a qualitative manner.
2 effect and diffusion processes [7]. This work presents the effect of changing the type of liquid and the subsequent mass transfer-taking place on the micro-scale.
X-ray computed micro-tomography (µ-CT) has been used successfully to study the structures and properties of many products including food. These include bread, cereal bars, apples, mayonnaise, coffee beans and chocolate to name a few [8-17]. The present work uses a non-invasive method, via synchrotron X-ray µ-CT to track the movement of a secondary immiscible liquid, within a model food suspension. This is achieved by taking a dynamic (4D µCT) approach and scanning the sample at different time intervals. This technique enabled the evolution of the system to be monitored over a set period of time. Previous work has focused on studying the mass transfer and changes in dynamics when changing the volume of secondary liquid added [18, 19]. This work will concentrate on changing the secondary liquid type (in particular the sucrose concentration), on the dynamics of the system.
2. MATERIALS AND METHODS
Materials
Suspensions of sucrose particles (ZMR Zuckermühle Rupperswil AG, Germany, d10 – 8.45 µm, d50 – 30.9 µm, d90 – 82.7 µm Malvern Mastersizer S) and sunflower oil (Surface tension 35.5 mN/m, FTA125. Viscosity 49 mPa s, Malvern Kinexus lab+, measured at 25°C) were used for all experiemnts. Further details of sample preparation can be found in Islam, Sundara [19].
The suspensions were transferred using a pipette into cellulose straws (each sample was added to a new cellulose straw, 7 samples in total, 5.75 mm diameter, Fishers Ideas, UK) which were glued (to prevent leakage of sunflower oil) to a plastic chuck precisely designed for the X-ray µCT experiments. A lid was then placed on top which had a hole in the centre ensuring the depositing of the secondary liquid using an electronic pipette (Eppendorf Xplorer, UK) on the central axis of the sample. After the addition of secondary liquid, the lid was replaced with another containing no hole to prevent any evaporation of the secondary liquid during the experiment.
The secondary liquid was varied altering the viscosity, density and sucrose solubility to better understand the effect this has on the mass transport taking place. The liquids used were distilled water, sucrose solutions (10 % wt., 30 % wt., 40 % wt. and 67 % wt.) and glycerol. Solutions were prepared by dissolving with stirring the relevant amount of sucrose crystals in deionised water at room temperature (25°C) [20].
Rheological properties
The viscosities of the secondary liquids were measured using a rotational rheometer (Kinexus Lab+, Malvern, UK). A cone & plate geometry was used (1/50, 1° angle and 50 mm diameter). Measurements were conducted over a shear rate ramp (range of 10 – 1000 s-1), ensuring steady state torque before proceeding to the next rate setting. All experiments were conducted at 25°C.
Interfacial tension
3
Synchrotron X-ray µCT measurements
All samples studied were scanned at the BMIT beamline (BMIT 05ID-2) at the Canadian Light Source (Saskatoon, Canada) [21]. The X-ray energy was set to 25 keV. The sample to detector distance was 0.4 m. For each sample, 750 projections were acquired with equiangular steps over a range of 360°, with a regular angular step of 0.24°. The effective pixel size of the detector was 3.2
m. For the experiments, the pixel size was fixed to 6.4 m, applying a 2 × 2 binning. The total
scan time for each sample was 12 minutes.
Scans were reconstructed using the NRecon software (Bruker, Belgium) resulting in 3D datasets containing 1006 slices. Reconstructed images were analysed using the software Image J. The slice chosen for analysis purposes was where the secondary liquid was largest in diameter along the X-axis (Figure 1).
Synchrotrons provide users with unique, phase-related imaging methods. They provide very high flux with a flat energy spectrum and quasi-coherent beam. Phase-sensitive imaging methods exploit differences in the refractive index of the sample to enhance the acquired contrast, especially useful when imaging weakly absorbing samples (low Z materials). The high brightness reduces the total time required for the experiment and monochromatic imaging is not affected by beam hardening artefacts. In comparison, benchtop systems require longer acquisition times due to lower X-ray flux, and the beam is polychromatic leading to beam hardening artefacts that reduce the image quality.
3. RESULTS AND DISCUSSION
Secondary liquid properties
Experiments were conducted to investigate the rheological properties of the different secondary liquids. All liquids exhibited Newtonian behaviour. The viscosity and density values for the secondary liquids used can be seen in Table 1. The interfacial tension in air and sunflower oil can be seen in Table 2.
Varying sucrose concentration of the secondary liquid – Short term behaviour
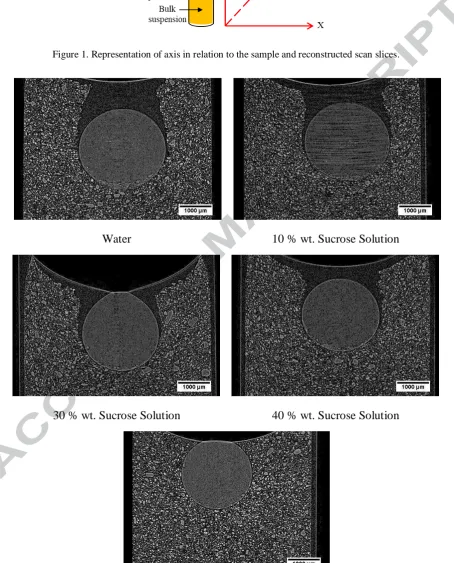
X-ray scans were conducted on suspensions of sucrose and oil (50:50 % by wt.) to which a fixed volume of 5 µ l of secondary liquid was deposited on the top surface as a droplet, with a diameter of 2.12 mm. The secondary liquids added were: distilled water; 10 % wt. sucrose solution; 30 % wt. sucrose solution; 40 % wt. sucrose solution and a saturated sucrose solution. Water has the greatest affinity and ability to dissolve sucrose, whereas saturated sucrose solution has no capacity to
dissolve any additional sucrose at 25°C, thus allowing the full range of sucrose solubility to be investigated in driving the movement of the secondary liquid within the suspension.
4 The volumes of the different droplets in Figure 2 were measured after the experiments and are shown in Figure 3. All droplets had an initial volume of 5 µ l (5.0 mm3) at depositing, and it can be seen that after 150 minutes the water droplet had increased the greatest extent to approximately 8.1 mm3, indicating it had taken up the greatest amount of solid sucrose from the bulk suspension, followed by the 10 % wt. sucrose solution with a volume of 7.7 mm3, then the 30 % wt. and 40 % wt. sucrose solutions with a volume of 6.1 mm3 and 5.8 mm3, respectively. The water droplet has the greatest ability to take up solid sucrose as it initially had a 0% concentration of sucrose, whereas the 40% wt. sucrose solution is already close to the saturation limit of 66% wt. for sucrose at room temperature and therefore will take up solid sucrose at a slower rate, which agrees with the images seen in Figure 2 and the graph in Figure 3.
Further scans on these samples conducted after 300 minutes are shown in Figure 4. The same trend persists with the water droplet moving the deepest into the suspension and increasing the most in volume, whereas the saturated sucrose solution droplet showed virtually no change in volume or movement into the suspension. Some settling of the surrounding sucrose particles of the bulk suspension is evident near the surface in the image for the saturated sucrose solution droplet experiment. The volumes of the secondary liquid droplets from the images in Figure 4 are presented in Figure 5. One reason for the saturated sucrose solution not moving at all, is believed to be due to the droplets inability to take up any solid sucrose from the bulk suspension easily, due to already being at the saturation point, as well as the higher surface tension of the saturated sucrose solution droplet has in comparison to the sucrose solutions and water [22].
The water droplet had increased in volume to 10.4 mm3 after a further 150 minutes (300 minutes in Figure 5), an increase of 2.3 mm3. The 10 % wt. sucrose solution increased to 9.8 mm3 (a further 2.1 mm3), and the 40 % wt. sucrose solution increased incrementally by only 0.8 mm3 to 6.6 mm3 in the same period. The saturated sucrose solution showed no change in volume (4.7 mm3). The volume of the saturated sucrose droplet is lower than 5.0 mm3, due to some liquid remaining in the tip of the pipette during dispensing, due to the viscous nature of the liquid.
A volume of water becoming saturated with sucrose at room temperature (25°C) would result in an additional 126 % volume [20]. Therefore, for a 5 µ l (5 mm3) volume to become saturated with sucrose the incremental 6.3 mm3 would give a total volume of 11.3 mm3. A scan was conducted after 630 minutes for the 5 µ l water sample (Figure 6) revealing a droplet volume of 18.2 mm3. This is well above the 11.3 mm3 required for saturation implying that additional crystalline sucrose is also incorporated.
The accumulation of solid sucrose that had entered the droplet can be seen and is highlighted by a red dashed line in Figure 6. Individual sucrose crystals can also be seen within the droplet. These were only resolved through the use of the synchrotron facility which offers substantially improved scan and image quality in comparison to benchtop X-ray CT systems.
The slice corresponding to the red dashed line on the Z-axis of Figure 6 is presented in Figure 7. It can be seen how solid sucrose crystals are present within the secondary liquid droplet as well as the surrounding bulk suspension. The central most region of the secondary liquid droplet is clear, indicating no presence of solid sucrose. The dispersion of solid sucrose will gradually encroach on the droplet centre as more crystals cross the interface from the surrounding suspension.
Varying sucrose concentration – Long term behaviour
5 the secondary liquid on sucrose in oil suspension samples. Images for scans taken after 40 hours can be seen in Figure 8. The distilled water and 40 % wt. sucrose solution display a similar distinguished shape which is very different to the spherical shapes seen in earlier scans (Figure 4). The sample to which water was added is greater in both the horizontal and vertical dimension, in comparison to the 40 % wt. sucrose solution, even though initially the same volume was added. This accords with the water having the greatest remaining capacity to dissolve and take up additional sucrose from the suspension. The 40 % wt. sucrose droplet is nearer to the saturation limit and thus has a limited capacity to dissolve further sucrose. Therefore, the majority of the sucrose which does enter will remain in the solid state with a small proportion dissolving slowly to raise the concentration of the syrup toward saturation.
The maximum length in the horizontal and vertical dimensions of the distinguished shapes in Figure 8 for both water and 40 % wt. sucrose solution were measured as defined by red arrows in Figure 8. For water, the maximum horizontal dimension and vertical dimension was 3.8 mm and 3 mm respectively, whereas for the 40 % wt. sucrose solution the maximum dimension measured was 3.2 mm and 2.6 mm, respectively.
The saturated sucrose droplet in Figure 8 shows a volume increase of 0.3 mm3 during the approximately 35 hour period following the imaging of Figure 4. The droplet has detached from the surface of the oil layer and the surrounding sucrose particles of the bulk suspension have settled. The low rate of movement of the saturated sucrose solution despite its large density (Table 1), shows that gravity is not the dominating mechanism driving the movement. It is believed that there is no thermodynamic driving force for solid sucrose to transfer from the bulk suspension into the saturated droplet, which is the reason for the slow penetration/movement.
A scan conducted after 102.5 hours for the saturated sucrose sample (Figure 9) showed a volume increase of 0.2 mm3 in the additional 62 hours since that of Figure 8. Clearly, some change was occurring though at a considerably lower rate in comparison to the cases of water and lower concentration solutions.
A slice taken along the Z-axis marked by the red dashed line in Figure 9 is shown in Figure 10. The presence of sucrose crystals can be seen at the boundary between the saturated solution and the bulk suspension. The increase in volume must have been due to sucrose crystals entering the droplet from the bulk suspension, but these crystals have favoured sitting at the interface. Effectively, a barrier crust may have formed due to crowding of the boundary layer possibly reinforced by re-crystallisation effects bonding the crystals. Further, in Figure 9 there is evidence of solid sucrose present near the top of the saturated sucrose droplet at a location where there was no contact with the bulk suspension from which solid sucrose crystals can enter. This supports the hypothesis of crystals being initially mobile in the interfacial layer.
Glycerol
6 surface layer. In the scan image at 44 hours, a red arrow marks the presence of a large sucrose crystal in the suspension which at 84 hours was found transferred into the lower region of the glycerol droplet (Figure 12) along with many other crystals. This large crystal is arrowed in Figure 12 as well as the void it had occupied in the adjacent suspension. It is apparent that this crystal was caused to translate across the interface by wetting and surface tension forces, and presumably, the same mechanism acted on all the other ingested crystals.
The behaviour of glycerol droplets in these suspensions was seen to be very different to those of water and sucrose solutions in terms of rate of response and capacity to incorporate sucrose and dilate. The viscosity of glycerol is high compared to the sucrose solutions which may moderate a mechanism of travel reliant on flow transfer across the interface. Density is not dissimilar to high concentration sucrose syrups, again suggesting that gravity was not a controlling force on speed but perhaps dictated the direction of travel (Table 1).
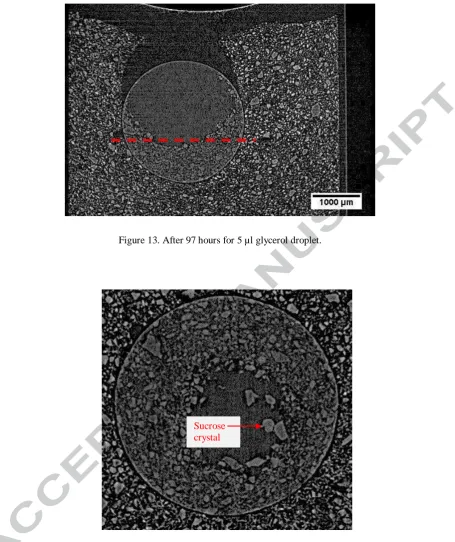
The glycerol droplet increased by 0.8 mm3 volume during the first 44 hour period after addition. Over the next 40 hours, the droplet increased disproportionately by 1.9 mm3 perhaps because earlier it had been attached to the oil surface and prevented from colliding with suspension particles by a downward movement. The 5 µl water droplet showed a greater dilation in the first 5 hour period following addition (Figure 5) than the glycerol droplet of the same initial volume over 84 hours. The solubility of sucrose in glycerol is approximately 7% wt., which is significantly lower than in water (67% wt.) [20]. Therefore, substantially any sucrose entering the glycerol droplet will remain in the solid state. This was confirmed by viewing a slice (red dashed line) along the Z-axis from the image in Figure 13 (97 hours) as shown in Figure 14. It appears that the packing arrangement of the sucrose particles is more close/dense within the droplet than in the surrounding bulk suspension.
Dissolution of sucrose
The images presented have shown that high-resolution high contrast scans collected at BMIT are able to capture the microscale detail of solid sucrose particles both within the suspension and the secondary liquid droplet. Furthermore, for the secondary liquid droplet to progress into the suspension, it must either include or displace crystalline sucrose particles from the volume ahead. The imaging capability allows to determine the fate of these particles
It is hypothesised that the initial sucrose which enters a water droplet from the bulk suspension will dissolve relatively easily and quickly. However, as further quantities of crystalline solid are introduced their dissolution will become highly retarded particularly without convective mass transfer to disrupt weak concentration gradients close to saturation values. To make observations relative to this hypothesis experiments were conducted on a 7.5 µ l water droplet, in particular focusing on the early stages after addition to a sucrose in oil suspension. Images from a series of scans made between droplet addition and up to 150 minutes after are presented in Figure 15. In this period the droplet volume increased by 5 mm3 and travelled a distance of 0.55 mm into the suspension (into the space indicated by the red rectangle drawn in the first image). Therefore a volume 0.55 mm deep below the droplet, previously occupied by a mixture of sucrose and sunflower oil, became occupied by the dilating droplet. The sucrose crystals which were there previously had entered the droplet and disappeared (dissolved). The particle arrangement in the suspension further below the droplet remained the same indicating that displacement by the droplet was not an active mechanism.
7 and Y axes were searched for both 120 and 150 minute scans with no trace found. The Z-axis slice marked by the red dashed line in Figure 15 is shown in Figure 16 as an example demonstrating the absence of particles in this lower region of the droplet. Therefore, this sucrose crystal had entered the droplet and dissolved completely during 30 minutes between 90 and 120 minutes from the addition of the water droplet. For the first 150 minutes the dilation of the droplet was seen to be due to solid sucrose entering from the bulk suspension and complete dissolution.
Scan images following longer storage are presented in Figure 17. After 330 minutes the lower portion of the droplet was beginning to fill with particles indicating that the rate of accumulation was then outpacing dissolution. This was to be expected at some point as sucrose concentration rose and retarded dissolution.
The volume of the droplet after 330 minutes was 17.1 mm3 and at 750 minutes was 25.6 mm3 – an increase of 8.5 mm3 in a period of 420 minutes. The scan images show the growing accumulation of particulate sucrose in the lower region of the droplet. At 750 minutes half the droplet volume was occupied by a particle bed. The 340% dilation of the original water droplet volume was the combined result of dissolution and of solid inclusion of sucrose shown schematically in Figure 18 as a two-stage mechanism.
A particularly large sucrose crystal can be seen in the suspension after 330 minutes in Figure 17. It is highlighted in the image with a red arrow. This same crystal had moved into the droplet by the time of the scan at 360 minutes leaving a void in the adjacent suspension as arrowed. After 750 minutes this crystal, apparently undiminished by dissolution, had been significantly displaced within the droplet as further solid sucrose from the bulk suspension entered from beneath. A Z-axis slice shown in Figure 19 again locates this same large particle.
Two further scans conducted after 24 hours and 34 hours produced images seen in Figure 20. After 24 hours, it can be seen that the droplet was fully occupied by a bed of particulate sucrose and has changed dramatically in shape acquiring a concave upper face. The large crystal shown in Figure 17 can still be found (marked by a red arrow) pushed to the top of the droplet as yet further sucrose entered beneath. Once the droplet was full of particles, the system was clearly not yet in a state of equilibrium as the movement of water/liquid continued as evidenced by the changes revealed in the image after 34 hours.
A slice along the Z-axis after 34 hours at the red dashed line in Figure 20 can be studied in Figure 21 which includes a magnified area from the slice. It can be seen that in regions beyond the nominal boundary of the droplet connected structures have formed by suspension particles apparently bridged by a liquid phase. This causes the oil to be displaced into connected channels. The hypothesised mechanism of bridging is shown schematically in Figure 22. The driving force for the formation of the liquid bridge is the interfacial tension and the resistance to this flow is due to the viscosity (Table 1 & Table 2) [23].
Once the sucrose crystal suspended in oil are contacted by water a liquid bridge forms drawing them together under the driving influence of interfacial tension. Sucrose might also partially dissolve into the liquid bridge causing an increase in viscosity and a ‘sintering’ of the network. The oil previously present between the particles is displaced by flow under the resistance of its viscosity [20]. This creates a separated system comprising a contracted porous structured suspension and excluded free oil at the top and sides of the sample.
8
5. CONCLUSION
In this study, the behaviour of droplets of different secondary immiscible liquids (water, sucrose solutions, saturated sucrose solution and glycerol) when added to a suspension of crystalline sucrose in sunflower oil was investigated on the scale. This was achieved using synchrotron micro-tomography to observe the interactions at high resolution and to monitor the dynamics of change. This work was a follow up of previous work conducted focusing on different volumes of the same secondary liquid (water) and the effect this has on the dynamics, as well as the importance of surface area to volume ratio in driving the mass transfer of sucrose from the bulk suspension [18].
It was hypothesised that sucrose dissolution and solubility play key roles in the rate of movement of the secondary liquid during the early stages. This was verified using sucrose solutions of different concentrations varying from distilled water to saturation. Distilled water exhibited the quickest gain in volume and associated progress into the bulk suspension, whereas a saturated sucrose solution showed minimal movement and limited changes in volume even after extended presence in the suspension. The saturated sucrose solution has a highest density tested, thereby demonstrating by its lack of response that gravitational force is not the key factor driving movement in such a system.
Glycerol, which is similar in density to concentrated sucrose solutions but much more viscous, moved through the suspension by engulfing sucrose particles from the suspension ahead. It showed similar behaviour to water, though at a considerably slower speed. It is known that the solubility of sucrose within glycerol is very low compared to water and hence this would be a negligible part of the transport mechanism. Rather, viscous-limited capillary wetting of particles might have been controlling dynamics.
The noteworthy quality of the images from the Canadian synchrotron facility enabled the presence of solid sucrose within the secondary liquid droplet to be tracked and monitored. This proved invaluable as two mechanisms driving movement of the droplet could be distinguished. The first during the early stages being sucrose particles entering the droplet and dissolving completely leading to an increase in volume. This was followed during intermediate to long term periods where further solid sucrose from the suspension entered the droplet and accumulated within with little dissolution. This was verified by tracking the changes in the volume of the droplet and the presence and location of solid sucrose within the droplet with time.
Finally, the operation of an additional mechanism in the mature stages of the aqueous systems was recognised whereby the wider suspension became linked by a liquid bridging ‘sintering’ effect. Water transport mode from the droplet body in this stage remains unresolved.
ACKNOWLEDGEMENTS
We would like to acknowledge the financial support of BBSRC (Grant no. BB/K501542/1) and Nestlé PTC York in supporting this research. Also to express our thanks to Dr Mohammed Saleh and Dr Menan Balashanmugam in assisting with experimental set-up.
9
REFERENCES
1. Koos, E. and N. Willenbacher, Capillary Forces in Suspension Rheology. Science, 2011. 331(6019): p. 897-900.
2. Johansson, D. and B. Bergenståhl, The influence of food emulsifiers on fat and sugar dispersions in oils. I. Adsorption, sedimentation. Journal of the American Oil Chemists Society, 1992. 69(8): p. 705-717.
3. Stortz, T.A. and A.G. Marangoni, Heat resistant chocolate. Trends in Food Science & Technology, 2011. 22(5): p. 201-214.
4. Koos, E. and N. Willenbacher, Particle configurations and gelation in capillary suspensions. Soft Matter, 2012. 8(14): p. 3988.
5. Koos, E., et al., Tuning suspension rheology using capillary forces. Soft Matter, 2012. 8(24): p. 6620.
6. Negreiros, A.A., et al., Microscale study of particle agglomeration in oil-based food suspensions: The effect of binding liquid. Powder Technology, 2015. 270, Part B(0): p. 528-536.
7. Ghosh, V., et al., Diffusion of Moisture through Chocolate-flavoured Confectionery Coatings. Food and Bioproducts Processing, 2004. 82(1): p. 35-43.
8. Chevallier, S., et al., Determining the Cellular Structure of Two Cereal Food Foams by X-ray Micro-Tomography. Food Biophysics, 2014. 9(3): p. 219-228.
9. Falcone, P.M., et al., A Novel Approach to the Study of Bread Porous Structure: Phase-contrast X-Ray Microtomography. Journal of Food Science, 2004. 69(1): p. FEP38-FEP43.
10. Falcone, P.M., et al., Imaging Techniques for the Study of Food Microstructure: A Review, in Advances in Food and Nutrition Research. 2006, Academic Press. p. 205-263.
11. Frisullo, P., A. Conte, and M.A. Del Nobile, A Novel Approach to Study Biscuits and Breadsticks Using X-Ray Computed Tomography. Journal of Food Science, 2010. 75(6): p. E353-E358. 12. Frisullo, P., et al., Microstructural Characterization of Multiphase Chocolate Using X-Ray
Microtomography. Journal of Food Science, 2010. 75(7): p. E469-E476.
13. Pittia, P., et al., Evaluation of Microstructural Properties of Coffee Beans by Synchrotron X-Ray Microtomography: A Methodological Approach. Journal of Food Science, 2011. 76(2): p. E222-E231.
14. Herremans, E., et al., X-ray CT for quantitative food microstructure engineering: The apple case. Nuclear Instruments and Methods in Physics Research Section B: Beam Interactions with Materials and Atoms, 2014. 324(0): p. 88-94.
15. Reinke, S.K., et al., Synchrotron X-Ray microtomography reveals interior microstructure of
multicomponent food materials such as chocolate. Journal of Food Engineering, 2016. 174: p. 37-46. 16. Laverse, J., et al., X-ray microtomography to study the microstructure of mayonnaise. Journal of
Food Engineering, 2012. 108(1): p. 225-231.
17. Omar, C.S., et al., Roller compaction: Effect of relative humidity of lactose powder. European Journal of Pharmaceutics and Biopharmaceutics, 2016. 106: p. 26-37.
18. Islam, S.F., et al., Studying model suspensions using high resolution synchrotron X-ray microtomography. Chemical Engineering Research and Design, 2017. 117: p. 756-772.
19. Islam, S.F., et al., Movement of a secondary immiscible liquid in a suspension using a non-invasive technique. Chemical Engineering Research and Design, 2016. 110: p. 160-170.
20. Bucke, C., Sucrose, properties and applications. Vol. 69. 1995, London: Chapman & Hall.
21. Wysokinski, T.W., et al., Beamlines of the biomedical imaging and therapy facility at the Canadian light source – part 3. Nuclear Instruments and Methods in Physics Research Section A:
Accelerators, Spectrometers, Detectors and Associated Equipment, 2015. 775: p. 1-4.
22. HirschmÜLler, H., Chapter 2 - Physical Properties of Sucrose A2 - HONIG, PIETER, in Principles of Sugar Technology. 2013, Elsevier: S-Hertogenbosch. p. 18-74.
23. Downton, G.E., J.L. Flores-Luna, and C.J. King, Mechanism of stickiness in hygroscopic,
[image:13.595.71.526.142.705.2]
11
Figure 1. Representation of axis in relation to the sample and reconstructed scan slices.
Water 10 % wt. Sucrose Solution
30 % wt. Sucrose Solution 40 % wt. Sucrose Solution
Saturated Sucrose Solution
[image:14.595.117.481.79.344.2]
12
Figure 3. The volume of the droplets from the images in Figure 2 after 150 minutes.
0 2 4 6 8
Distilled water 10% wt sucrose solution
30% wt sucrose solution
40% wt sucrose solution
Saturated sucrose solution
Vo
lu
m
e
(
mm
13
Water 10 % wt. Sucrose Solution
30 % wt. Sucrose Solution 40 % wt. Sucrose Solution
[image:15.595.77.525.53.582.2]
Saturated Sucrose Solution
[image:16.595.114.527.69.354.2]
14
Figure 5. The volume of the droplets from the images in Figure 4 after 300 minutes.
Figure 6. Central slice along X-axis 630 minutes after injection (where the diameter of the water droplet is largest), for 5 µl water droplet.
0 2 4 6 8 10
Distilled water 10% wt sucrose solution
30% wt sucrose solution
40% wt sucrose solution
Saturated sucrose solution
Vo
lu
m
e
(
mm
[image:16.595.92.430.385.560.2][image:17.595.163.454.54.338.2]
15
Figure 7. Slice along Z-axis from Figure 6.
Water 40 % wt. Sucrose Solution
Saturated Sucrose Solution
[image:17.595.63.473.360.716.2][image:18.595.80.533.52.592.2]
16
Figure 9. After 102.5 hours for 5 µl saturated sucrose droplet.
Figure 10. Slice along Z-axis in Figure 9, for 5 µl saturated sucrose droplet, 102.5 hours after injection.
[image:18.595.158.521.54.261.2]
17
After 0 min After 12.5 hours
[image:19.595.80.528.56.409.2]After 22 hours After 44 hours
Figure 11. Time lapse of the central slice along X-axis (where the diameter of the droplet is largest), for 5 µl glycerol droplet. The scale on images is 1 mm.
[image:19.595.64.455.452.673.2][image:20.595.77.533.53.596.2]
18
Figure 13. After 97 hours for 5 µl glycerol droplet.
Figure 14. Slice along Z-axis in Figure 13 for 5 µl glycerol droplet after 97 hours after injection.
19
After 0 min After 90 mins
After 105 mins After 120 mins
[image:21.595.80.525.52.589.2]After 150 mins
[image:22.595.219.495.54.243.2]
20
Figure 16. Slice along Z-axis from image after 120 minutes from Figure 15.
After 330 mins After 360 mins
After 750 mins
[image:22.595.72.512.261.624.2][image:23.595.61.532.49.679.2]
21
Figure 18. Schematic for proposed movement of sucrose from bulk suspension into water droplet during early and late stages.
Figure 19. Slice along Z-axis from the image after 750 minutes in Figure 17.
[image:23.595.104.529.56.205.2]After 24 hours After 34 hours
22
[image:24.595.100.533.59.304.2]Slice Magnified image
Figure 21. Slice along Z-axis, coincident with the red dashed line in Figure 20, after 34 hours from injection.
Sucrose suspended Liquid bridge formation
[image:24.595.71.504.330.644.2][image:25.595.59.538.83.642.2]
23
Table 1. Viscosity and density values of liquid solutions (25°C).
Viscosity (mPa·s) Density (kg/m3)
Distilled water 0.98 1000
10 % wt suc solution 1.30 1040
20 % wt suc solution 1.71 1083
30 % wt suc solution 2.74 1129
40 % wt suc solution 5.00 1179
50 % wt suc solution 12.2 1232
Saturated suc solution 150 1337
[image:25.595.156.535.86.329.2]Glycerol 712 1258
Table 2. Surface tension measurements for secondary liquids.
Surface tension in air (mN/m)
Interfacial tension in sunflower oil (mN/m)
Distilled water 68.84 ± 0.4 26.4 ± 0.1
Saturated sucrose solution 76.12 ± 0.1 25.1 ± 0.2
Glycerol 62.51 ± 0.5 17.7 ± 0.5
Highlights
Innovative dynamic method using synchrotron X-ray CT to monitor the movement of a secondary immiscible liquid within the suspension of sucrose and sunflower oil.
Time lapse of scans taken to observe variation in samples, to understand dynamics taking place.
Type of secondary liquid as well as sucrose solubility, greatly influence system dynamics and mass transfer.