White Rose Research Online URL for this paper:
http://eprints.whiterose.ac.uk/135577/
Version: Accepted Version
Article:
Brintrup, A., Wang, Y. and Tiwari, A. (2017) Supply networks as complex systems: a
network-science-based characterization. IEEE Systems Journal, 11 (4). pp. 2170-2181.
ISSN 1932-8184
https://doi.org/10.1109/JSYST.2015.2425137
© 2015 IEEE. Personal use of this material is permitted. Permission from IEEE must be
obtained for all other users, including reprinting/ republishing this material for advertising or
promotional purposes, creating new collective works for resale or redistribution to servers
or lists, or reuse of any copyrighted components of this work in other works. Reproduced
in accordance with the publisher's self-archiving policy.
[email protected] https://eprints.whiterose.ac.uk/ Reuse
Items deposited in White Rose Research Online are protected by copyright, with all rights reserved unless indicated otherwise. They may be downloaded and/or printed for private study, or other acts as permitted by national copyright laws. The publisher or other rights holders may allow further reproduction and re-use of the full text version. This is indicated by the licence information on the White Rose Research Online record for the item.
Takedown
If you consider content in White Rose Research Online to be in breach of UK law, please notify us by
Supply Networks as Complex Systems:
A Network-Science-Based Characterization
Alexandra Brintrup, Yu Wang, and Ashutosh Tiwari
Abstract—Outsourcing, internationalization, and complexity characterize today’s aerospace supply chains, making aircraft manufacturers structurally dependent on each other. Despite sev-eral complexity-related supply chain issues reported in the litera-ture, aerospace supply chain structure has not been studied due to a lack of empirical data and suitable analytical toolsets for studying system structure. In this paper, we assemble a large-scale empirical data set on the supply network of Airbus and apply the new science of networks to analyze how the industry is structured. Our results show that the system under study is a network, formed by communities connected by hub firms. Hub firms also tend to connect to each other, providing cohesiveness, yet making the network vulnerable to disruptions in them. We also show how network science can be used to identify firms that are operationally critical and that are key to disseminating information.
Index Terms—Aerospace, complex system, network science, supply networks.
I. INTRODUCTION
S
UPPLY network systems emerge as firms self-organize into a delivery chain that makes parts necessary for the assembly of a final product. Firms decide what and how to produce, where to position themselves geographically, and with whom to link. Individual firms have limited control and visibility over the entire network [10]. As such, each firm can be seen as a selfish agent that interacts with other firms toward a collective goal, but also pursues its own goals using its capabilities. Researchers have discussed how these properties make supply chains complex systems with network-like struc-tures [10], (Choiet al.2001), [27], [28], [46], [47]. Although definitions of a complex system vary, it is generally accepted that a complex system is the result of a network of individual components interacting by following local rules without central control [30].While the idea of supply networks as complex systems has been put forward some time ago, most recent operations and industrial informatics literature is still built on simple models assuming few firms connected together in a chain-like fashion. Chains imply centrally designed linear flow, with a few firms delivering goods to the end customer. Complex systems, on
Manuscript received November 18, 2014; revised January 8, 2015; accepted March 14, 2015.
A. Brintup and A. Tiwari are with the Department of Manufacturing and Materials, Cranfield University, Cranfield MK43 0AL, U.K. (e-mail: [email protected]; [email protected]).
Y. Wang was with the Department of Manufacturing and Materials, Cranfield University, Cranfield MK43 0AL, U.K. He is now with the Commercial Aircraft Corporation of China, Ltd., Shanghai 200120, China (e-mail: [email protected]).
Digital Object Identifier 10.1109/JSYST.2015.2425137
the other hand, are networks, with many actors interacting with each other through various pathways. The difference is an important one, because the interaction structure of a system impacts its functional properties such as robustness to per-turbations and performance in distributing information and delivering output [35].
Complex systems can be studied using network science [35]. Network science evolved from graph theory and has its roots in the 1960s [17]. It abstracts systems as a set of nodes and links, the former representing agents and the latter the interactions among them. Doing so, it reveals a structure and infers the governing rules of the system. Work on network science has exploded in the past decade, and applications to complex sys-tems proved it to be a powerful methodology in understanding how these systems work [6]. Works in this arena ranged from understanding the dynamics of the Internet [1] to the targeting of terrorist social networks [38], the spread of diseases [26], to the spread of social influence (Onnela and Reed-Tsochas 2010), and economic activity of countries [22].
The reason behind this explosion is data. Increase in compu-tational power meant that researchers can now sift through vast arrays of data. Network science, being a powerful abstraction methodology, helps researchers analyze data from a wide va-riety of seemingly unconnected complex systems and discover similarities in the underlying patterns of behavior [6].
There are, however, very few empirical studies on the ap-plication of network science to the study of complex supply networks [8]. One reason for this is the difficulty in gathering empirical data, as firms do not readily reveal their connections and have little incentive to do so. Another reason is the lack of case studies and guides in the application of network-based analysis [8], [24]. It is little understood how and why network science can help operations researchers used to studying dyadic relationships between a few firms.
In this paper, we initiate a step toward addressing these gaps. First, we collect a large data set from a third-party industrial database, which allows the application of network-science-based analysis to the study of a supply network. Using a case study from the Airbus Group, it is first shown that the supply chain is a complex network and that network-based abstraction can highlight structural properties that affect its functioning. Second, the case study acts as the first structural analysis of the aerospace industry using network science. The data reveal interesting and important insights: nonlinear pathways exist between firms, the structure is composed of communities that are formed by different industrial sectors and geographic locations, and most firms connect to large hub firms, which act as bridges between communities, providing cohesiveness.
Hubs tend to connect to other hubs, reducing path lengths for the distribution of information, but also increasing system vulnerability to disruption in these hubs.
In what follows, first, a literature review is presented, fol-lowed by a description of data collection and methodology. Then, the results of the network analysis case study are given, followed by a conclusion of our findings.
II. LITERATUREREVIEW
The aircraft market keeps growing with the popularity of low-cost air carriers and the need for replacing old fuel inef-ficient aircraft with newer models. Aerospace production sys-tems are characterized by highly specialized manufacturing and assembly processes coupled through global supply chains [43]. Three main sourcing trends impact today’s aerospace supply chains.
First of these is the focus on core capabilities. The traditional single component sourcing has largely been replaced with mod-ular architectures. Original equipment manufacturers (OEMs) are the main assemblers, who work with a number of prime contractors in Tier 1. In this production system, downstream suppliers provide prime contractors with a subassembly, which then goes to the OEM [4], [45]. The sourcing trends in the in-dustry suggest that large companies focus on core competencies and to outsource more design and manufacture. Modular system architectures are popular as these require less customization and make switching between suppliers simpler. The required degree of precision and variability of production processes mean that prime contractors rely on suppliers to design and build entire subsystems or modules [3] and must have specialized knowl-edge about the modules developed by their suppliers. Suppliers to the prime contractors themselves can be systems integrators that coordinate their own supply chain [39]. Few companies in the world can afford the level of precision and cutting-edge technology required to support aircraft manufacturing, resulting in multiple customers per supplier.
The second trend is rationalization. Prime contractors are increasingly dealing with few suppliers [39]. Combined with the focus on core capabilities and outsourcing systems to the supplier base, this means that companies are increasingly de-pendent on capable suppliers to continue providing competitive subsystems and subassemblies, which incorporate advanced product and process technology.
The third trend is internationalization. In addition to high de-pendence on a limited number of suppliers, OEMs incorporate suppliers specifically from the customer countries, hoping to gain more overseas market share. As a result, the supply chains have evolved from single material transactions to global supply chains [40].
Combined together, these trends hint at long chains of highly interdependent firms across the world, but do not tell much about the actual structure of the industry. However, supply chains can make or break the aerospace industry—65%–80% of final cost of aerospace production is dedicated to suppliers, while majority of delays and quality issues can be also traced back to supply chain and management and coordination issues (Tang et al. 2013), [40].
On the other hand, many researchers have stressed the im-portance of considering supply chain ideas from a structural perspective (for example, [15], [16], [27], [28], [36]). However, progress has been constrained by a lack of analytical tools to describe and interpret network structures. The last decade has seen the emergence of a substantial body of techniques under the broad heading of “network science” (Watts 2004) [33], which has provided a substantial set of tools for understanding the characteristics of complex networks.
Reference [10] have pioneered the application of these ideas to supply networks (see also [8], [24]). From a theoretical per-spective, [41] discussed how the potentially scale-free structure of military supply networks could affect their vulnerability to disruptions. In spite of these efforts, research has been further constrained by the lack of empirical data sets. Such empirical maps of who supplies whom are almost entirely absent from the literature [31].
To date, there has been less than a handful of empirical works that study the structure of supply networks, and those that exist do not study the aerospace industry. [8] and [25] discussed what various network metrics meant in the context of supply net-works. Using network-based analysis, they successfully iden-tified structurally significant actors within the Honda, Acura, and Daimler Chrysler networks, consisting of 70 members. Reference [29] analyzed network “motifs” of 106 automotive firms in southern Italy, finding several triadic connections, and Keqianget al.(2008) examined the Guangzhou automotive in-dustry, consisting of 84 firms. Although these examples provide much-needed glimpses at supply network maps, their relatively small scale limits their usefulness for the development of theory.
In this paper, we aim at addressing two main gaps in the literature. First is that while researchers hint at a highly inter-connected global structure in the aerospace industry, this has not been validated from an empirical and structural standpoint. Second, in the study of supply chains, neither the extent nor the impact of system structure is known. To address these gaps, we set out to map an important part of the aerospace industry, re-vealing its structural dependencies and vulnerabilities. In doing so, we collect a large-scale data set that allows the application of network-science-based analysis to a substantial supply network. Scale allows us to find statistically significant macroscopic pat-terns in the network and deduce structural properties, providing the research community with an empirically based network science study.
III. DATA ANDMETHODS
The supply network data we have collected come from publicly available sources. To maximize our chances of iden-tifying clear patterns, we work with a supply network from the aerospace industry for which a large sample size is available. This industry choice allows us to use network data from a single database managed by an independent agency.1 This database
is comprehensive and offers consistency when compiling data. Within the aerospace industry, we focus on the network of
the Airbus Group. Given the large size of this company’s supply network, the corresponding data are sufficient to derive statistical analysis.
There are a few limitations of the data that need to be highlighted, as they determine the type of analysis that is possible. The links in the network signify that there is a supply relationship between the two nodes (i.e., firms). Hence, links are directional. We do not know what specific products are produced by the suppliers and which products are sup-plied to which specific buying firm. Hence, the whole supply network of Airbus is collected, rather than parts related to a particular plane model. A secondary check undertaken by researchers on the annual report of the focal firm has shown that > 90% of the firms listed on the Bloomberg database match the procurement relationships declared by the company. How-ever, the data are not exhaustive because the database contains only publicly listed firms. Furthermore, supply networks are dynamic constructs, changing frequently; thus, efforts to map them, such as the study we currently undertake, only represent a cross-sectional reality in time. Conclusions should be taken as suggestive rather than definitive given the lack of private firms and lack of knowledge on what proportion of the network is composed of them. Despite these shortcomings, the data set is the most comprehensive data set reported to date on aerospace supply networks, and analysis shows that statistically significant patterns can be identified.
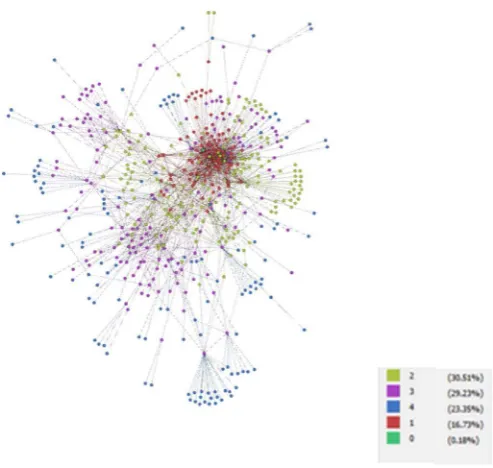
Data were downloaded from the database during October 2013 to January 2014, and secondary checks were made during March 2014. The initial search involved identifying all compa-nies that have a direct sales link to the focal company Airbus Group. We filtered production firms out of the data and left out service firms. Airbus Group is an OEM, and all its prime contractors and other downstream suppliers are captured as nodes. This search resulted in identification of Tier-1 suppliers. This then was followed by individual searches on each Tier-1 supplier, identifying each company’s suppliers, resulting in Tier 2. This process was continued recursively until the fourth tier was found. This recursive mode of querying ensures that all firms in the list are directly or indirectly connected to the focal company in the network. As every supplier obtains a unique identification, intertier linkages and suppliers links to multiple customers could be also identified. No further tiers were investigated as the third and fourth tiers included raw material suppliers and electronic parts upon inspection, which meant that the production process started from the fourth tier on average (see Section IV). Approximately four man months were spent to compile and validate the data. Our construction of the network includes 544 supplier firms and 1657 relationships among them. Fig. 1 displays the overall network constructed.
[image:4.595.303.550.78.312.2]Following data collection and validation, data analysis took place. Analysis is divided into three main parts: we first start by examining the overall structure of the network using mea-sures such as degree distribution, average shortest path lengths, clustering coefficients, density, communities, and assortativity. These measures present us with a macroscopic view of how the network is glued together and relates to cohesiveness and close-ness of firms, as well as pinpointing structural vulnerabilities. A fundamental question is whether the network is robust against
Fig. 1. Airbus supply network. Tiers have been color-coded.
node failures, that is, the disruption of a firm’s output in the network.
Where appropriate, we used random networks of the same scale for structural comparison [17]. Of course, a random network is likely to be a poor match with real supply chains. However, given that there is a lack of real-world empirical data in supply chain literature, it is not appropriate for us to speculate on alternative null models without having to resort to significant assumptions.
Next, we show how key network actors and their roles can be identified using network centrality measures, which help companies understand which firms act as network connectors, integrators, and mediators. If these firms are known, then focal company can make better informed decision in their dealings with them.
IV. NETWORKANALYSIS
A. Tier Structure
Fig. 2. Number and direction of relationships within and across tiers.
suppliers and do not have any control over their relationship choices. Given this emergent nature of supply chains, supply chain structures have been assumed rather than empirically analyzed, and these assumptions have been rarely challenged.
One of such assumptions is the “pyramid” shape that puts forward the idea of hierarchical supply chains, in which a company only interacts with its upstream suppliers [14]. These suppliers, in turn, repeat the same interaction pattern, resulting in a clear hierarchy, ensuring a span of control for each firm. The pyramid abstraction has been used to highlight dependen-cies that cause all firms in the chain to ultimately work for the final omnipresent assembler, whom everyone depends on for their survival [13], [14].
In the case of the Airbus network, however, no clear hier-archy exists (see Fig. 2). For example, firms on the first tier also supply to each other, in principle, making them Tier 2. Although, as we go down the tiers, intertier supply decreases. There are also backward supply links, going from the first tier firms to the second tier, creating loops. This structure confounds the idea of straightforward linear chains and hier-archical organization in supply chains and points us firmly in the direction of complex networks. Furthermore, the resulting web of interconnections is much denser than what would be in a hierarchical supply chain, possibly meaning better visibility of demand but also a higher risk of disruption cascades.
B. Clustering
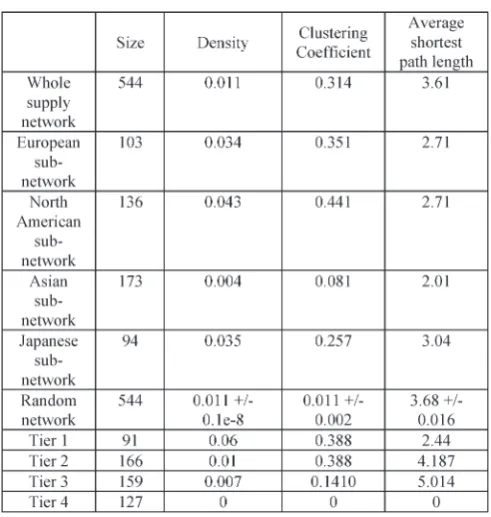
Another relevant measure is the clustering coefficient that quantifies the extent to which two random nodes with links between them are also connected through common third parties and is defined as the ratio of the number of existing links between a given node’s nearest neighbors and the maximum possible number of such links, averaged over all nodes in the network [35]. The clustering coefficient on our case is 0.314. Compared with a random network of the same size, the value is significantly higher (see Table I), which means that firms that buy and sell from each other also depend on each other indirectly, as they share supply links through tertiary firms they connect with.
One possible explanation of this high degree of intercon-nectedness would be that firms generally have high numbers
TABLE I
STRUCTURALMEASURES OFSUBNETWORKS
of customers and suppliers. However, the average number of customers per supplier (out degree) is only 3.05, whereas the average number of suppliers (in degree) is only 7.71, and the average number of relationships (degree) per firm is 5.92, which are all quite small numbers. For a more thorough investigation of network structure, we need to study the network degree distribution.
C. Degree Distribution
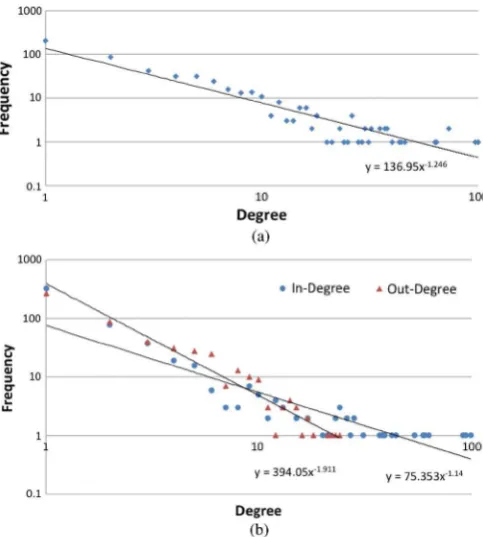
Fig. 3. (a) Total cumulative degree distribution. (b) Cumulative in- and out-degree distributions.
degree distribution is typically observed in networks generated by a tradeoff evolutionary process that involves nodes incurring costs for obtaining links [2]. Our study can neither refute nor reinforce the scale-free structure hypothesis, as the scale of data is not high enough. What is certain though is that the network carries a hub structure, and some firms connect to a significantly larger proportion of the network, whereas most other firms con-nect to these hubs only. Large-degree firms act as the concon-nectors of the network and provide cohesiveness. An implication of such a structure for network robustness is that the network will remain connected in the face of random disruptions as these will most likely affect those firms that connect to large hubs. If, on the other hand, large hub firms are disrupted, the overall network will most likely suffer, given that they are integral to the functioning of the network (Barabasi and Albert 1999). Of course, this is a structural consideration only, and in reality, a multitude of other variables such as inventory and disaster readiness need to be taken into account. We test this implication through a network failure study described as follows.
[image:6.595.42.284.80.349.2]The in and out degrees of all nodes are first calculated. Starting from the node with the highest in or out degree, nodes are successively removed in descending order of node degree. When a node is removed, its links are also removed from the network. In the case of random failures, a random node is removed from the network, and the random failure is repeated 100 times in order to obtain relevant confidence intervals. We then observe the size of the “largest connected component (LCC).” A component is composed of nodes that are directly or indirectly connected to each other. The LCC contains the highest number of nodes that are connected to each other. In our case, we start off with a completely connected network; hence, the size of the LCC is 1. The size of the LCC in each round is
Fig. 4. Changes in the size of the LCC during successive node deletion.
normalized by dividing by the size of the LCC in the original network.
Fig. 4 shows how the size of the LCC evolves under different failure types. The network rapidly disconnects when firms with large numbers of suppliers stop functioning, whereas connec-tivity is more stable and sustained under more numbers of failures. The pattern is similar when firms with large numbers of customers are targeted. Of course, it should be noted that, in the Airbus network, firms have large numbers of suppliers, but small numbers of customers, because the network under consideration does not contain customers outside the Airbus network. In other words, all customers of suppliers themselves are suppliers to the Airbus network. Nevertheless, counting the number of suppliers to suppliers appears to be a good proxy for estimating structural robustness. On average, it takes three firms to consecutively fail for the network to be disconnected, whereas the failures of hub firms disconnect the network immediately.
D. Communities
Next, we study how the structure is affected from geograph-ical and industrial connectivity, forming into substructures called communities. Fig. 5(a) shows the geographical distribu-tion of firms across tiers. Thirty-eight countries are involved in the supply network, the highest being from the U.S. (25%), Japan (23%), and China (19%), respectively. It is interesting that the top three do not include a European country; however, when taken together, European firms account for the majority of Tier-1 suppliers, followed by firms in North America. North America and Asia dominate Tier 2. Upon inspection, we have found that Japanese firms carry a different level of cohesiveness and dominate much of the automotive subnetwork to which Airbus is connected. For this reason, Japanese firms are sep-arated from the rest of the Asian firms for analysis in the rest of this paper. Japanese firms dominate Tier 3, whereas other Asian countries dominate Tier 4. The network is global, but there appears to be clear geographic bias on the different levels of tiers.
[image:6.595.300.550.81.230.2]Fig. 5. (a) Geographic distribution of firms by tier. (b) Sector distribution of firms by tier.
and Tier 2 and Tier 3 consist mostly of Electronics suppliers, followed closely by Automotive suppliers [see Fig. 5(b)]. The amount of automotive suppliers in the network is surprising and highlights how closely linked is the aerospace sector with the automotive industry. Companies like GKN and Mitsubishi Heavy Industries provide much of the interconnectivity as they produce both aerospace and automotive components. GKN produces airframes for Boeing and Airbus and drivelines for Toyota. During the Japanese earthquake in 2011, GKN’s shares rapidly fell as production in Japan was severely impacted, but recovered later due to improved production and sales in other divisions, including aerospace.
Raw materials suppliers are small in number and do not dominate any one tier, although they increase as we go down the tiers. The significance of the overrepresentation of firms from certain sectors and geographic areas in tiers has been checked using a two-tailed hypergeometric test. It appears that both a firm’s location and industrial sector identification define its structural location in a supply network.
To investigate further, we use the network density measure. The density of a network is a simple measure of overall network cohesiveness, with high-density networks containing multiple paths between any two firms. Density is measured by calculat-ing the number of links in a network as a fraction of the number of all possible links. When compared with random network, we observe that the density of the network is similar to random networks; however, the clustering coefficient is significantly higher. This means that the aerospace industry is not tightly connected, as there are many more possible links; however, those firms that do show high degrees of connection appear to connect to each other via third parties as well. The implication is that the network is divided into communities of firms that are intricately linked to one another. This also implies that a few firms act as the connectors between these communities, and their role is key to providing overall connectivity. We examine those firms in Section IV-E.
In addition, it is observed that density varies as we move from Tier 1 to Tier 4, among different locations and different industrial sectors (see Table I), hinting at the existence of substructures with different levels of cohesiveness. While the
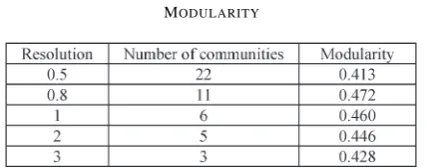
TABLE II MODULARITY
European, Asian, and North American firms connect within each of their subnetworks to a similar degree, Asian firms do not interconnect as much.
To examine substructures, we use community detection. Many networks carry communities, which refer to nodes that share links with each other than with the rest of the network. As such, communities are composed of nodes with dense internal and sparse external connections [42].
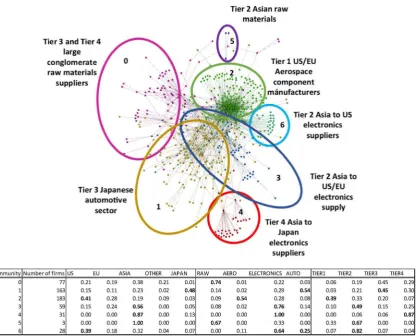
[image:7.595.326.540.303.387.2]Fig. 6. Communities and their properties in the Airbus network. Using a hypergeometric test, significantly overrepresented firm attributes in different communities are highlighted in bold script.p <0.05.
Taking a standard resolution value of 1, we find seven com-munities in the network detected by the algorithm given in [7]. Fig. 6 shows the communities found. Although the community detection algorithm does not have any industrial intelligence embedded within it, it is able to find logical patterns solely based on topological data. Of the seven communities detected, the first is a raw material exchange between the U.S., European, and Asian firms, taking place mostly in Tier 3. The second is the Japanese auto producers community composed of mostly Tier-3 firms. The third are the U.S.-based aerospace component manufacturers directly supplying to Airbus. The Fourth are second-tier Asian electronics manufacturers, whereas the fifth and the sixth are, once more, Asian electronic component manufacturers that make up the fourth and second tiers. The difference between the fourth and sixth communities is that the fourth community shares links with European auto and aerospace manufacturers directly. Finally, we observe a Tier-2 community that is mostly an interchange between U.S. and Asian Tier-2 electronics producers.
E. Assortativity
The next structural property we examine is called “network assortativity” [32]. Social networks have been observed to show “assortative mixing” on their degrees, which means that high-degree nodes have a tendency to connect to other high-high-degree nodes. The concept is important as something that affects a
single degree node could quickly cascade to other high-degree nodes. For example, in the field of epidemiology, an assortative network means that diseases will spread faster than disassortative networks, whereas in the latter type of network, targeting vaccinations to high-degree nodes, i.e., persons with a large social network, would be an effective strategy. Assortativ-ity also can hint at collaboration and competition. Contrasting musicians playing in bands and physicists writing collabora-tive articles, researchers found that disassortacollabora-tive mixing in the musicians network meant that popular musicians support newcomers, whereas in the physicist network, it meant rivalry prevented popular physicists from working together [32].
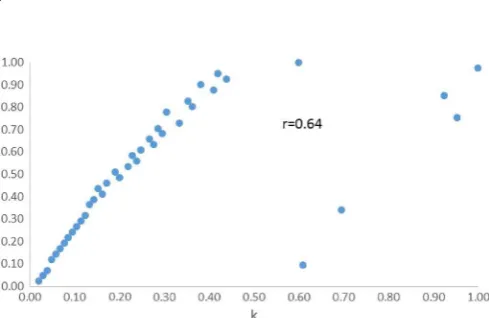
To characterize assortativity, we study the behavior of the average nearest neighbor’s degree of the firms of degree k, defined as
k
nn(k)≡
!
k′
k′P(k′|k)
where P(k′|k) is the conditional probability that a firm of degreekis connected to a firm of degreek′. Here,kincludes both suppliers and customers and, thus, considers all firms connected to the node in question. Fig. 7 shows that there is a clear increase ink
nn askgrows. The correlation betweenk
andk
nnis reasonably high, and thus, the Airbus supply network
Fig. 7. Average degree knn of nearest neighbors of nodes with degree k versusk.
of materials flow. Firms with high numbers of links could be leading their communities in certain areas of production and then connect to other high-degree firms doing the same thing, creating subassemblies that they pass on downstream. This dynamic would reflect the prime contractors buying subsystems from suppliers in aerospace. A social-network-based argument could be that large connector firms all have clearly segmented roles and collaborate together, keeping a cohesive structure. However, the structure also means that disruptions at any one of the nodes with high degrees could bring the whole network to a standstill quickly, as they will quickly cascade to other high-degree nodes, and affect both downstream customers waiting for goods and upstream suppliers waiting for orders.
F. Identification of Key Actors
In the previous section, we showed that the overall structure of the network is composed of hubs, to which most firms are connected. The network is vulnerable to disruptions on these hub firms but resistant to random disruptions. Furthermore, the network is composed of several subcommunities, the mem-bership of which is dictated by a firm’s tier, geography, and industrial sector. Given the assortative network structure, we hypothesized that certain firms will connect these communities, providing the glue that holds the network together. These firms will also act as bridges that transfer information and materials in the network. Here, we identify these key actors by using network centrality measures and discuss how they impact the network. While network-level measures such as average path lengths and density provide macroscopic views of how the over-all structure is organized, centrality measures provide a node-level view and examine how a certain node is embedded within a network, helping us identify firms with significant roles.
Degree centrality is a well-known measure that simply counts how many connections a node has. Network scientists corre-late increasing degree of a node with increased influence and popularity. One of the theoretical dynamics that give rise to scale-free networks is what is known as preferential attach-ment, a system in which nodes attach to other nodes with a probability proportional to the number of connections a node has(Barabasi and Albert 1999). Hence, high-degree nodes are also more likely to attract new connections, increasing their size exponentially. Reference [25] related the degree of a node in a supply network to “the extent with which a firm has an impact
on operational decisions or strategic behavior of other firms” and assert that degree central nodes should reconcile differences of members, coordinating the network. In- and out-degree centrality represent the extent to which a node has incoming and outgoing connections, respectively. In supply networks, these correspond to the number of suppliers and buyers a firm has. Nodes that have high in-degree centrality will be integrators that assemble components that go into a final product and are inte-gral to the architectural design of the product, whereas nodes with high out-degree centrality are concerned with distributing limited resources among several customers [25]. High in-degree centrality relates to a firm’s supply load, whereas high out-degree centrality relates to its demand load.
Conceptualized by Freeman (1977), betweenness centrality measures how often a node will sit on the paths that connect different nodes to each other in the network. Nodes with high betweenness centrality have been shown to control the flow of materials and communication in the network [25]. Conse-quently, they can control the speed with which information and material can be disseminated in the network and act as bottlenecks. Reference [25] related betweenness centrality to a firm’s operational criticality. It is important to point out that betweenness centrality counts shortest paths, whereas all paths are in use in a supply network as firms work toward a bill of materials. A more refined measure should include all paths; however, in this paper, we base our discussions on the conventional definition of this measure so that comparisons with other empirical work can be made by researchers.
Finally, closeness centrality provides a measure of how close a firm is to other firms in the network by counting the total geodesic distance between a node and all other nodes in the net-work. Reference [25] put forward the idea that firms with high closeness will benefit from short supply chains and suffer less from classical supply chain issues such as bullwhip effect, as well as gaining the ability to act independently, given its ability to access information in the network faster than other firms.
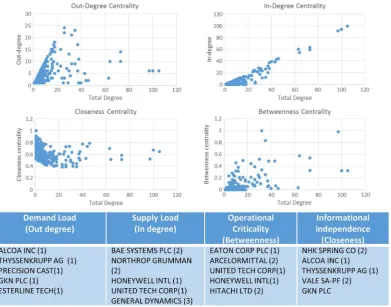
Fig. 8 shows the distributions of out-degree, in-degree, be-tweenness, and closeness centrality measures. Following [25]’s terminology, we relate these measures to demand and supply load, operational criticality, and informational dependence, re-spectively.
Fig. 8. Network centrality distributions and top five firms in each centrality measure. Firms that are repeated in different measures are italicized. Tiers are given in parentheses next to each firm.
Two firms with the highest supply loads also are opera-tionally critical. These are Honeywell Inc and United Tech-nologies Corporation They have many suppliers to coordinate and sit between many paths in the network, coordinating parts production. This is reflected by the large range of products they produce, from military and defense products, to medical equipment, fuel cells, to elevators. This of course means a diverse portfolio of suppliers to manage for integrating multiple parts into various products. These two companies have tertiary dealings with the other sector producers; thus, although their aerospace divisions supply directly to Airbus, they may be affecting the network through other divisions. Eaton Corpo-ration is the most opeCorpo-rationally critical company, whose port-folio reflects the three main industrial clusters in the network: electronics, automotive, and aerospace. Eaton is critical in the distribution of goods in the network, and any disruptions to it would affect the entire network.
NHK Spring has the highest closeness centrality and pro-duces automotive components. Although mainly a second-tier Japanese supplier from the perspective of Airbus, it is close to the rest of the network and has the ability to affect large portions of it through the automotive sector and is therefore critical. Any demand or supply misinformation to this company would have the effect of exasperating the demand and supply balance within the network. Without using network analysis, the critical position of NHK Spring in information distribution would be unknown to the focal company.
In addition to centrality measures, we examine compa-nies that serve as connectors between specific communities
identified in Section IV-C. LG Display from Korea connects the Asian electronics community 4, with the Japanese automotive producers community 1, whereas AU Optronics from the same community connects it to the multitier Asian electronics assem-blies community 3. Honeywell acts as a bridge between com-munities 6 (Asian electronics), 2 (aerospace manufacturers) and 3, essentially forwarding electronics components from Asia to Europe and U.S. manufacturers. Aluminum Corp-H from China leads a small cluster of Asian companies into the U.S./EU aerospace cluster. Three main companies, i.e., Arcelormittal France, Reliance Steel US, and Posco from South Korea are main bridges between raw materials suppliers and the aerospace manufacturing cluster. Several companies from automotive and aerospace sectors serve as connectors, as these produce for both sectors, including GKN PLC and Eaton Corporation.
V. CONCLUSION
With its powerful methodology for abstraction that allows the study of structural properties of systems, network science is becoming the lingua franca of a large array of scientific domains, from ecology to organizational networks. There are, however, very few empirical studies on the application of network science in supply networks, partly due to the difficulty in gathering data.
urged the discipline to not only investigate dyadic relationships but also search for an understanding of what lies beyond the dyad. In this paper, we contributed to these calls in a multitude of ways. First, we collected a large data set that allowed us to apply network-science-based analysis to the study of a supply network and demonstrated how a network-based abstraction can highlight structural properties that affect the functioning of the network. Second, the supply network of Airbus has been used as a case study, which allowed us to map an important part of the aerospace industry, revealing interesting insights.
Our study represents a novel and significant step in under-standing emergent supply network systems and interconnectiv-ity within and between industries. The first of our findings is that large-scale supply networks are complex systems and are not supported by simplistic hierarchical models, prevalent in the literature. Several same-tier suppliers supply to each other, and a significant proportion of the network contains intertier and reverse ties, possibly creating nonlinear dynamics. We ask researchers to model and examine how such complexity in system structure affects long-standing observations such as demand amplification.
Second, the network has been found to have a degree dis-tribution in which a large portion of the firms connect to hub firms. The network is also assortative, which means that hub firms tend to connect to other hub firms. Taken together, these two properties make the system robust to random disruptions, because random events will most likely affect nonhubs. However, the network is vulnerable to the failure of hub firms, as disruptions will rapidly cascade to the rest of the network, making it disconnected.
Third, we found that the aerospace network is grouped into community structures, emerging as a result of both geographic and sector-based influences. While Tier 1 is mostly composed of European and North American aerospace component man-ufacturers, Tier 2 has a large proportion of electronics manu-facturers. Tier 3 contains Japanese automotive manufacturers, whereas Tier 4 has Asian electronics components. Raw materials companies, while small in number, tend to supply to multiple tiers. Raw material firms might be particularly influential as they support multiple communities and are scarce. Key firms bridge these communities and play significant roles in coordination and resource allocation. Some firms were found to play important roles in the dissemination of information, although they are not from the aerospace sector. The inter-connectedness of the aerospace and automotive sectors is re-vealing in that disruptions from one industry may cascade to another.
A number of future research avenues are planned for ex-ploration. We used random networks for structural comparison because of a lack of empirical data on supply networks. As more data sets on supply network structures are gathered, it will be a necessary task for the scientific community to discuss appropriate null models for network-based studies of supply chains. More data sets and refined null models can further our understanding of whether the case study presented here is typical or carries structural characteristics that can be attributed to its economic, strategic, and operational settings. An important avenue of future research is studying the extent to
which volume/variety decisions, lean and agile strategies, and regulatory and environmental pressures interact with structure. Once an understanding is developed, guidelines could be drawn to align structure to organizational goals. The emergent nature of these structures means that design or control is only possible at the local neighborhood of the firm—hence, the firm either needs to realign the way it is embedded in the structure or design strategies to act with the wider network.
It also needs to be noted that our investigation has been a structural one, as we deliberately did not consider heteroge-neous attributes such as inventory, logistic distances between firms, and products that are being transferred, so that a system-level understanding could be developed. For example, a more accurate analysis of structural robustness would need inventory levels and lead times to be considered. The addition of these variables would need to be carefully traded off against the net-work size. Within the domain of netnet-work science, framenet-works from similar systems such as epidemiology or food webs can be inspirational for modeling. On the other hand, the problem of integrating networked intelligent behavior in this self-organized system can be considered from the lens of system-of-systems engineering [23].
Enriching the data with firm-level attributes, including pri-vate firms, and conducting longitudinal analysis could help further illuminate the findings. High-level product data would particularly be useful. For example, in our analysis, Tier-1 and Tier-2 firms dominate the list of critical firms, partly because lower tier companies have less intertier connections and remain at the periphery of the network. While structurally noncritical, it could be that these firms carry rare products. This was the case in the aftermath of the 2011 Japan earthquake when a pigment manufacturer located in Onahama was damaged by the tsunami, effecting coating manufacturers and, ultimately, many automotive producers. Such analysis can be made with examining the production network in conjunction with the supply network.
Another way of enriching the analysis could include assign-ing weights to links between firms, which may be in the form of percentage turnover paid by client to supplier, frequency of interactions, or length of relationships, depending on the analysis being carried out. This would help deduce significant relationships, identify the core network actors, and make more in-depth analysis possible on a smaller set of firms.
REFERENCES
[1] R. Albert, H. Jeong, and A. L. Barabasi, “Internet: Diameter of the world-wide web,”Nature, vol. 401, no. 6749, pp. 130–131, Sep. 1999. [2] L. A. N. Amaral, A. Scala, M. Barthelemy, and H. E. Stanley, “Classes
of small-world networks,”Proc. Nat. Acad. Sci. USA, vol. 97, no. 21, pp. 11149–11152, 2000.
[3] F. Amesse, L. Dragoste, J. Nollet, and S. Ponce, “Issues on partnering: Evidences from subcontracting in aeronautics,”Technovation, vol. 21, no. 9, pp. 559–569, Sep. 2001.
[4] R. R. Bales, R. S. Maull, and Z. Radnor, “The development of supply chain management within the aerospace manufacturing sector,”Supply Chain Manag., Int. J., vol. 9, no. 3, pp. 250–255, 2004.
[5] A. Barabasi and R. Albert, “Emergence of scaling in random networks,”
Science, vol. 286, no. 5439, pp. 509–512, Oct. 1999.
[7] V. D. Blondel, J. Guillaume, R. Lambiotte, and E. Lefebvre, “Fast unfold-ing of communities in large networks,”J. Statist. Mech. , Theory Exp., vol. 2008, no. 10, 2008, Art. ID. P10008.
[8] S. P. Borgatti and X. Li, “On network analysis in a supply chain context,” Supply Chain. Manag., vol. 45, no. 2, pp. 5–21, 2009.
[9] A. Brintrup, T. Kito, S. New, and F. Reed-Tsochas, “From transaction cost economics to food webs: A multidisciplinary discussion on the length of supply chains,” inProc. 18th EurOMA Conf., Cambridge, U.K., Jul. 3–6, 2011.
[10] T. Y. Choi, K. J. Dooley, and M. Rungtusanatham, “Supply networks and complex adaptive systems: Control versus emergence,”J. Oper. Manag., vol. 19, no. 3, pp. 351–366, May 2001.
[11] T. M. Choi, “Coordination and risk analysis of VMI supply chains with RFID technology,”IEEE Trans. Ind. Informat., vol. 7, no. 3, pp. 497–504, Aug. 2011.
[12] M. Christopher, Logistics and Supply Chain Management: Strategies for Reducing Costs and Improving Services. London, U.K.: Financial Times, ch. 1, 1992.
[13] K. B. Clark and T. Fujimoto, Product Development Performance: Strategy, Organization, and Management in the World Auto Industry. Watertown, MA, USA: Harvard Business Press, 1991.
[14] M. A. Cusumano and A. Takeishi, “Supplier relations and management: A survey of Japanese, Japanese transplant, and U.S. auto plants,”Strategic Manag. J, vol. 12, no. 8, pp. 563–588, Nov. 1991.
[15] A. F. De Toni and G. Nassimbeni, “Supply networks: Genesis, stability and logistics implications, a comparative analysis of two districts,” Omega Int. J. Manag. Sci., vol. 23, no. 4, pp. 403–418, Aug. 1995.
[16] G. Easton and B. Axelsson, Industrial Networks: A New View of Reality. New York, NY, USA: Routledge, 1992.
[17] P. Erdos and A. Renyi, “On the evolution of random graphs,”Publications Math. Inst. Hungarian Acad. Sci., vol. 5, pp. 17–61, 1960.
[18] J. W. Forrester, Industrial Dynamics Systems Dynamics Series. Portland, OR, USA: MIT Press, 1961.
[19] L. C. Freeman, “Centrality in social networks conceptual clarification,”
Social Netw., vol. 1, no. 3, pp. 215–239, 1977.
[20] M. Girvan and M. E. J. Newman, “Community structure in social and biological networks,”Proc. Nat. Acad. Sci. USA, vol. 99, no. 11, pp. 7821–7826, 2002.
[21] E. J. S. Hearnshaw and M. J. Wilson, A complex network approach to supply chain network theory,”Int. J. Oper. Prod. Manag., vol. 33, no. 4, pp. 442–469, 2013.
[22] C. A. Hidalgo, B. Klinger, A. L. Barabasi, and R. Hausmann, “The product space conditions the development of nations,”Sciencevol. 317, pp. 482–487, Jul. 2007.
[23] M. Jamshidi, “ System of systems engineering—New challenges for the 21st century,”IEEE Aerosp. Electron. Syst. Mag., vol. 23, no. 5, pp. 4–19, May 2008.
[24] A. K. Kahkonen and V. M. Virolainen, “ Sources of structural power in the context of value nets,”J. Purchasing Supply Manag., vol. 17, no. 2, pp. 109–120, 2011.
[25] Y. Kim, T. Y. Choi, T. Yan, and K. Dooley, “ Structural investigation of supply networks: A social network analysis approach,”J. Oper. Manag., vol. 29, no. 3, pp. 194–211, Mar. 2011.
[26] L. A. Meyers, M. J. E. Newman, and B. Pourbohloul, “ Predicting epi-demics on directed contact networks,”J. Theoretical Biol., vol. 240, no. 3 pp. 400–418, Jun. 2006.
[27] R. C. Lamming, “Japanese supply chain relationships in recession,”Long Range Planning, vol. 33, no. 6, pp. 757–778, 2000.
[28] S. G. Lazzarini, F. R. Chaddad, and M. L. Cook, “Integrating supply chain and network analyses: The study of netchains,”J. Chain Netw. Sci., vol. 1, no. 1, pp. 7–22, 2001.
[29] A. Lomi and P. Pattison, “Manufacturing relations: An empirical study of the organization of production across multiple networks,”Org. Sci., vol. 17, no. 3, pp. 313–332, May/Jun. 2006.
[30] M. Mitchell, “Complex systems: Network thinking,” Artif. Intell., vol. 170, no. 18, pp. 1194–1212, Dec. 2006.
[31] S. New, Supply Chains: Construction and Legitimation. In: Understand-ing Supply Chains: Concepts, Critiques, and Futures. Oxford, U.K.: Oxford Univ. Press, 2004.
[32] M. E. J. Newman, “Assortative mixing in networks,” Phys. Rev. Lett., vol. 89, no. 20, 2002, Art. ID. 208701.
[33] M. E. J. Newman, Networks: An Introduction. Oxford, U.K.: Oxford Univ. Press, 2010.
[34] M. E. J. Newman, “Modularity and community structure in networks,”
Proc. Nat. Acad. Sci. USA, vol. 103, no. 23, p. 8577–8582, 2006.
[35] M. E. J. Newman, “Mathematics of networks,” inThe New Palgrave Encyclopedia of Economics. Basingstoke, U.K.: Palgrave Macmillan, 2007.
[36] R. F. Olsen and L. M. Ellram, “Buyer–supplier relationships: Alternate research approaches,”Eur. J. Purchasing Supply Manag.vol. 3, no. 4, pp. 221–231, Dec. 1997.
[37] J. P. Onnelaet al., “Structure and tie strengths in mobile communica-tion networks,”Proc. Nat. Acad. Sci., vol. 104, no. 18, pp. 7332–7336, 2007.
[38] S. Ressler, “Social network analysis as an approach to combat terrorism: Past, present, and future research,”Homeland Security Affairs, vol. 2, no. 2, pp. 1–10, Jul. 2006.
[39] D. J. Smith and D. Tranfield, “Talented suppliers? Strategic change and innovation in the UK aerospace industry,”R&D Manag.vol. 35, no. 1, pp. 37–49, 2005.
[40] Z. Tang, M. Goetschalckx, and L. McGinnis, “Modeling-based design of strategic supply chain networks for aircraft manufacturing,”Procedia Comput. Sci., vol. 16, pp. 611–620, 2013.
[41] H. P. Thadakamaila, U. N. Raghavan, S. Kumara, and R. Albert, “Surviv-ability of multiagent-based supply networks: A topological perspective,”
IEEE Intell. Syst.vol. 19, no. 5, pp. 24–31, Sep./Oct. 2004.
[42] R. Toivonenet al., “The role of edge weights in social networks: Mod-elling structure and dynamics,” inProc. SPIE, 2007, vol. 6601, pp. 1–8. [43] J. Verbeek, “A systems engineering approach for development of
aerospace production systems,” presented at the SAE Technical Papers, Warrendale, PA, USA, vol. 7, 2013.
[44] D. J. Watts, “The ‘new’ science of networks,”Annu. Rev. Sociol., vol. 30, pp. 243–270, Mar. 2004.
[45] T. Williams, R. Maull, and B. Ellis, “Demand chain management the-ory: Constraints and development from global aerospace supply webs,”
J. Oper. Manag., vol. 20, no. 6, pp. 691–706, Nov. 2002.
[46] T. Y. Choi and Z. Wu, “Taking the leap from dyads to triads: Buyer–supplier relationships in supply networks,”J. Purchasing Supply Manag., vol. 15, no. 4, pp. 263–266, Dec. 2009.
[47] C. Wycisk, B. McKelvey, and M. Hulsmann, “Smart parts” supply net-works as complex adaptive systems: Analysis and implications,”Int. J. Phys. Distrib. Logist. Manag., vol. 38, no. 2, pp. 108–125, 2008. [48] X. Zhang, J. Wu, Y. Tan, H. Deng, and Y. Li, “Structural robustness of
weighted complex networks based on natural connectivity,”Chin. Phys. Lett., vol. 30, no. 10, Oct. 2013, Art. ID. 108901.
[49] K. Zhao, “Analyzing the resilience of complex supply network topologies against random and targeted disruptions,”IEEE Syst. J.vol. 5, no. 1, pp. 28–39, Mar. 2011.
[50] C. Rebolledo and J. Nollet, “Learning from suppliers in the aerospace industry,”Int. J. Prod. Econ., vol. 129, no. 2, pp. 328–337, Feb. 2011. [51] C. Rose-Anderssen et al., “A cladistic classification of commercial
aerospace supply chain evolution,”J. Manuf. Technol. Manag., vol. 20, no. 2, pp. 235–257, 2009.
[52] J. P. Onnela and F. Reed-Tsochas, “Spontaneous emergence of social influence in online systems,”Proc. Nat. Acad. Sci., vol. 107, no. 43, pp. 18 375–18 375, 2010.
[53] W. Keqiang, Z. Zhaofeng, and S. Dongchuan, “Structure analysis of sup-ply chain networks based on complex network theory,” inProc. 4th Int. Conf. Semantics, Knowl. Grid, Washington, DC, USA, IEEE Computer Society, Dec. 2008 pp. 493–494.
Alexandra Brintrupreceived the Ph.D. degree from Cranfield University, Cranfield, U.K.
Yu Wangreceived the MRes degree from Cranfield University, Cranfield, U.K., in 2014. He is currently an Aerospace Engineer with the Commercial Aircraft Corporation of China, Ltd., Shanghai, China. His main research interests are in aerospace supply chains and network-science-based analysis of procurement systems.
Ashutosh Tiwarireceived the M.Sc. and Ph.D. de-grees from Cranfield University, Cranfield, U.K.