White Rose Research Online URL for this paper:
http://eprints.whiterose.ac.uk/134022/
Version: Published Version
Article:
Kernbach, Julius M, Satterthwaite, Theodore D, Bassett, Danielle S et al. (8 more authors)
(2018) Shared endo-phenotypes of default mode dsfunction in attention
deficit/hyperactivity disorder and autism spectrum disorder. Translational psychiatry. 133.
ISSN 2158-3188
https://doi.org/10.1038/s41398-018-0179-6
[email protected] https://eprints.whiterose.ac.uk/ Reuse
This article is distributed under the terms of the Creative Commons Attribution (CC BY) licence. This licence allows you to distribute, remix, tweak, and build upon the work, even commercially, as long as you credit the authors for the original work. More information and the full terms of the licence here:
https://creativecommons.org/licenses/
Takedown
If you consider content in White Rose Research Online to be in breach of UK law, please notify us by
A R T I C L E
O p e n A c c e s s
Shared endo-phenotypes of default mode
dysfunction in attention de
fi
cit/
hyperactivity disorder and autism spectrum
disorder
Julius M. Kernbach
1, Theodore D. Satterthwaite
2, Danielle S. Bassett
3,4, Jonathan Smallwood
5, Daniel Margulies
6,
Sarah Krall
1, Philip Shaw
7, Gaël Varoquaux
8, Bertrand Thirion
8, Kerstin Konrad
9,10,11and Danilo Bzdok
1,8,9Abstract
Categorical diagnoses from the Diagnostic and Statistical Manual of Mental Disorders (DSM) or International Classification of Diseases (ICD) manuals are increasingly found to be incongruent with emerging neuroscientific evidence that points towards shared neurobiological dysfunction underlying attention deficit/hyperactivity disorder and autism spectrum disorder. Using resting-state functional magnetic resonance imaging data, functional
connectivity of the default mode network, the dorsal attention and salience network was studied in 1305 typically developing and diagnosed participants. A transdiagnostic hierarchical Bayesian modeling framework combining
Indian Buffet ProcessesandLatent Dirichlet Allocationwas proposed to address the urgent need for objective brain-derived measures that can acknowledge shared brain network dysfunction in both disorders. We identified three main variation factors characterized by distinct coupling patterns of the temporoparietal cortices in the default mode network with the dorsal attention and salience network. The brain-derived factors were demonstrated to effectively capture the underlying neural dysfunction shared in both disorders more accurately, and to enable more reliable diagnoses of neurobiological dysfunction. The brain-derived phenotypes alone allowed for a classification accuracy reflecting an underlying neuropathology of 67.33% (+/−3.07) in new individuals, which significantly outperformed the
46.73% (+/−3.97) accuracy of categorical diagnoses. Our results provide initial evidence that shared neural
dysfunction in ADHD and ASD can be derived from conventional brain recordings in a data-led fashion. Our work is encouraging to pursue a translational endeavor tofind and further study brain-derived phenotypes, which could potentially be used to improve clinical decision-making and optimize treatment in the future.
Introduction
Attention deficit/hyperactivity disorder (ADHD) and
autism spectrum disorder (ASD) are both disabling and heritable neurodevelopmental disorders that manifest early in life and have documented consequences for
well-being. Both disorders are associated with high levels of family dysfunction, social interaction problems, academic failure, and unemployment and thus constitute a significant
burden for children, their families, and society as a whole1–3. ADHD is characterized by developmentally inap-propriate levels of inattention, impulsivity, and hyper-activity. In contrast, ASD is defined by core symptoms of
persistent and pervasive deficits in social communication
and interaction along with repetitive behavioral patterns and restricted interests or activities. However, these see-mingly disparate disorders have clinical overlap4: 30–80%
© The Author(s) 2018
Open AccessThis article is licensed under a Creative Commons Attribution 4.0 International License, which permits use, sharing, adaptation, distribution and reproduction in any medium or format, as long as you give appropriate credit to the original author(s) and the source, provide a link to the Creative Commons license, and indicate if changes were made. The images or other third party material in this article are included in the article’s Creative Commons license, unless indicated otherwise in a credit line to the material. If material is not included in the article’s Creative Commons license and your intended use is not permitted by statutory regulation or exceeds the permitted use, you will need to obtain permission directly from the copyright holder. To view a copy of this license, visithttp://creativecommons.org/licenses/by/4.0/.
Correspondence: Danilo Bzdok ([email protected])
1Department of Psychiatry, Psychotherapy and Psychosomatics, RWTH Aachen
University, 52072 Aachen, Germany
2Department of Psychiatry, University of Pennsylvania, Perelman School of
Medicine, Philadelphia, PA 19104, USA
Full list of author information is available at the end of the article. These authors contributed equally: Kerstin Konrad, Danilo Bzdok
1234567890()
:,;
1234567890(
):,;
1234567890()
:,;
1234567890(
of all ASD children meet the diagnostic criteria for ADHD and, conversely, 20–50% of children diagnosed with ADHD also meet the diagnostic criteria for ASD. Both disorders also show similar associated clinical features, including poor social skills, language delay, oppositional defiant behavior, and difficulty with attention and
emo-tion regulaemo-tion4,5. This begs the question whether despite superficial differences in clinical presentation both ADHD
and ASD share a fundamental mechanism of dysfunction. Consistent with the hypothesis that both ASD and ADHD depend in part on shared underlying dysfunction, genetic and twin studies show familial associations for both disorders6,7. Twin studies suggested that 50–72% of phenotypic features are shared by these disorders, poten-tially reflecting genetic factors common to both ADHD
and ASD8,9. Additionally, genome-wide association studies as well as linkage and candidate gene studies identified a
number of genetic risk variants common to both dis-orders10. At the neuropsychological level, there are several domains in which both ASD and ADHD have a pattern of common deficits. These include executive function11,
emotion recognition12, affective feedback processing13, as well as sustained attention, and sensory functioning14,15.
Independent functional magnetic resonance imaging (fMRI) experiments in ADHD or ASD patients have revealed a substantial role of aberrant connectivity in large-scale networks in both disorders (for reviews see refs.16,17). Prior evidence has emphasized the importance of the default mode network (DMN) and attention-related macroscopical network as a key to both ADHD and ASD dysfunction18–20. In a seminal cross-diagnostic neuroi-maging study, Di Martino et al.20 examined network centrality metrics in ADHD and ASD patients. Abnorm-alities were identified in cortical and subcortical areas,
some of which were common to both disorders, including the posteromedial cortex. In contrast, some aberrations, such as limbic areas in the bilateral medial temporal lobe, were more closely related to ASD. Moreover, it has been suggested that the salience network (SN) is intimately related to the interplay between the DMN and DAN21, and aberrant coupling patterns between the SN, DMN, and DAN have been reported in both ASD18,22and ADHD23,24. The collection of genetic, neuropsychological, and neuroimaging evidence emphasizes the need to under-stand the common patterns of neural dysfunction that link ADHD and ASD. Both disorders may be best understood from a dimensional point of view with patients who suffer from either disorder located at distant points on a symptom continuum8. This intuition is advertised by the Research Domain Criteria (RDoC) initiative of the National Institute of Mental Health25 proposed as an alternative research framework to inves-tigate psychopathological disorders, including ADHD and ASD. Within this framework, mixed dimensional
abnormalities of brain circuits are conceptualized as an underlying dysfunction that can contribute to clinically diverging mental disorders to varying degrees26,27. In the present study, we tested a dimensional view of ADHD and ASD combining resting-state brain connectivity and emerging tools from the machine learning domain. In a transdiagnostic fashion, we hypothesized that brain var-iation in large-scale network connectivity in the DMN, DAN, and SN can be used to identify shared fundamental network dysfunction in both disorders.
Methods
Data resources and preprocessing
Already preprocessed neuroimaging data were obtained from two large, publicly available datasets: ADHD-200 (http://fcon_1000.projects.nitrc.org/indi/adhd200/) and ABIDE (Autism Brain Imaging Data Exchange; http:// fcon_1000.projects.nitrc.org/indi/abide/). All data were anonymized, and collected with the approval of the respective ethics boards. Experienced psychiatrists per-formed patient diagnoses. The ADHD-200 data set pro-vides demographic and clinical information, including age, sex, and measures of symptom severity as assessed by the ADHD rating scale (ADHD-RS). The ABIDE data provide subject information, including age, sex, and measures of symptom severity as assessed by the Autism Diagnostic Observation Schedule (ADOS). Both con-sidered data repositories were preprocessed using the NeuroImaging Analysis Kit (NIAK, http://preprocessed-connectomes-project.org, for in-depth description see refs.28,29). Particular care has been devoted to help miti-gate motion artefacts: Scrubbing30 was used to remove volumes with excessive motion. Rigid-body motion was then estimated within and between runs. The first
prin-cipal component accounting for 95% of the variance of the six rigid-body motion parameters, as well as their squares was regressed out in nuisance removal. The available pipeline was additionally modified using a standard
removal of linear effects with site as a regressor of no interest to control for certain acquisition-related effects.
To help minimize confounding factors, inclusion was restricted to children and adolescents who were male and between 7 to 21 years of age to study the neural mechanism of both disorders during development. Diag-nosed and typically developing (TD) participants were age-matched in each dataset (see Table1for details). This was motivated by previous evidence showing that ASD affects the brains of children and adults differently31. Further, we included only male participants because (i) both disorders are more prevalent in males32,33, and (ii) to exclude gender-specific differences in brain
repository were eligible. This amounted to a total ofn=
1305 participants.
Target network definition
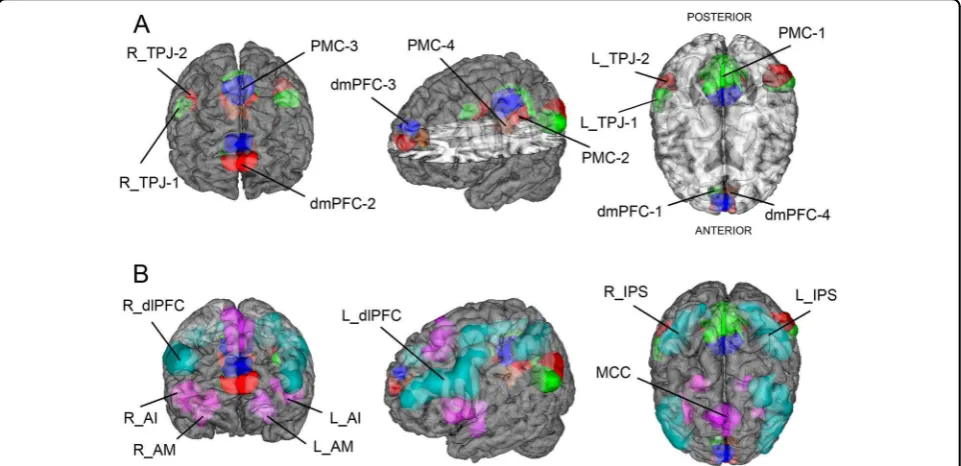
For each participant, the preprocessed resting-state con-nectivity was summarized in network-coupling statistics. We examined several subregionswithineach of the four DMN nodes (Fig.1a) as used in a recent computational psychiatry study (see ref.[36; available for re-use athttp://neurovault.org/
collections/2216/): four subregions in the dorsomedial pre-frontal cortex (dmPFC), four subregions in the posteromedial cingulate cortex (PMC), and two subregions in the right and left temporoparietal junction (TPJ) were drawn from a recently completed quantitative meta-analytical atlas of the DMN derived by connectivity-based parcellation37–40. The DMN nodes were supplemented by coordinate-based meta-analyses of closely interacting multi-modal networks (Fig.
[image:4.595.56.540.103.275.2]1b): the salience network, composed of the anterior insula
Table 1 Sample details
ADHD-200 (n=587) ADHD TD p-value (t-test) ABIDE (n=718) ASD TD p-value (t-test)
n 284 303 n 369 349
Age 11.99 11.89 >0.99 age 13.53 13,54 >0.99
ADHD subtypes ASD subtypes
Inattentive (%) 35.00 0.00 Autism (%) 75.00 0,00
Hyperactive/ Impulsive (%) 4.00 0.00 Asperger (%) 18.00 0,00
Combined (&) 61.00 0,.0 PDD-NOS (%) 7.00 0,00
ADHD symptom severity 62.00 38.00 <0.001 ADOS total 12.00
Inattention 55.00 33.00 <0.001 ADOS communication 4.00
Hyperactivity/Impulsivity 52.00 32.00 <0.001 ADOS social interaction 8.00
ADOS stereotyped behaviors 3.00
Fig. 1 Target network definitions.The regions of interest (ROIs) used for all present analyses are rendered on the MNI standard brain with frontal, diagonal, and top views.aThe four main default mode network (DMN) nodes are subdivided into 12 ROIs reflecting distinct subregions (dmPFC1–4, PMC1–4, left and right TPJ1–2)37–40.bThe DMN subregions are supplemented by nine ROIs for the dorsal attention network (DAN) and salience
[image:4.595.58.539.304.537.2](AI), midcingulate cortex (MCC), and amygdala (AM)41; and the dorsal attention network (DAN), composed of the dor-solateral prefrontal cortex (dlPFC) and intraparietal sulcus (IPS)42. This approach yielded a total of 21 nodes with 210 edges capturing functional network coupling between all possible connectivity pairs. The fMRI signal was summarized by an average time-series for each node, standardized by zero-meaning and unit-variance scaling, and detrended. Pearson’s correlations were then computed between each possible pair of the network nodes. In this way, we effectively reduced each individual’s resting-state whole-brain informa-tion to an interpretable set of connectivity variables. In sum, the set of coupling measures reflects each subject’s specific
connectivity profile—analogous to a fingerprint of brain
network connectivity. Constructing analogous connectivity variables from networks in the Yeo atlas43—without DMN, DAN, and SN—yielded only 52.65% accuracy in the autism-health distinction and 56.06% accuracy in the ADHD sample (100 cross-validation folds, 90% train, and 10% test set, linear support vector machine (SVM)).
Statistical analysis
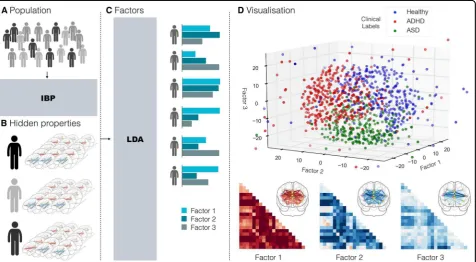
In this study, we devised an innovative hierarchical Bayesian modeling strategy (Fig.2) to address the urgent need for objective brain-derived measures that can acknowledge shared dysfunction leading to different brain disturbances across disorders, including ADHD and ASD. The applied transdiagnostic framework is able to reflect
the premise that different underlying pathophysiological mechanisms contribute to mental disorders to varying degrees26,27. In the following, we will now describe step-by-step what key advantages the applied framework offers.
Identification of underlying disease dimension
In afirst step, we wanted to identify the hidden
compo-nents of disease variability underlying the connectivity
pro-files. The challenges implicated are to do so in a data-led
fashion, imposing minimal constraints (such as selecting a pre-specified number of components), and to allow for the
contribution of multiple shared components at the same time. In an early application in neuroimaging, we used
Indian Buffet Processes(IBP)44to allow for the derivation of therelativecontributions of hidden properties in the con-nectivity profiles across all participants. Rather than
extracting a pre-specified number of components, as
com-monly used in principal or independent component analysis, IBP enables formal inference on the number of unknown components. This non-parametric model hence auto-matically determines the number of underlying components
flexibly adapted to the richness of the available directional
functional-connectivity data. Additionally, IBP does not perform hard assignments; instead it associates hidden properties to patterns of continuous variation in particular node–node couplings rather than to binary differences.
Hierarchical Bayesian modeling
The identified hidden properties in functional network
coupling then provided the basis for drawing inference of coherent group-overarching structure (i.e., factors) by means of Bayesian hierarchical modeling. Using Latent Dirichlet Allocation (LDA)45 we imposed a hierarchy of pre-specified k number of factors onto the connectivity fingerprints based on their association with the hidden
properties. In previous research, LDA was successfully applied after engineering structural brain data into posi-tive integers46. But LDA alone is not suited to handling
negative-valued, non-discrete input, such as connectivity strengths. Here, the realized combination of IBP and LDA modeling naturally suggests itself because IBP can seam-lessly transform the continuous information encoded in the individual connectional fingerprints into discrete,
positive-valued vectors indicating the assignment to the underlying hidden properties. For ease of interpretation, LDA then reduced the obtained set of assignments to hidden properties into a small set of overarching con-nectivity archetypes (i.e., factors). A key advantage of combining IBP and LDA is that it enables us to derive hidden sources of variation with mixed memberships. This avoids the necessity of assigning a connectional
fingerprint of a participant to only one factor. Instead,
each particular individual’s connectionalfingerprint could
hence be modeled as being generated by k factors (i.e., endo-phenotypes)simultaneously.
Deriving biological labels from the neuroimaging-derived phenotypes
We generated an unbiased set of new labels indicating an assignment to a ‘neurobiological group’ based on the dimensional factors constituting the brain phenotypes for all individuals. To avoid circularity, we translated a sta-tistical modeling scheme, called pre-validation47, to the neuroimaging domain. As a variant of cross-validation, pre-validation was applied to obtain a fairer evaluation of the group labels48. While cross-validation yields reason-ably unbiased estimates of the model’s expected error rate in other observations, pre-validation produces a new set of unbiased data or labels that mimic the model perfor-mance in later recruited subjects labeled as patients and controls49. These authors emphasize that the key feature of pre-validation is that each label is derived from the entire data set and independently of its response value. Therefore, each label can be treated as if it was derived from a data set completely separate from the test-data. The biological group labels hence are statistically inde-pendent from the information encoded in the connec-tional fingerprints48–51, and act as if they were derived
from separate data.
set. The biological labels for all individuals in a givenm-th data split were generated by fitting an LDA model on
combined brain data from the nine remaining data splits and used to infer factor weights for all observations of the
m-th data split. In each m-th data split, pre-validated biological labels were hence estimated by LDA (i.e., the
“internal model”) without access to any actual clinical labels (TD versus ADHD versus ASD) or any brain data from the held-out m-th data split. This procedure gen-erated a new set of labels that was then used to evaluate the out-of-sample prediction of the groups based on a linear classification algorithm (whereas classical
cross-validation directly selects models and evaluates their prediction performance). The biological labels were tested for diagnostic relevance based on linear SVMs (i.e., the
“external model”) by training on each combination ofm
−1 training data splits and testing on the respective remaining test-data split.
Results
A hierarchical Bayesian approach was used to identify distinct patterns of DMN coupling with other large-scale
brain networks. These functional network patterns were consistently expressed in each of the 1305 TD, ADHD, and ASD individuals from two multisite repositories (i.e., ADHD-200 and ABIDE). The applied transdiagnostic modeling strategy reflects the premise that different
bio-logical phenotypes contribute to clinically diverging mental disorders to varying degrees26,27. After automatic extraction of distinct variability components in DMN coupling (i.e., hidden properties), we inferred a hierarchy of sources of variation (i.e., factors) that compile the variability in network connectivity of the DMN in TD and diagnosed participants.
The hidden properties of disease variability underlying the connectivity profiles were identified in a data-driven
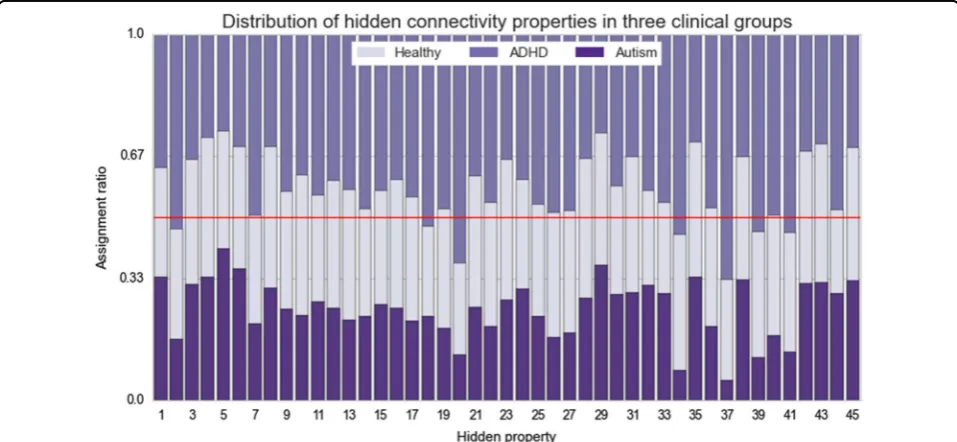
fashion across all participants without knowing to which clinical group (TD, ADHD, or ASD) they belonged to. The applied non-parametric model automatically deter-mined45 hidden propertiesas thenumber of components
adapted to the complexity of the underlying the available data. We then investigate whether distinct disorder-specific clusters would emerge. However, while every
[image:6.595.62.539.88.350.2]hidden property was observed to be present to different
extents in each diagnostic group, no property was found to be uniquely associated with only one group (Fig. 3). Together this provides initial evidence that different bio-logical phenotypes are partly shared among individuals and contribute to the clinical presentation of ADHD and ASD to varying degrees.
To aid interpretability, we then used Bayesian inference to reduce the obtained set of hidden properties into a smaller set of overarching patterns by imposing a latent hierarchy ofkfactors. In thek=2 solution, the underlying factors were only related in opposite directions and were hence not able to capture subtle effects in overall network coupling. In wanting to choose the lowest yet most informative number of hidden factors, we favored a solution with k=3 factors. Hypothetically, if the three clinical groups were to be neurobiologically consistent, three learned LDA components would suffice to describe
the underlying dysfunctional pattern. For instance, LDA factor 1 could be related to healthy subjects, LDA factor 2 to ADHD, and factor 3 to ASD. However, following the shared hidden properties, we found that the three factors did not align in a one-on-one fashion with the clinical groups (cf. Fig.1d). Consistent with our hypothesis, the shared influence of three connectivity factors was
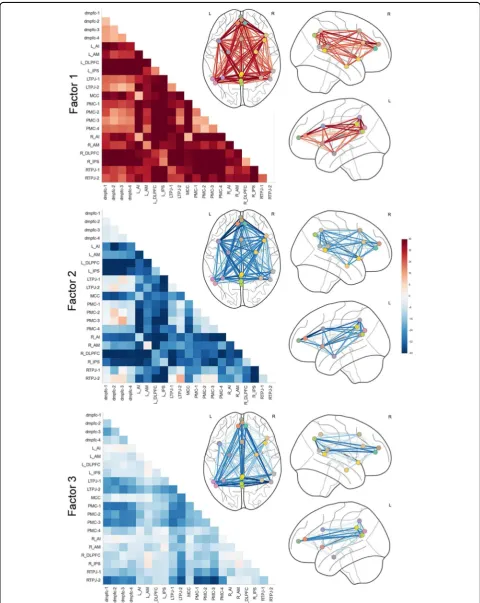
asso-ciated with aspects of both ASD and ADHD. The iden-tified factors yielded the following coupling weights (Fig. 4): Factor 1 showed high DMN-DAN, medium DMN-SN, and low intra-DMN coupling weights, while factor 2
exhibited positive weights for connections between DMN subregions, most pronounced for the right and left pos-terior TPJ, and between the right and left AM. The highest negative weights of factor 2 were observed for connections between the dmPFC subregions and the right and left dlPFC, closely followed by the right and left IPS. Factor 3 exhibited subtle effects for connections between DMN subregions. The connections between the right posterior TPJ and the PMC, and between the right and left posterior TPJs showed particularly high negative weights. In sum, each of the biological three factors reflected a coherent pattern of resting-state connectivity
between the DMN, DAN, and SN. Capitalizing on the mixed memberships approach of our framework, each individual’s resting-state network connectivity could hence be expressed as a flexible recombination of only
these three factors.
Clinical associations of the biological phenotypes
[image:7.595.58.537.88.309.2]We then examined the subject-by-subject expression of the imaging-derived endo-phenotypes (i.e., factors 1–3) in regard to the clinical questionnaires and assessments available from the ADHD-200 and ABIDE repositories. The subject-by-subject expression of factor 1 showed the highest positive associations with ADHD symptom mea-sures, including the level of inattention (r=0.26, p< 0.001) and hyperactivity/impulsivity (r=0.24, p< 0.001), as well as a negative association with performance, verbal,
and total IQ scores (r=−0.13/−0.15/−0.13, each p< 0.05). In contrast, factor 2 showed the highest associations with ASD diagnosis (r=0.15, p< 0.05), and positive associations with verbal and total IQ (r=0.21/0.14,p< 0.001/0.05), as well as negative associations with ADHD diagnosis (r=−0.22, p< 0.001) and hyperactivity/impul-sivity (r=−0.21, p< 0.001). Factor 3 did not show sig-nificant associations with any behavioral items.
Validating the predictive nature of the biological phenotypes against clinical diagnoses
In afinal step, we explored the association between the
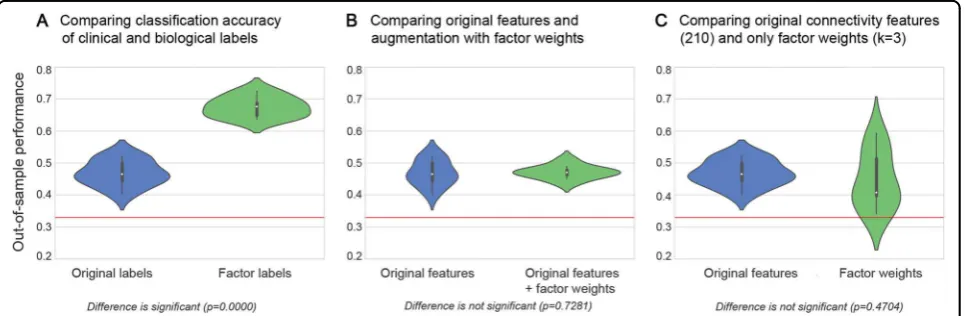
discovered brain-derived connectivity factors and the biological and categorical labels (Fig. 5). Note that the connectivity factors and biological labels were derived without using the original disease group labels or any questionnaire scores. To enable systematic assessment of the predictive accuracy added by the discovered dimen-sional endo-phenotypes, we generated an unbiased set of new data-derived neurobiological labels for all individuals. The neurobiological labels were then systematically compared against the clinical labels by testing for diag-nostic relevance based on linear SVMs. We conducted three plausibility tests to provide quantitative answers to different questions.
(1) We asked whether the new data-derived neurobio-logical labels capture the neural dysfunction encoded in
the connectional fingerprints more accurately than the
categorical labels (i.e., TD versus ADHD versus ASD) (Fig.
5a). We would like to point out that all biological labels were statistically independent of the connectivityfi
nger-print and therefore act just like a regular input variable (c.f. pre-validation in methods)50,51. SVMs correctly pre-dicted the independent neurobiological label from con-nectional fingerprints in unseen participants 67.33 ±
3.07% of the time (chance is at 33.33%). Predicting the original categorical diagnoses provided by board-certified
psychiatrists achieved only an accuracy of 46.73 ± 3.97% in new participants. This difference in classification accuracy
across predictions was statistically significant atp< 0.0001
as evaluated by a t-test. This finding indicates that the
imaging-derived neurobiological labels captured the underlying variation of disease dimension within the connectivity information more accurately than the origi-nal categorical group labels.
(2) We explored whether the categorical diagnostic labels could be better predicted from the individual con-nectionalfingerprint (i.e., the full node–node connectivity
information for each participant) if the factor weights were added to the explanatory variables (Fig. 5b). We hence asked whether adding the information about the individual factor weights (i.e., three continuous numbers) to the connectional fingerprint enhances the diagnostic
[image:9.595.58.542.88.246.2]classification to capture the underlying shared pathology Fig. 5 Evaluation of predictability, robustness, and expressiveness of the transdiagnostic brain phenotypes for clinical validation.
Evaluating intra-subject predictions, the clinical usefulness of the measured network connectivity strengths (blue) was systematically evaluated against the discovered neurobiological endo-phenotypes (green). Violin plots are similar to box plots in showing the median (white point), quartiles (thick black lines), and outliers (below/above thin black whiskers), but also expose the probability densities of the data points (sideways shapes).a
Classification performance (1.0=all subjects correct, 0.33=chance as red line) of predicting the original diagnosis groups (TD, ADHD, and ASD) versus the neurobiologically derived groups (indicated by the most important factor in each participant) based on the overall brain connectivity. The data-derived disease factors could be much better predicted in connectivity profiles from new, previously unseen participants (p< 0.0001).b
more accurately. The classification accuracy on the
ori-ginal connectivityfingerprints alone reached 46.73 ± 3.97
percent (chance still at 33.33%), whereas the original features supplemented with the weights of biological factors reached 46.61 ± 1.98%. When adding the dimen-sional information of the biological groups, there was hence no statistically significant difference in
out-of-sample prediction accuracy (p=0.73). However, notably, the prediction model improved according to another clinically relevant performance metric: The variance of the prediction model was reduced by a factor of 2. This
finding indicated that aiding the prediction model based
on categorical group labels by adding information on the biological groups did not enhance categorizing the shared neuropathology reflected in the sets of connectivity
fea-tures on average across predictions, but made prediction in a given individual more reliable.
(3) We compared the predictability of the categorical labels based on the full connectionalfingerprint with the
predictability based on the three factor weights alone (i.e., a total of 3 numbers per participant; Fig.5c). The analysis achieved a classification performance of 44.48 ± 9.11%
accuracy in unseen participants based on the factors, and was very close to the 46.73 ± 3.97% accuracy in prediction of the clinical labels based on the full connectivity matrix. This difference in prediction performance was not sta-tistically significant (p=0.47). To emphasize the impor-tance of this finding: Reducing the 210 node–node
connectivity features to three indicators of biological phenotypes in each individual still allowed for classifi
ca-tion of TD, ADHD, and autistic participants with essen-tially identical predictive performance.
In summary, we identified imaging-derived brain
phe-notypes based on large-scale network connectivity in the DMN, DAN, and SN using a hierarchical Bayesian fra-mework. The phenotypes were derived in a data-driven fashion without access to any clinical or diagnostic information, and were gradually shared across TD, ADHD, and ASD individuals. Finally, we demonstrated that these brain endo-phenotypes were reliable to enhance categorical diagnoses made by board-certified
psychiatrists to capture the underlying neural dysfunction shared in both disorders more effectively.
Discussion
The present computational investigation sought formal models to capture the shared neural dysfunction in ADHD and ASD. Given the overlap in clinical presenta-tion (i.e., exo-phenotypes), we hypothesized that distinct neural signatures (i.e., endo-phenotypes) can be found to describe the common underlying brain network dys-function. We introduced a novel framework of hier-archical Bayesian inference to identify brain phenotypes of DMN coupling, which were gradually shared across 1305
TD, ADHD, and ASD individuals. We showed that both disorders could be situated along three dimensions of neurobiological variation. We decided to focus our study on previous empirical evidence for shared abnormal large-scale network function in ADHD and ASD. The present data hence suggest that the clinical overlap seen in ADHD and ASD is caused by a shared underlying pattern of brain network dysfunction characterized by distinct coupling patterns of the temporoparietal cortices in the DMN with the DAN and SN. In the following, we discuss the cou-pling patterns of each factor in the light of the current neuroimaging literature.
Factor 1 was characterized by high DMN-DAN, med-ium DMN-SN, low intra-DMN, and low intra-DAN coupling weights. The subject-by-subject expression of this factor showed the highest positive associations with ADHD symptom measures. These observations largely confirm previous findings that the manifestation of
ADHD symptoms involves altered DMN-DAN interac-tions, e.g. as implicated in attentional lapses52. Our results are consistent with reports of decreased con-nectivity within the DMN and DAN in ADHD popula-tions19,23, which the investigators proposed to explain attention deficits. In contrast to the behavioral
associa-tions of factor 1, the subject-specific expression of factor
2 was positively correlated with ASD diagnosis. On a network level, factor 2 showed high negative functional connectivity for DMN-DAN, low DMN-SN and AI-AM connections. This confirmed and expanded previous findings of observed hypo-connectivity within the
sal-ience network itself and between the SN and DMN in ASD18,53. The aberrant DMN-SN interaction might potentially be the origin of deficits seen in ASD regarding
impaired emotional awareness of the self and others, and impaired reorienting to salient social or emotional stimuli.
Finally, factor 3 showed negative coupling relations among the DMN and between DAN nodes. In particular, the posterior subregion of the right TPJ depicted lower functional coupling than the anterior subregion, while no such dissociation was observed in the left TPJ. In contrast, factor 2 showed the inverse coupling pattern, while overall showing more positive associations with ASD than ADHD. Earlier studies found a functional separation of the anterior and posterior rTPJ37,54: While the anterior subregion was shown to be closely related to the reor-ientation of attention, the posterior cluster was func-tionally associated with Theory-of-Mind and social cognition. Across brain phenotypes, distinct patterns of dysconnectivity in the rTPJ effectively differentiated between ADHD and ASD. We hence suggest that a shared expression of factors 2 and 3 may play a critical role in contributing to the variability of shared deficits seen in
Connectivity-derived biomarkers anchored in the partly shared functional architecture of the DMN may further disentangle the observed heterogeneity in ADHD and ASD diagnostics and potentially lead to targeted treat-ment options in the future. In ADHD, Peterson and col-leagues specifically reported that psychostimulants may
improve ADHD related symptoms by normalizing dys-functional connections between DMN and DAN related activity in adolescents55. ASD, in turn, was reported to show aberrant intra-DMN coupling and diminished antagonistic correlation with task-positive networks, such as DAN and SN56,57. However, dedicated translational research will be needed to extend the search for trans-diagnostic biomarkers and eventually evaluate their potential use in treatment.
In conclusion, we used an innovative hierarchical Bayesian modeling strategy to identify and formalize intermediate brain phenotypes to interrogate our hypothesis of shared dysfunctional connectivity in the DMN, DAN, and SN. The endo-phenotypes derived in a data-driven fashion without access to any clinical or diagnostic information were gradually shared across the neurodevelopmental disorders of ADHD and ASD. We demonstrated that hundreds of resting-state brain scans for each participant could be re-expressed in only three numbers that captured hidden heterogeneity in DMN coupling. The derived brain endo-phenotypes were then demonstrated to enhance categorical diagnoses made by board-certified psychiatrists to capture the neural
dys-function shared in both disorders more accurately. The realized analysis strategy is not constrained to ADHD and ASD, but may be applied to a variety of major psychiatric disorders. Further investigations may target not only shared dysfunction58 but also individual treatment response, similar to recent work in depression59. Identi-fying and validating brain-based endo-phenotypes will most likely be and continue to be an unavoidable cor-nerstone for personalized medicine in child psychiatry26,60 and general psychiatry26,27,61.
Data availability
All used data are open-access (ABIDE and ADHD-200) and are readily accessible to the reader.
Acknowledgements
Mr Kernbach is funded by the German National Academic Foundation and the International Research Training Group (IRTG 2150) of the German Research Foundation (DFG). Dr Bzdok is funded by the German Research Foundation (BZ2/2–1, BZ2/3–1, and BZ2/4–1; IRTG 2150), Amazon AWS Research Grant (2016 and 2017), as well as the START-Program and Exploratory Research Space of the Faculty of Medicine, RWTH Aachen.
Author details
1Department of Psychiatry, Psychotherapy and Psychosomatics, RWTH Aachen
University, 52072 Aachen, Germany.2Department of Psychiatry, University of Pennsylvania, Perelman School of Medicine, Philadelphia, PA 19104, USA.
3
Department of Bioengineering, University of Pennsylvania, Philadelphia, PA
19104, USA.4Department of Electrical & Systems Engineering, University of
Pennsylvania, Philadelphia, PA 19104, USA.5Department of Psychology, York Neuroimaging Centre, University of York, Hesslington, York, UK.6Max Planck
Institute for Human Cognitive and Brain Sciences, 04303 Leipzig, Germany.
7Child Psychiatry Branch, National Institute of Mental Health, Bethesda, MD
20892, USA.8Parietal team, INRIA, Neurospin, bat 145, CEA Saclay, 91191
Gif-sur-Yvette, France.9JARA-BRAIN, Jülich-Aachen Research Alliance, Aachen,
Germany.10Department of Child Psychiatry, Child Neuropsychology Section,
RWTH Aachen University, 52072 Aachen, Germany.11Institute of Neuroscience and Medicine (INM-3), Research Centre Juelich, Juelich, Germany
Conflict of interest
The authors declare that they have no conflict of interest.
Publisher's note
Springer Nature remains neutral with regard to jurisdictional claims in published maps and institutional affiliations.
Received: 3 February 2018 Revised: 3 May 2018 Accepted: 11 May 2018
References
1. Murphy, K. & Barkley, R. A. Attention deficit hyperactivity disorder adults: comorbidities and adaptive impairments.Compr. Psychiatry 37, 393–401 (1996).
2. Billstedt, E., Gillberg, I. C. & Gillberg, C. Autism after adolescence: population-based 13- to 22-year follow-up study of 120 individuals with autism diag-nosed in childhood.J. Autism Dev. Disord.35, 351–360 (2005).
3. Biederman, J. et al. Patterns of psychiatric comorbidity, cognition, and psy-chosocial functioning in adults with attention deficit hyperactivity disorder. Am. J. Psychiatry150, 1792–1798 (1993).
4. van der Meer, J. M. et al. Are autism spectrum disorder and attention-deficit/ hyperactivity disorder different manifestations of one overarching disorder? Cognitive and symptom evidence from a clinical and population-based sample.J. Am. Acad. Child Adolesc. Psychiatry51, 1160–72 e3 (2012). 5. Mulligan, A. et al. Autism symptoms in attention-deficit/hyperactivity disorder:
a familial trait which correlates with conduct, oppositional defiant, language and motor disorders.J. Autism Dev. Disord.39, 197–209 (2009).
6. Rommelse, N. N., Geurts, H. M., Franke, B., Buitelaar, J. K. & Hartman, C. A. A review on cognitive and brain endophenotypes that may be common in autism spectrum disorder and attention-deficit/hyperactivity disorder and facilitate the search for pleiotropic genes. Neurosci. Biobehav. Rev. 35, 1363–1396 (2011).
7. Ronald, A. & Hoekstra, R. A. Autism spectrum disorders and autistic traits: a decade of new twin studies.Am. J. Med. Genet. B. Neuropsychiatr. Genet.156B, 255–274 (2011).
8. Ronald, A., Simonoff, E., Kuntsi, J., Asherson, P. & Plomin, R. Evidence for overlapping genetic influences on autistic and ADHD behaviours in a com-munity twin sample.J. Child Psychol. Psychiatry49, 535–542 (2008). 9. Reiersen, A. M., Constantino, J. N., Grimmer, M., Martin, N. G. & Todd, R. D.
Evidence for shared genetic influences on self-reported ADHD and autistic symptoms in young adult Australian twins.Twin. Res. Hum. Genet.11, 579–585 (2008).
10. Rommelse, N. N., Franke, B., Geurts, H. M., Hartman, C. A. & Buitelaar, J. K. Shared heritability of attention-deficit/hyperactivity disorder and autism spectrum disorder.Eur. Child Adolesc. Psychiatry19, 281–295 (2010).
11. Geurts, H. M., Verte, S., Oosterlaan, J., Roeyers, H. & Sergeant, J. A. How specific are executive functioning deficits in attention deficit hyperactivity disorder and autism?J. Child Psychol. Psychiatry45, 836–854 (2004).
12. Dyck, M. J., Ferguson, K. & Shochet, I. M. Do autism spectrum disorders differ from each other and from non-spectrum disorders on emotion recognition tests?Eur. Child Adolesc. Psychiatry10, 105–116 (2001).
13. Groen, Y. et al. Error and feedback processing in children with ADHD and children with Autistic Spectrum Disorder: an EEG event-related potential study. Clin. Neurophysiol.119, 2476–2493 (2008).
and auditory continuous performance test.Child Neuropsychol.12, 335–348 (2006).
15. Swaab-Barneveld, H. et al. Visual sustained attention in a child psychiatric population.J. Am. Acad. Child Adolesc. Psychiatry39, 651–659 (2000). 16. Konrad, K. & Eickhoff, S. B. Is the ADHD brain wired differently? A review on
structural and functional connectivity in attention deficit hyperactivity dis-order.Hum. Brain. Mapp.31, 904–916 (2010).
17. Müller, R.-A. et al. Underconnected, but how? A survey of functional con-nectivity MRI studies in autism spectrum disorders. Cereb. Cortex 21, 2233–2243 (2011).
18. Assaf, M. et al. Abnormal functional connectivity of default mode sub-networks in autism spectrum disorder patients.Neuroimage53, 247–256 (2010).
19. Tomasi, D. & Volkow, N. D. Abnormal functional connectivity in children with attention-deficit/hyperactivity disorder.Biol. Psychiatry71, 443–450 (2012). 20. Di Martino, A. et al. Shared and distinct intrinsic functional network centrality
in autism and attention-deficit/hyperactivity disorder. Biol. Psychiatry 74, 623–632 (2013).
21. Seeley, W. W. et al. Dissociable intrinsic connectivity networks for salience processing and executive control. J. Neurosci.: Off. J. Soc. Neurosci. 27, 2349–2356 (2007).
22. Monk, C. S. et al. Abnormalities of intrinsic functional connectivity in autism spectrum disorders.Neuroimage47, 764–772 (2009).
23. Castellanos, F. X. et al. Cingulate-precuneus interactions: a new locus of dys-function in adult attention-deficit/hyperactivity disorder. Biol. Psychiatry63, 332–337 (2008).
24. Sripada, C. et al. Disrupted network architecture of the resting brain in attention-deficit/hyperactivity disorder. Hum. Brain. Mapp. 35, 4693–4705 (2014).
25. Insel, T. R. The NIMH Research Domain Criteria (RDoC) Project: precision medicine for psychiatry.Am. J. Psychiatry171, 395–397 (2014).
26. Insel, T. et al. Research domain criteria (RDoC): toward a new classification framework for research on mental disorders.Am. J. Psychiat.167, 748–751 (2010).
27. Hyman, S. E. Can neuroscience be integrated into the DSM-V?Nat. Rev. Neurosci.8, 725–732 (2007).
28. Bellec, P. et al. The Neuro Bureau ADHD-200 Preprocessed Repository. Neu-roimage144, 275–286 (2017).
29. Lavoie-Courchesne S., et al., (eds).Journal of Physics: Conference Series; (IOP Publishing, 2012).
30. Power, J. D., Barnes, K. A., Snyder, A. Z., Schlaggar, B. L. & Petersen, S. E. Spurious but systematic correlations in functional connectivity MRI networks arise from subject motion.Neuroimage59, 2142–2154 (2012).
31. Dickstein, D. P. et al. Developmental meta-analysis of the functional neural correlates of autism spectrum disorders.J. Am. Acad. Child Adolesc. Psychiatry
52, 279–89 e16 (2013).
32. Visser, S. N. et al. Trends in the parent-report of health care provider-diagnosed and medicated attention-deficit/hyperactivity disorder: United States, 2003-2011.J. Am. Acad. Child Adolesc. Psychiatry53, 34–46 e2 (2014).
33. Fombonne, E. The Changing Epidemiology of Autism.J. Appl. Res. Intellect. Disabil.18, 281–294 (2005).
34. Lai, M. C. et al. Biological sex affects the neurobiology of autism.Brain136, 2799–2815 (2013).
35. Poissant, H., Rapin, L., Chenail, S. & Mendrek, A. Forethought in Youth with Attention Deficit/Hyperactivity Disorder: An fMRI Study of Sex-Specific Differ-ences.Psychiatry J.2016, 6810215 (2016).
36. Lefort-Besnard, J. et al. Different shades of default mode disturbance in schi-zophrenia: Subnodal covariance estimation in structure and function.Hum. Brain. Mapp.39, 644–661 (2018).
37. Bzdok, D. et al. Characterization of the temporo-parietal junction by com-bining data-driven parcellation, complementary connectivity analyses, and functional decoding.Neuroimage81, 381–392 (2013).
38. Bzdok, D. et al. Left inferior parietal lobe engagement social cognition and language.Neurosci. Biobehav. Rev.68, 319–334 (2016).
39. Eickhoff, S. B., Laird, A. R., Fox, P. T., Bzdok, D. & Hensel, L. Functional segre-gation of the human dorsomedial prefrontal cortex.Cereb. Cortex26, 304–321 (2016).
40. Bzdok, D. et al. Subspecialization in the human posterior medial cortex. Neuroimage106, 55–71 (2015).
41. Bzdok, D. et al. Parsing the neural correlates of moral cognition: ALE meta-analysis on morality, theory of mind, and empathy.Brain. Struct. Funct.217, 783–796 (2012).
42. Rottschy, C. et al. Modelling neural correlates of working memory: a coordinate-based meta-analysis.Neuroimage60, 830–846 (2012).
43. Yeo, B. T. et al. The organization of the human cerebral cortex estimated by intrinsic functional connectivity.J. Neurophysiol.106, 1125–1165 (2011). 44. Ghahramani Z., Griffiths T. L. & (eds).Infinite latent feature models and the Indian
buffet process; (NIPS, 2006).
45. Blei, D. M., Ng, A. Y. & Jordan, M. I. Latent Dirichlet Allocation.J. Mach. Learn. Res.3, 993–1022 (2003).
46. Zhang, X. et al. Bayesian model reveals latent atrophy factors with dissociable cognitive trajectories in Alzheimer’s disease.Proc. Natl Acad. Sci. USA113, E6535–E6544 (2016).
47. Tibshirani, R. J. & Efron, B. Pre-validation and inference in microarrays.Stat. Appl. Genet. Mol. Biol.1, 1000 (2002).
48. Tibshirani, R. J. & Efron, B. Pre-validation and inference in microarrays.Stat. Appl. Genet. Mol. Biol.1, 1 (2002).
49. Hastie T., Tibshirani R. & Wainwright M.Statistical learning with sparsity: the lasso and generalizations. (eds Taylor & Francis Group) 351 (CRC Press, Boca Raton, 2015).
50. Boulesteix, A. L., Porzelius, C. & Daumer, M. Microarray-based classification and clinical predictors: on combined classifiers and additional predictive value. Bioinformatics24, 1698–1706 (2008).
51. Giudici P., Ingrassia S. & Vichi M.Statistical models for data analysis: (Springer, 2013).
52. Weissman, D. H., Roberts, K. C., Visscher, K. M. & Woldorff, M. G. The neural bases of momentary lapses in attention.Nat. Neurosci.9, 971–978 (2006).
53. Ebisch, S. J. et al. Altered intrinsic functional connectivity of anterior and posterior insula regions in high-functioning participants with autism spectrum disorder.Hum. Brain. Mapp.32, 1013–1028 (2011).
54. Krall, S. C. et al. The right temporoparietal junction in attention and social interaction: A transcranial magnetic stimulation study.Hum. Brain. Mapp.37, 796–807 (2016).
55. Peterson, B. S. et al. An FMRI study of the effects of psychostimulants on default-mode processing during Stroop task performance in youths with ADHD.Am. J. Psychiatry166, 1286–1294 (2009).
56. Whitfield-Gabrieli, S. & Ford, J. M. Default mode network activity and con-nectivity in psychopathology.Annu. Rev. Clin. Psychol.8, 49–76 (2012). 57. Broyd, S. J. et al. Default-mode brain dysfunction in mental disorders: a
sys-tematic review.Neurosci. Biobehav. Rev.33, 279–296 (2009).
58. Clementz, B. A. et al. Identification of distinct psychosis biotypes using brain-based biomarkers.Am. J. Psychiatry173, 373–384 (2016).
59. Drysdale, A. T. et al. Resting-state connectivity biomarkers define neurophy-siological subtypes of depression.Nat. Med.23, 28–38 (2017).
60. Stephan, K. E. et al. Charting the landscape of priority problems in psychiatry, part 1: classification and diagnosis. Lancet Psychiatry 3, 77–83 (2016).
61. Collins, F. S. & Varmus, H. A new initiative on precision medicine.New Engl. J. Med.372, 793–795 (2015).