European Commission
Abrasive water-jet cutting technique from
the laboratory stage into real application
G. Meier\ H. Louis\ G. Pilot
21
Universitat Hannover IW
AppelstraBe 11 A D-30167 Hanover
2 CEA, DPEI/SERAC
CEN Saclay, Bat. 389 F-91191 Gif-sur-Yvette Cedex
Contract No F12D-0009
This work was performed in the framework of the European Communities' research programme on the decommissioning of nuclear installations (1989-93)
Section C: Alternative tests
Published by the EUROPEAN COMMISSION
Directorate-General XIII
Telecommunications, Information Market and Exploitation of Research
L-2920 Luxembourg
LEGAL NOTICE
Neither the European Commission nor any person acting on
behalf of the Commission is responsible for the use which might be made of the following information
Cataloguing data can be found at the end of this publication
Table of Content
Summary 1
Introduction 2
Abrasive Jet Generation 2
Pressure generation 2
Jet generation 3
Experimental Work and Results 5
B.1 Definition of cutting parameters 5
Minimisation of consumed water 10
Minimisation of used abrasives 12
B.2 Development of control systems 15
B.2.1 Preparation of the test equipment 16
B.2.2 Tool control 17
B.2.3 Control of the cutting result 22
B.3 Methods to replace worn parts of the cutting head 28
B.4 Characterisation and handling of secondary waste 30
B.4.1 Preparation of the test facility 30
B.4.2 Measurement and characterisation of the sec.emmissions 35
Balance of the secondary emissions 35
Size distribution of abrasives and sedimented dross 39
Characterisation of the aerosols in the exhaust duct 42
Gas 44
Kerf appearance 44
B.4.3 Methods to lower the spreading out of the emissions 46
Cutting through 46
B.4.4 Determination of the efficiency of different methods
Balance of the secondary emissions
Size distribution of abrasives and sedimented dross Characterisation of the aerosols in the exhaust duct
Conclusions and Outlook
References
Annexes
52
54
5663
65
Summary
The aim of the project was to qualify the abrasive water jet cutting technique for
appli-cation in nuclear decommissioning.
First, the cutting parameters which are known from industrial application had to be adapted to the special conditions of dismantling contaminated or activated material. Mainly, the minimisation of the secondary waste was of importance. Therefore tests were carried out to reduce the amount of abrasives as well as the consumption of water by optimising the cutting parameters. The efficiency of the abrasives was increased by reducing the abrasive flow rate and by increasing the working pressure. The minimisa-tion of the water consumpminimisa-tion can be realised by using a high working pressure and a small nozzle diameter.
The operation during dismantling work has to be remote controlled. Therefore,
meth-ods
are required to control the state of the wear of the cutting tool as well as the cuttingresult.
The tool control can be realised by measuring the sucked-in air flow rate. By this tech-nique the state of wear as well as the conditions of abrasive transport can be supervised. Experiments have shown, that sound analysis are no sufficient method to check the cutting result (cutting through or kerfing only). But in case of kerfing the reflected jet can be detected by a deflector plate and an adapted accelerometer.
Different tests have been carried out to quantify the secondary waste. Abrasive water jet cutting produces a small amount of aerosols, especially when cutting under water. Most of the waste is sedimented dross. During the cutting process the abrasive particles disintegrate, so the mean diameter of the particles is less than 150 !lfi1 in most cases. When kerfing the use of a suction hood can lower the spreading out of the secondary
waste. The adaptation of a separation unit like a hydrocyclone can help to clean the
water of the cutting basin. During the tests about 70 % of the solid waste was caught
and separated by the cyclone.
Using optimised cutting parameters to minimise the consumption of water and
abra-sives and separating the waste from the water by using a cyclone can lead to an
impor-tant reduction of waste. In addition methods have to be investigated in future to recycle
the separated abrasives. First tests point out that a recycling of 80-90 % of the abrasives
Introduction
An increasing number of technical installations are hazardous by themselves (like nuclear installations) or they have taken place in inaccessible environment (like off-shore structures). When finishing lifetime all these facilities have to be removed without exposing the operation staff to danger and without contaminating the environment.
Conventional tools to do these jobs are percussive hammers, different kinds of saws, blasting techniques and thermal cutting methods like plasma cutting
/1/.
But unfortu-nately all cutting techniques have specific disadvantages: They produce a lot of dust and mechanical load (hammer, blasting, saw), the weight of the tools is quite high (saw, hammer) and it is difficult to use them remote-controlled (hammer). Plasma cutting technique is applicable to dismantle nuclear installations, but the tool produces diffi-cult-to-handle aerosols even when working under water /2/.An alternative non-thermal method is the abrasive water jet cutting technique: Small mineral particles accelerated by a high speed water jet, are able to cut any kind of material. Advantages of this technique are
I
1,3/:- non-contacting process
-small cutting forces (for the manipulator) - small and lightweight cutting head
- non-thermal cutting process, no fire risk - no chemical reaction products
-small kerfs (small amount of radioactive waste when cutting activated structures) - all kinds of material can be cut
The main disadvantage is the great amount of secondary waste produced during opera-tion. Therefore, it is necessary in case of dismantling operations in nuclear environment to reduce the added abrasives and to reach a high cutting performance with respect to the minimisation of secondary waste. Additionally the generation of aerosols has to be investigated.
For using this cutting technique remote controlled it is necessary to adapt controlling devices to check the reliability of the tool as well as the cutting result during operation.
ABRASIVE JET GENERATION
Pressure generation
intensi-fier pumps are normally double-ended pistons utilising differential areas to multiply pressure provided by a standard variable displacement hydraulic pump (fig. 1). With a
commercial available intensifier pump pressures up to 4000 bar are achievable, but at a
comparatively low level of flow rate of 2 to 41/min. Up to three intensifiers are mount-ed in one pumping set.
water to cutting head
water motor oilpump
inlet ..._ _ _ _ _ _ ___,
intensifier pump
Jet generation
pressure antensifier
Figure 1
Draft of an intensifier pump
The abrasive water jet is formed in a special mixing head. First a plain water jet is produced and the abrasives are added afterwards in a hard metal or ceramic mixing nozzle.
The mixing head works according to the principle of waterjet pump, what means that the high speed water jet generates a suction pressure in the suction port, which produces a pneumatic transport of the abrasives into the mixing head.
For all the cutting tests a self-designed abrasive cutting head was used /3,4/.
To adjust the axis of the focusing nozzle on the high speed water jet a ball-and-socket
joint was created (fig. 2).
So the focusing nozzle is movable around the water jet nozzle within small angles. In
case of not adjusting the cutting head the irregular wear in the focusing nozzle increases rapidly and cutting efficiency decreases because of friction loss.
high pressure water
•
water jet
focusing nozzle
----Figure2 Abrasive cutting head
ball-and-socket joint
The abrasive feed is realised by a vibration feeder, the particles are transported by air
stream. Figure 3 shows SEM-pictures of new and used garnet sand.
a) new
1
1000 JLm I b)
. . used
Obviously there is a disintegration of the particles during the cutting process.
For the cutting experiments samples of austenitic steel X2 CrNi18 8 (1.4301)) and aluminium alloy (AIMgSi 0.5) have been used. All the samples were not cut through but kerfed to measure and compare the depth of kerf. For measuring aerosols also samples made out of copper have been used
Figure 4 gives an overview of an abrasive water jet cutting system. In addition to the equipment mentioned before a handling system is necessary as well as a catcher unit to protect the environment from the hazardous jet.
water inlet
Figure4
p
catcher
flexible high pressure
tubing
Abrasive water jet cutting system
handling system
The reported tests were carried out in a water basin with a numerical-controlled 2-dimensional traverse mechanism. All tests took place under water.
Experimental Work and Results
B.l. Definition of cutting parameters
For the application of abrasive water jets in case of decommissioning nuclear facilities it is necessary to reduce the abrasive flow rate as well as the amount of used water to minimum values due to the problems of handling the secondary waste.
Due to these facts the cutting performance related to the amounts of used abrasive and
water has to be optimised. Important process parameters are
- traverse rate -distance -pressure
- nozzle diameter - abrasive flow rate
All tests ca_rried out were kerfing tests. The sample materials were not cut through but
kerfed only. The depth of kerf gives an easy method to determine the cutting
perform-ance.
There are several ways to compare the cutting performances:
- The cutting performance is defined as the area of the shoulder of the cut related to the time used for the production. It can be calculated by multiplying the obtained
depth of kerf with the traverse rate being used (units: mm2/min).
- To quantify the efficiency of water and abrasives specific cutting performances were defined: The obtained area of the shoulder of the cut can be divided by the
con-sumed amount of water or abrasives (units: mm2/l or mm2/g).
The cutting performance related to the energy consumption (mm2/J) was not
investi-gated in this contract, because providing energy is neither a technical nor an economical
problem for decommissioning purposes.
To start the optimisation process it is necessary to know about the influence of different
parameters to find the right starting position. At first the influence of the traverse rate
on the depth of kerf was investiga~ed. Figure
5
gives the results for different pressures.100 a p rilp
nozzle-IJ: 0.25 mm 90
,...-,
E 80 E
70
...
~60
-
.._
D 3000 bar, 1 0 g/ s focus: dF = 1.1 mm
IF= 40 mm
+ 2400 bar, 9.0 g/s distance: 2 mm - uW
•
2000 bar, 7.0 g/s abrasive:Minersivm:
adjusted A 1000 bar, 5.0 g/s sample-mat.: 1.4301CD 50
~
-
0 40-'= 30
-
c.. CD20
""0
10
0
0 20 40 60 80 100 120 140 160
traverse rate v [mm/min]
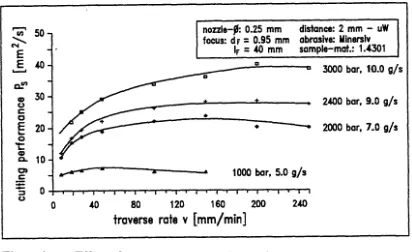
The relation appears approximately inverse proportional: Increasing the traverse rate causes a decrease in depth of kerf by the same factor. Figure 6 shows the attainable cutting performance for the variation of the traverse rate.
'Cij' 50
~
[image:13.580.47.459.151.403.2]E
E
M>...
c.."'
CD 30
(,)
c:: 0
E
._ 2.0 0 "t:CD a.. 10
C)
.5
-nozzle-jf: 0.2.5 mm distance: 2. mm - uW focus: d F
=
0.95 mm abrasive: Mlnerslvlr
=
M> mm sample-mat.: 1.4301 a3000 bar, 10.0 g/s
----~·----:·---=-
2.M>O bar, 9.0 g/s• 2000 bar, 7.0 g/s
1000 bar, 5.0 g/s
-
::l o~~~~.-~~~~~~~-r~-r~~(,)
0
.c.o
80 120 160 2.00 240traverse rate v [mm/min]
Figure 6 Effect of traverse rate on cutting performance
When reaching a specific traverse rate for all pressures the cutting performance is not affected by increasing traverse rates. For these traverse rates the depth of kerf is in-verse proportional to the train-verse rate.
For any lower traverse rate the obtained kerfing depth increases not as much as pre-dicted. The reason can be found in figure 5. For example when using 3000 bar at a traverse rate of 20 mm./min a depth of kerf of more than 60 mm can be reached in austenitic steel. For a further reduction of cutting speed the depth of kerf will grow further on, but the friction between abrasive water jet and the shoulder of the cut and the increasing distance between cutting head and the bottom of the kerf will cause a loss of hydraulic power. So for kerfs deeper than about 30 mm (calculated from fig. 6) the cutting process is not as effective as for less deep kerfs.
The conclusions of these tests are:
- To compare the cutting performances for different parameters it is useful to take traverse rates which allow to kerf less than 30 mm deep. For these conditions the product of traverse rate and depth of kerf is nearly constant, so the results for differ-ent traverse rates are comparable.
- For real cutting jobs which make it necessary to cut deeper than 30 mm the decrease in cutting efficiency has to be taken into account.
kerfing in air as well as under water. As reported in /5/ the decrease of the depth of kerf under water is more important than in air, but when using special methods /5,6/ the effect can be reduced. Nevertheless, if possible, a working distance of 2 mm seems to be the best.
[image:14.578.74.503.137.450.2] [image:14.578.70.520.445.775.2]30
,...,
25 E E...
..:.: 20
't:
CD 15 ..:.:
-
0J.: 10
-
c..CD "'t:J 5
0
0
Figure 7
10 20
a In air
+
• under water
6
30 40
so
60distance s [mm]
Effect of working distance on depth of kerf
pressure: 3000 bar nozzle-fJ: 0.25 mm focus: d r
=
0.95 mmlr = .40 mm
traverse rate:
100mm/min abrasive: Mlnersiv
rh: 9 g/s sample-mat.: 1.4301
70 80
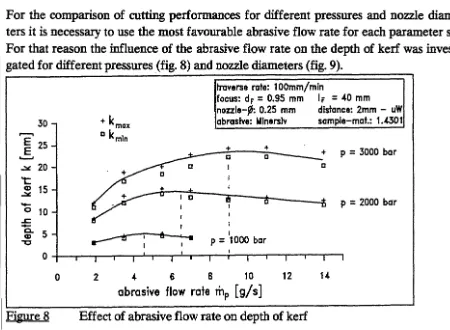
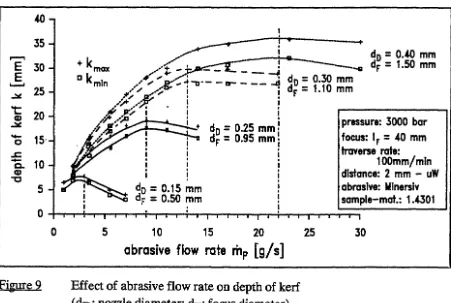
For the comparison of cutting performances for different pressures and nozzle diame-ters it is necessary to use the most favourable abrasive flow rate for each parameter set. For that reason the influence of the abrasive flow rate on the depth of kerf was investi-gated for different pressures _(fig. 8) and nozzle diameters (fig. 9).
30
....-.
E 25
E ...
..:.: 20 't:
CD 15
...::.::
-
0 10 J.:-
c.. 5CD "'t:J
0 0
Figure
B
+ kmax
0
kmln
I D
I I
~
traverse rate: 100mm/min
focus: dr
=
0.95 mm lr=
40 mmnozzle-~: 0.25 mm distance: 2mm - uW abrasive: Mlnerslv sample-mat.: 1..(301
+ D I I I + D
p
=
1000 bar+ p
=
3000 barD
p
=
2000 bar2 4 6 8 10 12
abrasive flow rate
mp
[g/
s]40
35
..---,
E 30
E
..__,
~ 25
"t: 20 CD
~
-
0 15· .s::.-
c.. 10 CD ""C 5 0 Figure 9 0.
Ii !
• do= 0.25 mm
dr
=
0.95 mmdo= 0.15 mm
dF
=
0.50 mmdo= 0.30 mm
dr
=
1.10 mmd0
=
0.40 mm dr=
1.50 mmpressure: 3000 bar
focus: I r
=
40 mm traverse rate:100mm/mln distance: 2 mm - uW abrasive: Wlnerslv sample-mat.: 1.4301
5 1 0 15 20 25 30
abrasive flow rate
rhp
[g/
s]
Effect of abrasive flow rate on depth of kerf ( dn: nozzle diameter; dF: focus diameter)
For all pressures and nozzle diameters being used there is an optimal abrasive flow rate existing. Lower as well as higher flow rates lead to a decrease in depth of kerf. The optimal flow rates are corresponding very good to the water flow rates, as figure 10 shows. The water mass flow can be calculated by the first equation of figure 11.
[image:15.583.53.504.100.403.2]'E
E ... c "'0 ~-!
E ..!:! "'0 CD "N N g 0.15 0.20 0.25 0.30 0.40 Figure 10pressure p [bar]
1000 2000 2400 3000 1000 2000 2400 3000 1000 2000 2400 3000
5.2 7.3 7.8 9.2 2.6 3.0 0.33 0.33
10.0 14.0 15.5 17.5 5.1 5.8 0.33 0.33
15.0 20.8 24.0 26.7 4.5 6.5 8.0 9.0 0.30 0.31 0.33 0.34
21.7 30.0 33.4 38.3 6.5 9.3 11.0 13.0 0.30 0.31 0.33 0.34
36.6 52.0 59.1 64.9 20.0 22.0 0.34 0.34
water flow rate ritw [g/s] lopt. abrasive flow rate rilp [g/ s] opt. mass ratio R (rilp
/mw)
measured c11lculated
Water flow rates
v=v~·p·
water flow rate:
0
jet velocity: v
nozzle diameter. d
0pressure: p
density of water:
p
Figure 11 Calculation of the water flow rate
According to the results in figure 10 for all tests a mass ratio R of about 0.33 has been used to reach the optimal cutting performance.
Minimisation of consumed water
As shown in figure 11 the water flow rate is influenced by the pressure and the nozzle diameter. The effect of both parameters on the specific cutting performance will be described in the following figures.
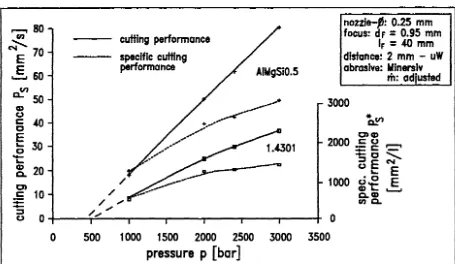
Figure 12 gives the effect of the pressure on the cutting performance as well as on the specific cutting performance related to the water consumption.
,..., 80
tn
:>....
N 70
E
~
60en c.:. 50
Q)
u c= 40
c
E
~ 30
"t:
:g_
20C) c 10 :;:
-
/cutting performance
specific cutting performance
/
AIMgSiO.S
nozzle-.fJ: 0.25 mm
focus: d r
=
0.95 mmlr
=
4-0 mmdistance: 2 mm - uW
abrasive: Minersiv rit: adjusted
3000
g
0;---~~--~--~----~--~----~----T 03500
0 500 1 000 1500 2000 2500 3000
[image:16.585.76.531.465.729.2]pressure p [bar]
An increasing pressure causes a linear increase in cutting performance and also a better specific cutting performance. For the highest pressure the exploitation of the water is the best. So it is useful to increase the pressure to values above 3000 bar, but in that case the tool life of the pressure pump (sealing) and the nozzles will be decreasing rapidly. For the tests the abrasive flow rate was adjusted to the water flow rate according to figure 10 (R = 033).
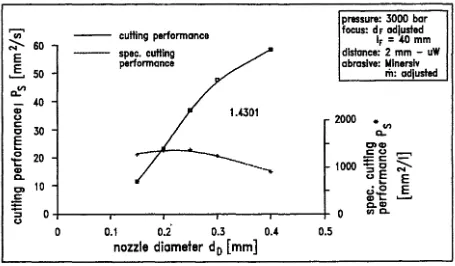
The results of a variation of the nozzle diameter are given in figure 13.
,...,
"'
~ 60
E E 50 .._..
~
40
~
u
c:
30 c
E
....
0 20 't:
~
c..
C) 10 c:
:;:::
[image:17.574.49.504.236.502.2]-
: l 0 uFigure 13
0
cutting performance
spec. cutting performance
1.4301
0.1 0.2 0.3 0.4 0.5
nozzle diameter d
0[mm]
Effect of nozzle diameter on cutting performance
pressure: 3000 bar focus: d r adjusted
lr
=
~0 mmdistance: 2 mm - uW abrasive: Minerslv
2000
m:
adjusted•en CL.
Although the cutting performance is increasing for bigger nozzles the specific perform-ance has an optimum for medium sized nozzles because of the rapid increase of the water flow rate for bigger nozzles. The abrasive flow rate was adjusted in the way already mentioned. To reach the optimal efficiency related to the water consumption a nozzle with a diameter of
020-0.25
mm should be used.Minimisation of used abrasives
[image:18.577.71.523.263.535.2]To find parameters for the best exploitation of the abrasives two strategies can be used. On one hand the best values regarding pressure and nozzle diameter can be determined for the optimal abrasive flow rate (fig. 10), on the other hand the abrasive flow rate can be lowered to values smaller than mentioned in figure 10. In that case the cutting per-formance related to the cutting time will be decreased (see fig. 8, 9), but the exploita-tion of the abrasives will be better as shown later in the report.
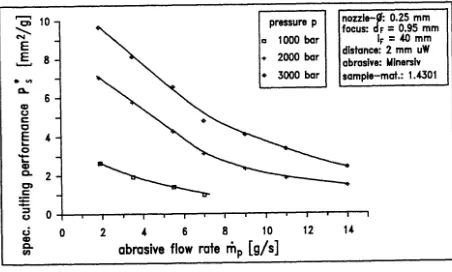
Figure 14 gives the effect of the abrasive flow rate on the specific cutting performance (related to the abrasive flow rate) for different pressures.
r--'1
10 nozzle-!: 0.25 mm
g ) pressure p
focus: F = 0.95 mm
~ a 1000 bar IF= 40 mm
E distance: 2 mm uW
E 8 + 2000 bar
abrasive: Winersiv ~
•
3000 bar sample-mat.: 1.4301.
"'
CL6
CD
c
r::
c
E
~ 4
0 "t:
CD
c. 2
0
r:: :;::
-
:::10 c
c3 0 2 4 6 8 10 12 14
CD
abrasive flow rate
mp
[g/
s]
c.
(I)
Figure 14 Effect of abrasive flow rate on specific cutting performance
The increase of pressure causes a better exploitation of the abrasives. Additionally the smaller flow rates result in a better specific cutting performance. The smallest flow rate causes the best exploitation regarding the abrasives. But, to fulfil a given cutting job, for smaller flow rates the time which is necessary to do the job will increase and so does the consumption of water and energy.
rc;
10~
E E .._.. 8
•
~6 CD u
c c
E
4 0't: CD c.. 2
C) c
:;::
-
~0 u
.
u CD c.. [image:19.572.44.497.87.371.2]en
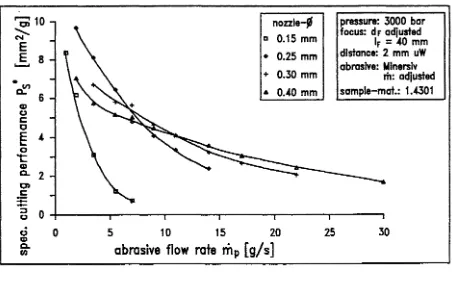
Figure 15
0
nozzle-{~
a 0.15 mm
• 0.25 mm
+ 0.30 mm
• 0.40 mm
5 10 15 20
abrasive flow rate
mp
[g/s]
Effect of abrasive flow rate on specific cutting performance
25
pressure: 3000 bar
focus: dF adjusted
IF= 40 mm
distance: 2 mm uW
abrasive: Mlnerslv
ril: adjusted sample-mat.: 1.4301
30
t [min]
mA [g]
Vw [I]
E [kJ]
ll m [g]
t [min]
mA [g]
Vw [I]
E [kJ]
ll m [g]
pressure [bar]
2000
2400
abrasive flow rate [g/ s]
I
10
! i
I
i2
I
20
2•
l
10
20
2
I
I
II
33.3
25.0
33.3
28.6
1
120.0
25.0
25.0
I
4000
!
150001 40000 3430
112ooo 30000 3000
! I
I
41.5
!31.2 I 41.6
41.2
128.8
36.0
40.0
ii
8300
!
6240
!
0.40
2
110
25.0
9.1
3000
5460
i
8320
989o
16912
8640
12oooj
:
160
nozzle diameter:
0.25
mmmaterial: austenitic steel,
20
mm thickness cutting length: 1 mnozzle diameter [mm]
0.30
abrasive flow rate [g/s]
i I I
I
I
20
2
I10
I
20
2
I
i
I
7.7
25.0
10.0
11.1
25.0
l
I
I
3000
i
!
9240
6000
13320 3ooo
1
3000
10
12.5
7500
I20.0
6000
0.25
10
12.5
1I
7500
97.5
35.5
130.0
57.5
23.0
25.5
I
40.0
i
20.0
292501
I
106501 9000
17250
I
69oo
I
7650
12ooo
16ooo
1250
200
pressure:
3000
barmaterial: austenitic steel,
20
mm thickness cutting length: 1 m [image:20.575.79.515.70.305.2]160
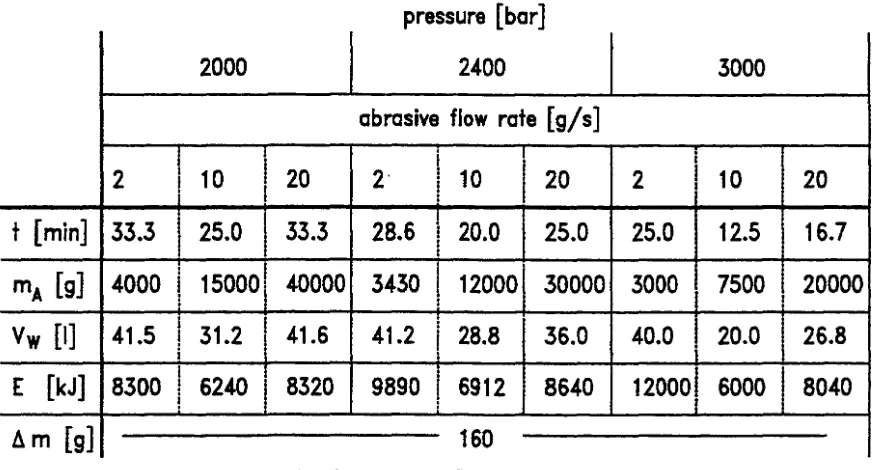
Figure 16 Cutting of steel, 20 mm thickness
The upper part gives the results for a variation of pressure and abrasive flow rate using a fixed nozzle diameter, the lower part shows the effect of different nozzle diameters.
The increasing pressure (upper part) leads to a decrease in used machining time (1.
line). The consumption of abrasive, water and energy decreases, too (line 2, 3, 4 ). The smallest abrasive flow rate causes the best abrasive efficiency per meter of cut, but leads to a high energy and water consumption compared to higher flow rates of abra-sive.
An increasing nozzle diameter (lower part of fig. 16) causes a better exploitation of the
abrasive (line 2) but also an increase of the water and energy consumption (line 3 and
4). In general smaller abrasive flow rates effect a better exploitation of the abrasives,
but lead to a much higher consumption of water.
So it is necessary to find a compromise between the amount of abrasives and the
amount of water and the cutting time.
B.2. Development of control systems
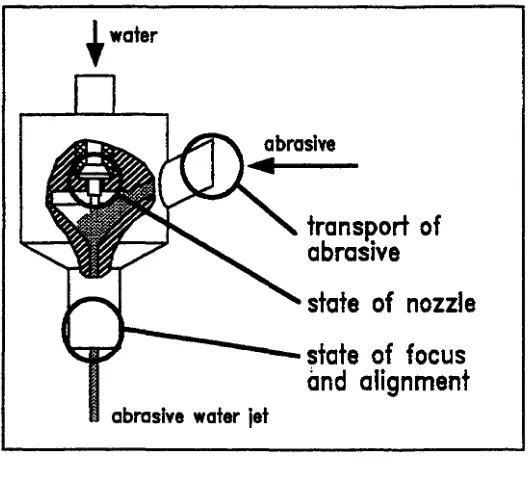
For remote controlled operation of abrasive water jets it is necessary to control the state of the tool as well as the cutting process (cutting result) /7
I.
Controlling the state of the tool means both supervising the geometry inside the cutting head (water nozzle and abrasive mixing nozzle) and monitoring the operation condi-tions of the cutting tool like the generation of the water jet or the abrasive transport (broken or clogged transport hose) (fig. 17).
[image:21.572.49.314.501.745.2]t
waterFigure 17
transJ?ort of
abrasive
state of nozzle
r---
state of focus
and alignment
abrasive water Jet
Controlling the cutting result means the detection if cutting through or kerfing only. Additionally it would be helpful to supervise the quality of the shoulder of the cut during operation.
B.2.1. Preparation of the test equipment
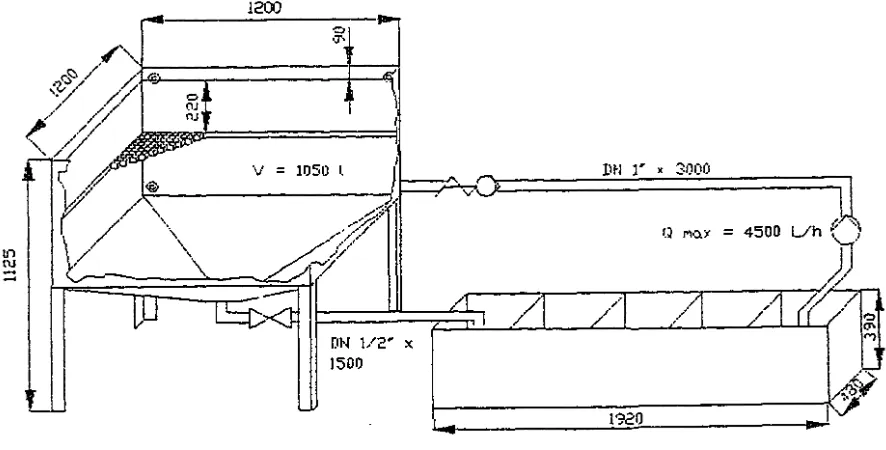
To develop useful sensor systems tests were carried out in a water basin (fig. 18).
tn
[image:22.575.79.522.264.489.2]1\J
-
~Figure 18
1200
Water basin
[IN 1/2~ X
ISOO
]tl I' • 3000
A
(J MO::l.Y = 4500 Uh
)1'
),
~---~~---~~~
1921)..J
For controlling the tool different measuring devices were installed (fig. 19).
The supervision of the state of the water jet nozzle can be realised by measuring the water flow rate passing the pressure pump ( # 1)
To supervise the conditions of the abrasive transport tests were carried out to use sound analysis. For this purpose a hydrophone (bruel & kjaer 8103) was installed near the cutting head(# 2).
For the supervision of the state of the cutting head a system to measure the sucked-in
air flow rate was adapted /4/ (# 3).
Additionally it has been tried to detect the pressure loss in a special part of the transport hose (hose length Lh) and to correlate this with the air flow rate(# 4).
\ abrasiv.es and a1r
@
~ [image:23.567.43.467.76.444.2]water basin
Figure 19· Experimental setup high pressure water
-
waterfrequency analysis
The hydrophone was used also for the detection of the cutting result ( # 2). The quencies of the sound pressure were analysed by Fourier-Transformation. Sound fre-quencies were measured for cutting through and kerfing a standard workpiece (austenit-ic steel).
In addition it has been tried to use the reflected abrasive water jet in case of kerfing the workpiece to detect this fact. On the cutting head a deflector with an accelerometer was installed ( # 5) to measure signals produced by the deflected jet.
B.2.2. Tool control
The reliability of the cutting tool mostly depends on the conditions of the feeding (water and abrasives) and the state of the water jet nozzle and the focus.
water inlet of the pump which means that the measurement system can be adapted at the low pressure side of the pump (pressure level of drinking water).
One possibility to supervise the conditions of the abrasive transport is measuring the
sound pressure produced by the cutting head. Figure 20 shows the results of the sound
[image:24.566.74.410.222.630.2]measurements. CD .... ::I en en CD .... 0.. -c c ::I 0 en CD .... ::I en (I) CD .... 0.. -c c ::I 0 (I) CD
....
::I (I) (I) CD .... 0.. -c c ::I 0 en 0Figure 20
·r ~· -,,..
I
2
normal working water jet, sucking in air
water jet, sucking in ambient water (broken abrasive reed hose)
water jet,
producing vacuum im the mixing chamber (clogged abrasive reed hose)
4 time in s
Control of the abrasive transport by sound analysis
For normal conditions (abrasives sucked in by air) the sound pressure is very low. In
case of sucked-in water (broken transport hose) the sound level increases rapidly. Also when the transport hose is clogged (in that case the cutting head produces a vacuum)
the sound level is very high because of cavitation effects.
...--, 40
c
-
E~
.._. ...J 30
0
CD
-
c....
~ 20
..2
-
....
-
c"'C 10
CD
-
E
Q.. en 0 c 0.8 Figure211.0 1.2 1.4 1.6 1.8
focus diameter d
F[mm]
3000 bar 2400 bar 2000 bar ~
.,
.,
1000 bar f Cl.500 bar
nozzle-Sf: 0.25 mm
focus: lr
=
40 mmhose length: 4 m hose diameter: 6 mm without abrasive
2.0
Effect of focus diameter on sucked-in air flow rate
The air flow rate is nearly linear with the diameter of the focusing nozzle for a constant diameter of the water jet nozzle. An increasing water pressure causes an increase in air flow.
For different nozzle diameter the results are given in figure 22.
...--,
50 nozzle diameter d0 [mm] pressure: 3000 bar
c
-
E 0.40focus: IF
=
40 mm... 0.30
~ 40 hose length: 4 m
...J 0.25
hose diameter: 6 mm
0 0.20
without abrasive CD
-
c 30 0.15....
~
..2 20
-
....
c
"'C 10CD
-
c....
·c_0 en c
0.8 1.0 1.2 1.4 1.6 1.8 2.0
focus diameter d
F[mm]
Bigger water jet nozzles cause a higher air flow rate. The results of the nozzles 0.25 and 0.40 mm are not in the usual range of air flow, because for these tests nozzles with a changed inlet geometry were used. This changed geometry effects a better jet stability and so the efficiency of the water jet pump (abrasive cutting head) decreases.
All the tests were carried out without feeding abrasives into the air flow because of the prevention of wear of the measurement device and the focusing nozzle.
Figure 23 gives a comparison of results obtained with and without abrasives.
c:
24e
:::::: 20
_,
0
Q) 16
-
~~ 12
..2
-
.!:: 80 '"'0
Q)
"E
4"5.
fn
without
abrasive
,..-
_a ___ - - - -D_____
...with
abrasive (9 g/s)
nozzle-Sf: 0.25 mm
focus: IF
=
40 mmabrasive: Minersiv cut under water
- - - 2000 bar
- - - 2 4 0 0 bar
- - - - 3000 bar
0 0~--~----~--~----~--~----r----r--~
0.8 0.9 1 1.1 1.2 1.3 1.4 1.5 1.6
focus diameter d
r [
mm]
Figure23 Effect of focus diameter on sucked-in air flow rate
Feeding abrasives into the air flow causes a decrease in flow rate due to friction and momentum loss. But the results show the same dependence of flow rate and focus diameter for both with and without abrasives.
As mentioned before the problem of measuring the flow rate during cutting is the flow of abrasives. To measure the flow rate of air two possibilities are practicable (fig. 24).
abrasive
cutting
head
Figure24
flow meter 2
(for sealed feeder)
flow meter 1
(air and abrasives)
Methods for controlling the air flow rate
abrasive
feed
mechanism
So, according to #4 in figure 19 the pressure drop in a specific length of the transport hose was measured.
The relation between this pressure difference (p1 -Pz) and the air flow rate is as fol-lows:
p1; p2: pressure c: constant
1:
hose length Q: air flow rateFigure 25 gives the results of detailed tests for different nozzle diameters. The cutting parameters are the same as in figure 22.
An increasing nozzle diameter causes an increase in air flow rate and therefore an increase in pressure loss.
The pressure loss of the nozzles with a diameter of 0.25 and 0.40 mm again indicates a smaller air flow rate compared to the other nozzles.
100 nozzle diameter do [mm]
.--. lo.. 0.40 pressure: 3000 bar
c 80 0.30 focus: IF
=
40 mm.£:I
E hose length: 4 m
...._.
0.25
::3 hose diameter: 6 mm
N
c.. 60 0.20 without abrasive
Q)
lo..
::l
0.15
en 40 en
e
c.. c:: 200
:0:: (,)
::l
en
0
0.8 1.0 1.2 1.4 1.6 1.8 2.0
focus diameter d
F'[mm]
Figure25 Effect of focus diameter on pressure loss
Additionally rapid changes of the pressure loss indicate irregular changes in tool beha-viour. The reasons could be changes in the condition of transport, damages of the water jet nozzle or changes in alignment of water jet and focusing tube due to a collision with the workpiece. Measuring the air flow rate or, better, the pressure loss gives the oppor-tunity to detect such defect.
B.2.3. Control of the cutting result
For remote controlled operation of the abrasive cutting process a special method is necessary to detect the cutting result. In case of using abrasive water jets optical and mechanical sensor systems are difficult to apply. Because of the suspended particles the optical conditions in the water are very bad, additionally optical parts and mechanical systems can be destroyed by reflected abrasives. The produced kerf is very small so there is no possibility to bring in sensor systems.
Additionally when cutting irregular structures (offshore structures with marine growth) all contacting sensor systems are not applicable because of the risk of sticking.
So the measurement of the sound pressure (according to #2 of fig. 19) seemed to be one useful method to detect the cutting result, because it is a non-contacting system which also is not sensitive against the particle load. To distinguish between cutting through and kerfing sound frequencies were analysed.
"' s::::
Q)
s::::
0
Figure26
500 1000 0
frequency in Hz
0
Sound analysis of cutting through
500
time in s 8
1000 frequency in Hz
frequency in Hz
1000
The upper part of the figure gives the sound intensity, the lower part gives the
frequen-cy analysis.
This analysis shows a significant maximum between 400 and 500 Hz. The signals were analysed up to frequencies of 1000Hz. Higher levels show no significant intensity. The position of the hydrophone was fixed by carrying out different preliminary tests. The optimal position for a good sound pressure input seems to be quite close to the surface of the workpiece upside (close to the cutting head). The instrument should not be fixed in the reflection zone of particles but perpendicular to the feed direction of the cutting head. All tests were carried out with this measurement geometry.
CD
....
;::, en en
~
a..
"'0
c:
;::,
0
en
0
~
FFT
en
c:
CD
-
c:·-
~---~---~250
625
frequency in Hz
>-==
en1000
~
FFT
UJ
c:
CD
time
8
in ss=
~wan•·-
~---~~---~250
625
frequency in Hz
1000
~ ~~r~~~~~~~~
-.E
~---~---~ frequency1000
in Hz250
625
Figure27 Sound analysis of kerfing
The measured value for the sound pressure in case of kerfing is not as constant as for cutting through. For this reason, also frequency analysis are different at different times.
0
···~~~1~~···
u,.~~~i
500 frequency in Hz
1000 0
~~~t~~~~~~~~~~
.
~
500 frequency in Hz
1000
Unfortunately for a number of kerfing and cutting tests different results were obtained. Also cutting through causes different frequency maxima for constant cutting parame-ters. Figure 28 gives different frequency analysis of cutting through and kerfing. There is no significant difference to distinguish kerfing and cutting through.
All the tests were carried out on standard samples (size, material) under similar condi-tions (cutting parameters, position in the water basin). So, there should be no influence of these parameters on the results.
But, unfortunately, the frequency analysis does not seem to be a reliable method to detect the cutting result, because besides the results of figures 26 and 27 different analy-sis are occurring often, too. Up to now there isn't found out any reason for this scatter-ing of the occurrscatter-ing frequencies.
Also differences in the sound intensity have not been reproducable. So they can't be used for the detection of the cutting result, either.
Finally, there are differences in the sound pressure signal for kerfing and cutting through (cutting through: constant intensity - kerfing: changing intensity like in fig. 27) but to use these differences for controlling the cutting result during cutting a specialised equipment is necessary.
For this reason another method to detect the case of kerfing has been tested /8/. A deflector plate was fixed at the cutting head (see #5 in fig. 19) and an accelerometer was adapted. During kerfing the reflected jet hits the plate and the accelerometer can detect the excitation of the plate. When cutting through there is no excitation of the plate.
During preliminary tests the optimal position and size of the plate was tested. It is necessary to take care about the wear of the deflector plate due to the reflected parti-cles. On the other hand the measuring position has to be close enough to the kerf to receive signals which are significant for kerfing.
Especially for deep kerfing the reflected particles are slowed down by the friction at the shoulder of the cut. To reach a sufficient impact on the deflector plate the distance to the surface of the sample has to be 10 mm or less. Due to this small distance there is a high rate of wear on the plate for kerfing not as deep as mentioned.
0.0
start of
the jet
--+-cuHinll
direchon
IJ
start of
kerfing
SEC
start of
cuHing
through
free jet In water
300.000
time
W!!I/LJ}jJ!JJfJfl
DflJVJJJfA
sample of steel,~ ~ '\: max. 20 mm thickness
..;L
Figure29 Signals for cutting through and kerfing,
measured by deflector plate and accelerometer
The first peak is caused by opening the water jet valve. When kerfing there is a signal produced by the reflected particles (left side of the sample). In case of cutting through there is no excitation of the deflector. When the abrasive water jet runs in water without cutting bubbles hit the deflector (right side of fig. 29); when cutting through the work-piece it is like a shield - no bubbles can reach the deflector.
During a series of tests sometimes a time delay was measured regarding the signal when changing from kerfing to cutting through. This effect is caused by particles, which are reflected from the shoulder of the kerfed workpiece. Because of the track of striation the particles hit the part of the sample which was already cut (see fig. 30).
abrasive
cutting
head
m
. .
deflector~~~
Changing from cutting to kerfing causes a significant signal in time. For normal applica-tion this is the more interesting situation because in cause of kerfing only the traverse speed has to be lowered immediately.
To make the method of detection more reliable it can be combined with a suction device as shown in figure 31.
abrasive water jet high pressure water
t
accelerometer abrasivesworkpiece hood
reflected jet abrasive water jet
workpiece
[image:33.566.34.494.192.468.2]Different reflection conditions
Accelerometer and hood
Figure 31 Deflector plate and suction hood
During kerfing the angle of reflection changes periodically due to the machining proc-ess. Also when producing very deep kerfs or very small kerfs the detection of the re-flected particles is difficult because the friction between the rere-flected jet and the shoul-der of the cut is quite high. So the kinetic energy of the particles reaching the deflector plate is low. This facts might cause problems in measuring the impact of the reflected particles by the deflector plate. In addition it seems to be useful to reduce the spreading of the secondary waste. To protect the environment from reflected particles a suction device can be used during kerfing. Inside of this device, as shown in figure 31, the de-flector plate can be adapted.
air or adapting a cyclone to separate the solid particles can give this additional informa-tion.
When cutting through often it is not possible to fix a suction device at the cutting head to move it during cutting on the backside of the workpiece to suck away the used abra-sives. The reason is that in most cases the backside is not accessible or structures are too big to move a suction hood parallel. But when kerfing 90 % of the thickness of the workpiece during a first pass and cutting through the remnant with a much higher tra-verse rate in a second pass it can be a useful method to catch as much waste as possible.
Summing up only the analysis of changes of sound intensity during cutting resp. kerfing has the potential to be a method to control the cutting result when research work will be done in future.
Measuring the present intensity of the sound only or analysing the frequency of the sound signal are no sufficient methods for supervising the cutting process.
The method of using the reflected jet to excite an accelerometer gives sufficient results. It is possible to distinguish between cutting through and kerfing by measuring the inten-sity of the excitation of the plate. This measuring method is also non-contacting and easy to apply. The reliability of this technique can be increased by combining it with the detection of the air or particle amount in the flow sucked away by a special hood.
B.3. Methods to replace worn parts of the cutting head
When cutting large structures remote controlled under water it can be necessary to replace worn parts of the tool by handling systems. In case of abrasive water jet cutting mainly the focusing nozzle has to be changed.
The tool life for a normal tungsten carbide nozzle (as used as state of the art up to 1991) is about 5- 10 hours, however these values depend on the chosen cutting parameters. But new developments in material science result in more resistant materials for these nozzles. Since 1991 a substitute of the Dow Chemical Company in USA sells focusing tubes out of composite carbides, which have a highly increased tool life /9/. Figure 32 gives the comparison of both kind of nozzles.
..., E E ... Cl)
-
::I 0"'
::I 0 0--
0 1.2-1.11
-tungsten carbide
o-··EJ
.P.-··..
rzrr ... ______ c , ...---,.
_.-cr····_ .• ---'---··;om posite carbide
... 'a c , ...
o---...
--... c pressure: 3000 bar
nozzle diameter: 0.25 mm
~ 0.9 -t;• focus length: 40 mm
-
Cl)E abrasive: Garnet "Minersiv", 8 g/s
0 -o
0.8~~~~~.~~~.~-r~~-r,-~-~,-r,-r~,~~TJ.r~,
0 500 1 000 1500 2000 2500 3000
operating time [min]
Figure32 Wear rate of focusing nozzles
Figure 33 gives the influence of the diameter of the focusing nozzle on the attainable depth of cut.
35
30
,...,
~
25...__,
't: 20
CD
-¥.
0
15 .s::.-
g-10 -o 5...
+ - - - · - ----·----
2 mm--+ 10 mm
pressure: 3000 bar
nozzle--: 0.30 mm
focus length: .W mm
traverse rate:
100mm/mln abraslv: Mlnerslv
m:
12 g/ssample mat.: 1 • .4301
'---
• • • 20 mm nozzle-sampledistance
0~--~---r--~---T--~--~~--r---T---~--~
0.8 0.9 1 1.1 1.2 1.3 1.4 1.5 1.6 1.7 1.8
focus diameter [mm]
Figure33 Effect of focus diameter on attainable depth of kerf
enables to cut up to 100 h without changing the focusing nozzle for the given conditions. Especially the kind of abrasive has an important effect on the wear rate. For corundum the tool life is less than 10 % of the tool life for garnet sand.
But for normal cutting jobs (steel, aluminium, concrete) the properties of garnet sand are a good compromise between wear of the tool and cutting efficiency.
So, for the given cutting conditions, the tool life of the focusing nozzle has reached the same level as the life time of the water jet nozzle. Due to this fact it does not seem to be useful to adapt a handling system, which is able to replace the focusing nozzle remote controlled. For maintenance work the whole tool (water nozzle, focusing tube,
align-ment, condition of the mixing chamber, status of the abrasive feed hose) has to be checked; for that purpose the tool has to be removed from the cutting job to a job shop anyway.4. Characterisation and handling of secondary waste
To reduce the waste produced by cutting with abrasive water jets at first cutting param-eters have to be optimised. This is done under B.l.
On the other hand for the treatment of the remaining waste it is necessary to quantify and analyse the sedimented waste as well as the aerosols. Results of doing so are given in the following.
B.4.1. Preparation of the test facility
To characterise the produced waste tests were carried out in cooperation of IW and
CEA. In a hermetically sealed water basin steel and copper samples were cut and
kerfed. Particles suspended in water as well as aerosols were measured and analysed. Figure 34 shows the setup of the test equipment.
air inlet
Figure34 Water basin
basin
air qu tlet
The top of the basin was covered by a plate. The traverse mechanism of the cutting head was sealed against this plate. All the water used for cutting as well as the suspend-ed particles remainsuspend-ed in the basin. After settlement the ssuspend-ediments were removsuspend-ed and analysed. Water samples were taken to quantify suspended particles a certain time after finishing cutting.
The plates to be cut were either placed underwater (for cutting and kerfing underwater) or the water level is lowered to cut in air. However water is kept in the tank in order to absorb the water jet.
The experimental device with the associated samplings is schematised on the figure 35 (comparable to the tests described in /10/); a view of the exhaust duct with some sam-plings and the cutting basin is given in figure 36.
TANK
Figure35
ABRASIVE WATER JET
TOOL
Driers Pump
Schematic drawing of the ventilation system and the associated samplings
Figure 36 View on the exhaust duct with associated samplings (right) and the cutting basin with the water jet valve (left)
The ventilation circuit is composed of an inlet HEP A filter (in order to filtrate the air entering into the tank), an integral filter of 160 mm diameter (in order to collect all the aerosols drawn into the exhaust duct), an orifice plate (which has been calibrated and allows to know the flow rate) and a fan. The ventilation flow rate is set up to 24 m3 .h -1. Nozzles are installed in the exhaust duct to allow isokinetic sampling into:
- a filter of 130 mm diameter - a filter of 4 7 mm diameter - an Andersen impactor
Total aerosol mass concentrations are measured by filtration and weighing. The fibre glass filters are 130 mm and 47 mm in diameter. They have a collection efficiency of more than 99.99% for particles of size superior to 0.3 micrometer.
The Andersen impactor in which the collection of particles is made on 8 stages allows to determine the aerosol size distribution between 0.35 and 15 micrometers.
The exhaust duct and the pipes until the sampling filters are heated with a regulated heating cable in order to avoid any condensation.
The three dryers put in series after the sampling filters enable to know the quantity of vapour water drawn into the exhaust duct. Dryers are also put between the impactor and the pump for its protection.
The sedimented drosses are collected manually at the bottom of the tank and their size distribution is determined with the use of several sieves which openings are respectively 0.032, 0.063, 0.125, 0.250 and 0.500 mm.
by filtration and weighing. The samples of water (11) were taken 5 minutes after the end of cutting or kerfing.
When the cut took place under water, an hydrogen analyser was being used which sampled the air after the integral filter in the exhaust duct.
About 80 samples (suspended particles in water, abrasives, and mainly deposits on fil-ters) have been analysed by ICP (Inert Coupled Plasma) in order to measure the pro-portion of several elements (Cu, Fe, Mg, Ni, Cr).
Figure 37 gives a diagram of the investigated masses and their abbreviations used in this report.
w: water
a: a brasive
emoved
m: r
m at erial
w a, m
aerosol s
water su~en
pa icl
ded
es
II
abrasiveworkpiece
at ria I loss on
t-45: m e
focusing tube
cutting
process a, m
a, m
sedime
II
dross
Figure37 Diagram of material flow
The common operating conditions were as follows:
-volume of the tank: - pressure of water: -nozzle:
- focus diameter: length: -abrasive:
- size distribution of abrasive: - water flow rate:
1.140m3 3.000bar 0.25mm
lmm
40mm
Garnet Minersiv see figure 38 1.631/min
II
- standoff distance:
- air ventilation flow rate: - air flow rate cutting bead:
80 70
2mm
24m3/h 2m3/h
63.15%
unused abrasives
..--. 60
~
...
(I] 50 (I]
c E 40
CD > ·c;:; 30
c
L..
..0 20
c
10
0
Figure38
0 100 200 300 400 500
particle size
[JL
m]
Size distribution of unused Garnet "Minersiv"2.27% 0.07%
600 700 BOO
The used copper plates were out of Cu 99.9 %; the steel and abrasive compositions are indicated in the tables I to IT.
Duplex steel: 60 % ferritic, 40 % austenitic
c Si Mn p s Cr Mo
min(%)
-
-
-
-
-
21.0 2.5max(%) 0.03 1.0 2.0 0.03 0.02 23.0 3.5
Table I Steel composition
Co~position of abrasives (Garnet)
Table II
Al203 FeO Si02
MnO
CaO
MgO
20 %
30 %
36%
1 %
2%
6%
Composition of abrasive garnet "Minersiv"
Ni N Fe
4.5 0.08 63.7
Copper was chosen as material to be cut in order to distinguish by chemical analyses the secondary emissions coming from the cut plate on one part and from the abrasives on the other part (Garnet contains an important proportion of FeO).
The duplex (austenitic/ferritic) steel was chosen to find cut material by magnetism.
B.4.2. Measurement and characterisation of the secondary emissions
Eight experiments were carried out in a first series as indicated in table ill.
No. of Material Material Abrasive
Operation Place thickness flow rate
experiment nature
(mm) (g/s)
1 cutting underwater copper 10 7.2
2 cutting a1r copper 10 6.8
3 cutting air steel 10 6.8
5 kerfing air copper 20 6.3
6n
kerfing underwater copper 20 5.98 kerfing air steel 20 7.1
9 cutting air copper 10 3.4
10 cutting air copper 10 1.8
Table ill Main features of the experiments
The total secondary emissions were evaluated for all the experiments (see fig. 37). The sedimentation times were very different, so suspended particles for some experiments had no time to sediment. The sedimented dross on the walls and on the bottom of the tank were collected after 16 hours (a night) for the experiments No. 1 and No.2.
The sedimentation behaviour for test No. 1 is shown in B.4.4 together with other results (fig. 53).
The thickness of the plates of copper and steel was 10 mm for cutting and the depth of kerfing was 15-18 mm (experiments No.5 and No. 6/7) and 17-19 mm (experiment No.
8).
A) Balance of secondary emissions
Solid emissions
Sedimented Suspended Water in Aerosols Cut Material Operation Cut length Workpiece Used dross particles Aerosols Used exhaust duct
No. thickness place mass loss abrasive g.m·•
"
g.m·•"
water g.m·•"
g.m·>mm g.m·• g.m·• g.m·•
"
TC g.m·• of usedTC TC water of cut edge
I copper cutting 6 528 99.6 3 074.4 3 003.5 97.5 77 2.4 1.210~ II 688 4.7 1.2 l!t2
IOmm underwater 3.6 10 .. 0.04
2 copper cutting 6 528 110.1 2 914 2 819.2 . 0.027 II 688 19.5 2.7
IOmm in air 9.71~ 0.17
3 steel cutting 3672 80.3 3704 3 464.9
-
0.035 14 788 23.6 3.5IOmm in air 9.8 10~ 0.16
5 copper kerfing 3612 158.5 2693 2 674.6 - 0.136 11 683 194.9 8.2
20mm in air 5 l!t' 1.7
617 copper kerfing 6 533 152.9 2 532 2 324 98.7 31.5 1.3 71~ 11 619 5.5 4.2 l!t2
20mm underwater 3.1!t' 0.05
8 steel kerfing 3672 143.5 3 860 3 196.3 - 0.211 14 788 268 11.7
20mm in air 6.5 l!t' 1.8
9 copper cutting 6 528 100.3 1 862 I 419.1
-
0.0165 14 813 40.4 1.65IOmm in air 1.1 l!t' 0.27
10 copper cutting 6 528 98.0 I 534 I 515.5 - 0.0136 23 284 71.1 1.36
IOmm in air 8.81~ 0.30
[image:42.572.75.515.382.748.2]TC = total solid mass collected
Table IV Recapitulative secondary emissions results
For the given working conditions following results can be given:
- 4.10-6% to 7.10-3% of the total solid mass is drawn into the exhaust duct (M4).
- When the cutting or the kerfing takes place underwater (depth= 100 to 200 mm), the quantity of aerosols is divided by about 200 (comparison between experiments No. 1 and 2 and experiments 5 and 6/7).
- The amount of aerosols increase linearly with the amount of used abrasives (fig. 39).
,...-,
~
0.030-C )
• d·
.
...
0.025-
.-·
E
.
,.,,~..
.
-~
.-··
Q)
.-0.. 0.020- ,., .. ''
en •' pressure: 3000 bar
en
.-·
nozzle-¢: 0.25 mm0
J!J.-E 0.015-
-·
.. ..
focus: dr = 1.0 mm-
~--· lr = 40 mm0
-·
distance: 2 mm-in airen
0 0.010- abrasive: Minersiv
~
Q) sample mat.: 1.4301
0
-o Q)
0.05--
0 ~Q)
0
c I I ' I
Q)
C) 0
500 1000 1500 2000 2500 3000
used abrasive mass per m [g/ m]
- The kerfing produces three to four times more aerosols than the cutting as indicated in the table V.
Aerosols Aerosols
g/m'- g/m
1"/kg Aerosols bv kerfing
of cut edge of used abrasives Aerosols by cutting
per meter
Copper kerfing underwater 4.2 10"2 1.7 10"2 4.3
Copper cutting underwater 1.2 1()•2 0.39 10"2
Copper kerfmg in air 8.2 3.0 3.2
Copper cutting in air 2.7 0.93
Steel kerfing in air 11.7 3.0 3.2
Steel cutting in air 3.5 0.94
TableV Comparison of aerosol production by kerfing and cutting
There
is no significant difference between copper and steel.
The water placed beneath the plate when the cutting takes place in air probably mini-mises the amount of aerosols.
- 1 to 3 % of the total solid mass is composed by suspended particles (M3) when the operation takes place under water.
The kerfing induces less suspended particles (754 g/(m2*kg/m)- mass of suspended particles per m2 of shoulder of the cut and per kg of used abrasive per meter) than
the cutting (2505 g/(m2*kg/m)).
By chemical analyses of the water of experiments No.2 and No. 6/7 (annex 3) it can be noted:
- taking into account the composition of the abrasives there is a good agreement between the chemical results and the mass M3 of suspended particles indicated in the sheets of annex 1 (within 13 % ),
- the proportion of copper and abrasives in solution in the sampling bottles three months after the experiments is in the range 1 to 3% for copper, inferior to 0.1% for particles of abrasives,
- the ratio of
mass of particles of copper
mass of particles of abrasives + mass of particles of copper
This seems to indicate that the particles of copper suspended in the water after an operation underwater (kerfing and cutting) have a smaller diameter than the particles of abrasives because the ratio mentioned above is higher than the same ratio in sedi-mented dross (3 to 5.7 %) for the two concerned experiments, and this whereas the density of copper is higher than the density of abrasives. The sedimentation of copper needs more time.
- The remainder of the solid emissions is composed by dross sedimented in the tank (Ml).
The proportion of abrasives in the sedimented dross is dependent on the type of operation (cutting or kerfing), the nature of the material and of course the flow rate of abrasives as indicated in the table VI. As sedimented dross represents almost all
the solid secondary emissions especially when the operation takes place under water, the ratio
used abrasives
used abrasives + workpiece mass loss
can be considered coarsely as a representative of the proportion of abrasives in the sedimented dross.
Operation Abrasive % of abrasives
Cut
Material flow rate in the sedimented
No. place gls dross
1 copper cutting underwater 7.2 97.0
2 copper cutting in air 6.8 96.4
3 steel cutting in air 6.8 97.9
5 copper kerfing air 6.3 94.4
617 copper kerfmg underwater 5.9 94.3
8 steel kerfing in air 7.1 96.4
9 copper cutting in air 3.4 94.9
10 copper cutting in air 1.8 94.0
Table VI Proportion of abrasives in the sedimented dross
The proportion of abrasives in the sedimented dross increases for cutting (compared to kerfing), for steel (compared to copper) and there is no difference for operation in air
[image:44.576.75.502.437.694.2]LiQ.Uid emissions ( vapours)
Between 0.15 to 2 %of the used mass of water is drawn into the exhaust duct (M2), mainly in the vapour phase.
The kerfing induces 10 times more water in the exhaust duct than the cutting in air. Underwater operation decreases the amount of water in the exhaust duct compared to operation in air (divided by 4 for cutting and 35 for kerfing).
B) Size distribution of abrasives and sedimented dross
The size distributions of abrasives are illustrated by the figures 40 to 43.
The analysed samples are a mixture of samples taken at different places in the basin. According to the location of sampling a wide spread of results regarding the size distri-bution occurs.
Figures 40 and 41 give the comparison of cutting and kerfing for application in air (right) and under water (left).
40 35 30
g
"' 25
"'
~ 20
~ 15
;;;
~ 10
~ 0 5
0
40 35
~ 30
~
"' 25
"' ~ 20
~ 15
;;;
~ 10
0 5
0 0
0
cutting copper under wafer 7.2g/s ( mixture )
24.4
0.2
100 200 300 400 500 500 particle size (JLm)
kerfing copper under water 5.9 g/S ( mixture )
0.02
100 200 300 400 500 600 particle size (JLm)
pressure: 3000 bar focus: dr=1mm/~=40mm nozzle: 0.25 mm abrasive: Garnet "Minersiv"
40 35 30
E
.. 25.,
~ 20
: 15
·u;
~ 10
~ 0 5
40 35
~ 30
~
"' 25
"' ~ 20
~ 15
;;; e 10
~ 0 5
34.3 cutting copper in air 6.8 g/s {mixture)
21.7
0.08
1 00 200 300 400 500 600 particle size (JL m)
kerfing copper in air 6.3 g/s ( mixture )
0.06
0~~~~~~~~~~~~~~
0 100 200" 300 400 500 600 particle size (JL m)
pressure: 3000 bar focus: dr=1 mm/lr=40mm nozzle: 0.25 mm abrasive: Garnet "Minersiv"