A PROSPECTIVE STUDY OF CLINICAL PROFILE
OF EMPHYSEMATOUS PYELONEPHRITIS IN
TYPE 2 DIABETES MELLITUS
Dissertation Submitted to
THE TAMILNADU DR. M.G.R MEDICAL UNIVERSITY
In Partial Fulfillment of the Regulations For the Award of the Degree of M.D. (GENERAL MEDICINE)
KILPAUK MEDICAL COLLEGE
1
E STUDY OF CLINICAL PROFILE
EMPHYSEMATOUS PYELONEPHRITIS IN
TYPE 2 DIABETES MELLITUS
Dissertation Submitted to
THE TAMILNADU DR. M.G.R MEDICAL UNIVERSITY
CHENNAI
In Partial Fulfillment of the Regulations For the Award of the Degree of
(GENERAL MEDICINE) - BRANCH – I
KILPAUK MEDICAL COLLEGE HOSPITAL CHENNAI
April - 2013
E STUDY OF CLINICAL PROFILE
EMPHYSEMATOUS PYELONEPHRITIS IN
2
CERTIFICATE
This is to certify that the dissertation entitled “A PROSPECTIVE STUDY OF CLINICAL PROFILE OF EMPHYSEMATOUS
PYELONEPHRITIS IN TYPE 2 DIABETES MELLITUS” is the
bonafide work of Dr.V.Nandakumar in partial fulfillment of the university regulations of Tamil Nadu Dr. M.G.R. University, Chennai, for MD (Branch I) General Medicine examination to be held in April 2013.
Prof. P. RAMAKRISHNAN M.D., D.L.O
The DEAN
Govt.Kilpauk Medical College Chennai -600 010.
Prof. Dr. N. Gunasekaran M.D., DTCD
Medical Superintendent & Director INCD Professor and HOD,
Department of Medicine KMC & GRH
Chennai
Prof. Dr. T. Ravindran M.D.,
Professor and unit chief, Department of Medicine, Kilpauk Medical College,
3
DECLARATION
I, Dr. V.Nandakumar, hereby declare that, I carried out this
work entitled “A PROSPECTIVE STUDY OF CLINICAL PROFILE OF EMPHYSEMATOUS PYELONEPHRITIS IN TYPE
2 DIABETES MELLITUS” at Govt. Kilpauk Medical College
Hospital, under the guidance of Prof. Dr. T. Ravindran, MD, Professor of Medicine. I also declare that this bonafide work has not been submitted in part or full by me or any others for any award, degree or diploma to any other University or Board either in India or abroad. This is submitted to The Tamil Nadu Dr. M.G.R. University, Chennai, in partial fulfilment of the university rules and regulations of for MD degree examination in General Medicine (Branch I) to be held in April 2013.
Place: Chennai
4
ACKNOWLEDGEMENT
I sincerely thank our Dean, Dr. P. Ramakrishnan MD DLO, for permitting me to conduct this study in Govt. Kilpauk Medical College Hospital.
I express my deep indebtedness to Prof. Dr. N. Gunasekaran
MD DTCD, Medical Superintendent & Director INCD, Professor and Head of the Department of Medicine, Kilpauk Medical College, for allowing me to do this study under his able supervision and valuable guidance.
I express my sincere thanks to my chief, Prof.Dr. T. Ravindran
MD, who gave me proper guidance, protocol and immense help in conducting the study.
I express my sincere thanks to Prof.Dr.N.Gopalakrishnan MD.,
DM., MRCP., Professor and Head of Department of Nephrology,
RGGGH, Chennai who allotted me the topic during my first year of MD Course and guided me till i complete the study.
5
express my gratitude to the Assistant Professors in the Department of Nephrology, KMCH, Dr. S.Elango, MD., DM.,. Dr. Ramesh, MD., DM., Dr. Jayakumar, MD., and Post graduates of Nephrology Dr.P.K. Senthilkumar, MD., Dr.V.Kannanbaba MD., Dr C.Vasudevan., MD., for the advice and help rendered me. \
I express my gratitude to Prof. Dr. Madhavan MD, Professor and Head of the Department of Diabetology Prof. Dr.Nagendran MD.,
Professor and Head of the Department of Biochemistry,
Prof. Dr. J. Devi Meena, MDRD., Professor and Head of the
Department of Radiology, Prof. Dr. Thyagarajan Ravinder, MD. Professor and Head of the Department of Microbiology for providing the facilities to conduct the investigations used in this study.
My sincere thanks go to Prof. N.Raghu MD & Prof. Rajendran
MD, our past HOD &Unit chief, for inspiring me in my academic work.
I express my sincere and heartfelt gratitude to
Dr. A. Marimuthu, MD., Dr. D. Radha MD and Dr. G. Panneer
Selvam MD, Assistant Professors in Department of Medicine for their
6
I am very grateful to Dr.T.S.Santhi MD, Dr. J. Manickavachagam MD & Dr. Anand MD, former Assistant
Professors in Department of medicine, for their extensive support and guidance. I am greatful to my Post graduate colleagues for all the timely help they rendered.
7
TURNITIN ANTI- PLAGIARISM SITE SCREEN
8
TURNITIN ANTI- PLAGIARISM SITE
12
TABLE OF CONTENTS
S. No CONTENTS PAGE NO
1 INTRODUCTION
1
2 AIM OF THE STUDY
2
3 REVIEW OF LITERATURE
3
4 MATERIALS AND METHODS
35
5 STATISTICAL ANALYSIS
38
6 DISCUSSION
69
7 CONCLUSION
75
8 APPENDIX
BIBLIOGRAPHY
PROFORMA
MASTER CHART
13
INTRODUCTION
Emphysematous Pyelonephritis is a rare, potentially fatal necrotising infection of renal parenchyma . It is caused by gas forming organisms like E.coli, Klebsiella, Proteus. The pathogenesis of emphysematous pyelonephritis is not clear. It occurs mostly in diabetes mellitus patients. But it also occurs in patients with obstruction of urinary tract. The other risk factors for emphysematous pyelonephritis are renal stones and instrumentation of urinary tract.
Patients may present with varying clinical features like loin pain, fever, vomiting, renal failure, shock. The case fatality ratio is very high. However with the advent of Computer tomography the diagnosis can be made at a earlier stage of the disease. With aggressive management of emphysematous pyelonephritis with appropriate antibiotics, surgical drainage and nephrectomy, if required the mortality has been decreased in the last decade.
14
AIM OF THE STUDY
1. The aim of this study is to evaluate the
Predisposing factors
Clinical features
Causative organism
Mode of therapy required for emphysematous pyelonephritis in type 2 diabetes mellitus patients.
2. To evaluate the outcome of emphysematous pyelonephritis in type 2 Diabetes mellitus in our population.
15
REVIEW OF LITERATURE
Diabetes mellitus is probably the most widely prevalent metabolic disorder among the world population. The incidence of diabetes mellitus is increasing day by day both in global and Indian scenario. The prevalence of diabetes is 2.8% in 2000, but this figure will reach 4.4% in 2030 worldwide.
16
Prevalence in Indian scenario: Increasing trend
RISING TREND OF T2DM IN URBANIZED INDIAN CITIES AND THEIR
PROJECTED OUTLOOK []
17
As of 2011 there are 61million diabetics in India. Recent Chennai Rural Urban Epidemiological Study [CURES] had showed a crude prevalence rate of 14.3% [ age adjusted],with in a span of 14 years the prevalence had increased alarmingly by 73%[75].
18
GLYCOSYLATED HEMOGLOBIN (HbA1C)
Glycation refers to non-enzymatic addition of a sugar residue to an amino group of a protein. Hemoglobin, plasma proteins, lens protiens etc., may undergo glycolysation. HbA1C forms the major fraction (80%). In HbA1C the N-terminal valine residue of each beta chain gets glycated.
19
diabetes during the initial visit and every three months to assess metobolic control .
Normal HbA1C values and interpretations
Normal range 4.5 – 5.8%
Risk of hypoglycemia < 4.5%
Diabetic range > 6.5%
Prediabetic range 5.8 – 6.5%
HbA1C % Mean plasma glucose (mg/dl)
5 97
6 126
7 154
8 183
9 212
10 240
11 269
20
DIABETES AND KIDNEY
Diabetes has become the most common cause for chronic kidney disease all over the world. In type 1diabetes, nephropathy occurs 25 to 40 years after diagnosis and his seen in about 25 to 40% of patients. In type 2 diabetes, nephropathy will be present in 5 to 10% of patients at the time of diagnosis itself. The cumulative incidence is 25% after 20 years of diagnosis.
Diabetic nephropathy is a clinical syndrome characterized by persistent albuminuria ( > 300 mg / 24 hours or > 200 mcg / min) on atleast 2 occasions separated by 3 – 6 months. Albuminuria > 300 mg / 24 hours is equivalent to a total proteinuria > 500 mg / 24 hours. This is also called as macroalbuminuria. Urine albumin excretion of 30 – 300 mg / 24 hours or 20 – 200 mcg/ min is microalbuminuria.
Stages of diabetic nephropathy
Carl Eric Mogensen’s classical description in 1983 of the five stages of diabetic nephropathy was for type 1 diabetes mellitus. However the general pattern remains the same for type 2 diabetes mellitus. The stages are as follows:
21
Stage 2 – Stage of apparent normalcy
Stage 3 – Stage of microalbuminuria or incipient nephropathy
Stage 4 – Stage of established nephropathy
Stage 5 – End stage renal disease
Pathogenesis of diabetic nephropathy
The primary insult to the kidneys is due to hyperglycemia. Hypertension and proteinuria worsens the nephropathy. It is postulated that increase in glucose leads to oxygen free radicals generation that result in nephropathy. Four pathways - protein C kinase pathway, polyol pathway, hexoaminase pathway and formation of advanced glycation end products result in over production of cytokines which induce fibrosis and increase vascular permeability. Accumulation of protein in tubular cells initiates mesenchymal cell transformation leading to chronic tubular injury.
22
INFECTIONS ASSOCIATED WITH DIABETES MELLITUS
Infections associated with diabetes mellitus can be discussed under two headings.
Infections with an increased prevalence in patients with DM
• Oral and esophageal candidiasis
• Bateriuria and cystitis
• Pyelonephritis and perinephric abscess
• Surgical site infection
• Cellulitis and osteomyelitis
• Pyomyositis
• Tuberculosis of lung
• Staphylococcal and gram negative pneumonia
Infections unique to patients with DM
• Rhinocerebral mucormycosis
• Malignant otitisexterna
• Synergistic necrotizing cellulitis
• Fournier’s gangrene
• Emphysematous cystitis
• Emphysematous pyelitis
23
EMPHYSEMATOUS PYELONEPHRITIS
Emphysematous pyelitis is the term used to describe the presence of gas limited through renal excretory system. Emphysematous cystitis is due to inflammation of bladder mucosa and its musculature. Emphysematous pyelonephritis is defined as necrotizing infection of renal parenchyma and its surrounding tissues. Gas accumulates in renal parenchyma, collecting system or perinephric tissues. It carries a mortality of 100% if left untreated.
History and epidemiologyemphysematous pyelonephritis
Emphysematous pyelonephritis was first reported in 1898 by Kelly & Mac Cullum as a case of pneumaturia as they found it is a gas forming renal infection. Since then various names like renal emphysema, pneumonephritis, are used. In 1962 Schultz & Kloferin proposed the name emphysematous Pyelonephritis.
Epidemiology
24
in them. The male : female ratio is 7:1. Right kidney is less commonly affected than the left may be due to preponderance of left sided urinary tract obstruction. In ten percent of cases both the kidneys are involved.
Almost all the patients are diabetic with poor blood sugar control with elevated glycosylated hemoglobin. Rarely few cases occurs in non – diabetic population . Other risk factors for this rare disease are renal failure, obstructed urinary tract, previous history of instrumentation, renal stones, polycystic kidneys. The main cause of emphysematous Pyelonephritis in patients without diabetes is obstruction of urinary tract.
Etiology and pathogenesis
It is caused by gas forming organisms . E. coli is the most common organism.
Common organisms include:
• Escherichia coli (68%)
• Klebsiella pneumonia (24%)
• Proteus mirabilis
25
Rare organisms include:
• Clostridium perfrigens
• Citrobacter
• Aerobacter aerogenes
• Candidiasis
The exact mechanism of gas formation is not clear. The proposed cause for gas chamber formation are
• Increased gas production
• Due to poor blood supply there is decreased transport of gas
• Formation of gas chamber
• Equilibrium of gas chamber and tissue gas
• Expansion or collapse of gas chamber
Regarding the gas content many hypothesis are proposed. Usually bacteria get their energy by fermentation of glucose through glycolytic pathway. In 1889 nitrogen, hydrogen, and Carbondioxide were found in a patient with pneumaturia. The gases demonstrated are
• Nitrogen - 60%
• Hydrogen – 15%
26 • Oxygen – 5%
• Rarely methane, ammonia are also demonstrated in some studies.
Gas forming organism follow two different pathways namely,
1. Mixed fermentation - E. coli, Klebsiella, Proteus – Carbon dioxide 2. Butyric fermentation – Clostridium - hydrogen
[image:26.612.218.410.297.541.2]27
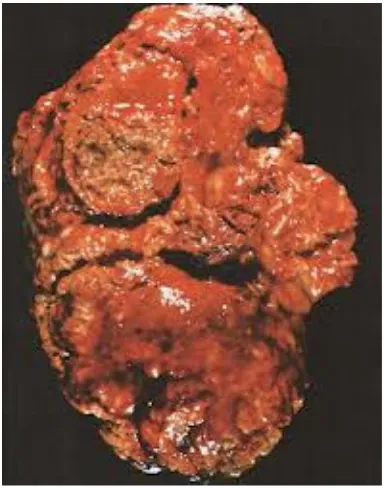
Fig - Cut cross section shows diffuse parenchymal necrosis and haemorhage
The pathogenesis of emphysematous pyelonephritis is poorly understood . Renal infarcts, thrombosis, abcess and necrosis are demonstrated in pathological specimen of emphysematous pyelonephritis. Four reasons are described for the occurrence of emphysematous pyelonephritis are
Bacteria that forms gas
Increased bacterial growth due to high blood sugar
Decreased tissue perfusion that leads to tissue ischemia and necrosis
[image:27.612.183.445.70.288.2]28
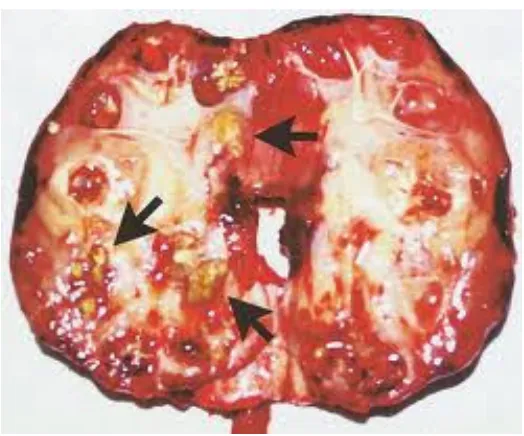
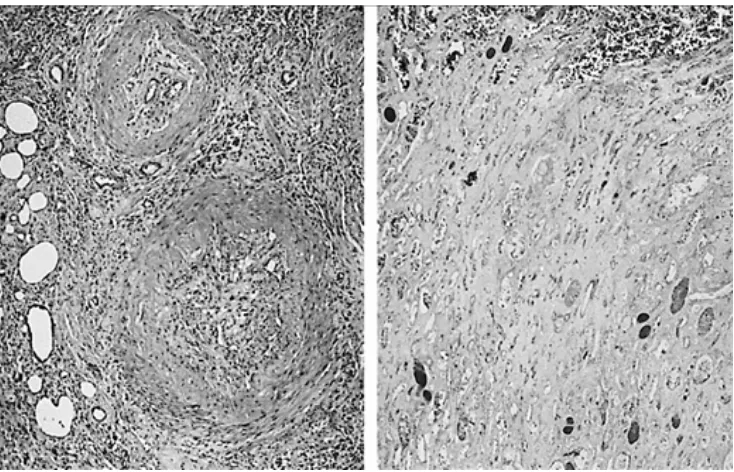
[image:28.612.131.498.72.308.2]Fig - Pathological specimen showing areas of renal infarction, vascular thrombosis in a patient with emphysematous pyelonephritis.
Fig - Histology showing renal infarction and glomerularscelorsis
E. coli and emphysematous Pyelonephritis
[image:28.612.221.406.409.548.2]29
accounts for 68% of cases of emphysematous Pyelonephritis. The various mechanisms by which E.coli causes emphysematous pyelonephritis are
• O serotypes interfere with compliment dependent bacterial killing.
• K antigens (capsular polysaccharide) or anti phagocytic and anti complimentary
• P fimbriae are mannose resistant. The receptor binding adhesin at the tip of P fimbriae is pab G and there are three classes of G – tip proteins. Class II – tip adhesin is associated with emphysematous Pyelonephritis. Class III– tip adhesin is associated with cystitis.
Other virulence factors of E.coli identified by Polymerase chain reaction:
• iroN, iron – regulated gene.
• Iha, homologue adhesion
• kpsMT, group II capsule
• ompT, outer membrane protease T
• USP , uropathogenic protein
30
Clinical features
Most of the patients with emphysematous pyelonephritis presents with pyrexia, pain over flank and vomiting. These clinical features do not differentiate upper urinary tract infection from emphysematous Pyelonephritis. Crepitus over the flank area may occur in late stages, but is characteristic.
The initial presentations of late stages of emphysematous Pyelonephritis may be
• Hypotension
• Decreased platelet count
• Altered sensorium
• Worsening renal function
• Subcutaneous emphysema
• Pneumomediastinum
31
The clinical features, routine blood and urine investigations are mentioned in the following table.
32
Laboratory investigations
Complete blood count will show increased total count with neutrophilia with a left shift. Platelet counts are decreased. Thrombocytopenia is one of the poor prognostic factors. Peripheral smear study will suggest features of sepsis.
Routine urine examinations will reveal plenty of pus cells, albuminuria which may be either due to acute kidney injury or preexcisting diabetic nephropathy. Urine spot protein creatinine ratio will be increased. Urine acetone positivity will suggest poor prognosis.
Urine culture will reveal the causative organism. Urine culture is positive in most of the patients. Antibiotics should be given according to sensitivity pattern. E.Coli, Klebsiella, Proteus are the common organisms grown in urine culture.
33
Blood culture is positive in forty to fifty percent of patients. Positive blood culture carries poor prognosis. Antibiotics should be given according to sensitivity pattern. Mixed culture pattern rarely occurs.
Imaging studies
Patients should be stabilised with fluids and appropriate antibiotics before radiological investigations. Emphysematous Pyelonephritis is classified radiologically using plain X ray KUB, Ultrasonogram KUB, non contrast CT KUB .
Plain X ray KUB
Langston and Pfsiter described three main radiological patterns
• Diffuse mottling of the renal parenchyma
• Bubbly renal parenchyma surrounded by crescent shape gas in perinephric space
• Extension of gas through gerota fascia
Michaeli suggested three stages
• Stage I – Gas within renal parenchyma or in the perinephric tissue
34
[image:34.612.216.410.148.282.2]• Stage III – Extension of gas through gerota fascia or bilateral disease
Fig - Stage III disease involving left kidney
[image:34.612.224.401.394.535.2]35
Fig – Dark arrow shows 2 cm calcification in left ureteropelvic junction White arrows show small calcifications. shows large air fluid level in left
upperpole .
[image:35.612.235.392.73.236.2]36
Ultrasonogram KUB
• Ultrasound findings.
o High-amplitude echoes within renal sinus and/or renal
parenchyma associated with "dirty" shadowing
"Comet tail" reverberations
o Kidney may be completely obscured by large amount of gas
in perinephric space
o Ring – down artifacts: air bubbles trapped in fluids
o Top differential diagnosis include: renal calculi,
nephrocalcinosis, papillary necrosis
Wan et al described two distinct types using X ray, USG, CT Abdomen,
Type I - Parenchymal destruction with streaky or mottled parenchymal gas with an absence of fluid collection. Mortality is upto sixty percent.
37
Few images of USG KUB are shown below
Fig - Long arrows shows multiple hyperechoic foci Small arrows shows dirty acoustic shadows
38
Fig - Long arrow shows high amplitude echoes represents air with fluid collection
[image:38.612.237.430.416.604.2]39
CT KUB
Noncontrast CT KUB is the is the most sensitive investigation for the diagnosis of this disease. It demonstrates the extent of disease, detects renal stone and points out obstruction of the urinary tract, if present.
Huang et al modified the staging proposed by Michaeli as follows
Class I – Gas confined to the collecting system
Class II – Gas confined to renal parenchyma
Class III A – Perinephric extension of gas
Class III B - Extension of gas beyond gerota fascia
[image:39.612.176.492.429.644.2]Class IV – Bilateral EPN or EPN in single functioning kidney
40
Fig – Class II disease. Gas in right renal parenchyma and right renal stone
41
Fig – Class IV disease Bilateral EPN
42
Fig – Emphysematous pyelitis with pyonephrosis and situs inversus
43
MANAGEMENT
The treatment of emphysematous pyelonephritis includes:
1. Medical treatment 2. Surgical treatment
• Percutaneous drainage
• Nephrectomy
Medical treatment
44
Surgical treatment
After stabilising the patient and doing CT KUB the need of surigical intervention is decided. Nowadays with the availability of potent antibiotics the role of surigcal treatment has drastically decreased. However CT guided percutaneous drainage is required in case of localised pus collection. This procedure has significantly reduced the mortality rate. Many recent studies have shown that emphysematous pyelonephritis can be sucessfully treated with antibiotics and renal replacement therapy alone. Huang et al has suggested that surgical intervention is required in late stages of emphysematous pyelonephritis. Class IV EPN is potentially fatal. But nephrectomy may be necessary in Class III and Class IV patients .
Since patients with emphysematous pyelonephritis may have associated diabetic nephropathy and chronic renal failure even after nephrectomy they may require renal replacement therapy postoperatively.
45
Chart - Algorithm for the management of EPN. risk factors - thrombocytopenia , shock, altered sensorium, acute renal injuriy
Prognostic factors
Poor prognostic factors are
Age more than 60 years
Long duration of diabetes mellitus
Preexisting diabetic nephropathy
Associated immuno compromised state
Associated obstruction of urinary tract
Previous history of instrumentation
Poor blood sugar control
46
Diabetic ketosis at admission
Acute kidney injury
Altered sensorium
Thrombocytopenia
Hypotension
Comorbid illness like Coronary artery disease, hypertension
Casuative organism – Clostridium, pseudomonas, fungal org
Class III A and Class III B disease
Class IV disease
47
MATERIALS AND METHODS
1. Study design
It is a prospective and observational study.
2. Study group
All type 2 diabetic patients presenting with urinary tract infection are screened with ultrasonogram of KUB. Ultrasonogram proven emphysematous pyelonephritis are included in this study.
3. Place of the Study
Kilpauk Medical College and Hospital
4. Period of Study
January 2011 – December 2012
5. Collabarating Departments
Nephrology department
Diabetology department
Radiology department
48
6. Conflict of interest
Nil
7. Inclusion and exclusion criteria
All type 2 diabetic patients (both males and females) more than eighteen years of age presenting with urinary tract infection are screened with ultrasonogram . Patients with ultrasonogram proven emphysematous pyelonephritis are included in this study. Patients who do not satisfy the above criteria are excluded from this study.
8. Consent
Informed consent is obtained from the patients before including them in the study.
9. Methodology
a. Clinical Examination
49
INVESTIGATIONS DONE
1. CBC with platelet count
2. Urine albumin, sugar, deposits, acetone, spot PCR 3. Urine culture and sensitivity
4. Blood culture and sensitivity 5. Blood sugar
6. Blood urea 7. Serum creatinine 8. HbA1C
9. Antibodies for HIV1 and HIV2 10.X Ray KUB
11.USG KUB 12.CT KUB
50
STATISTICAL ANALYSIS
Mean values of all parameters in subgroups were calculated by independent sample-t-test. To compare the distributions of dichotomous data viz .gender, symptomatology, urine acetone, cultures for growth, need of dialysis/surgical intervention, Chi-square test was used. Association between variables was assessed by logistic regression model. Potential confounders were adjusted for.
Pearson correlations were applied to evaluate the correlation between Emphysematous pyelonephritis and age, sex, history of fever,flank pain & UTI symptoms, UT obstruction, renal stones& use of instrumentation, blood culture & mode of therapy. All statistical analyses were performed using the SPSS package .A p-value of less than 0.05 was considered to be statistically significant.
AGE
The age distribution of the study population is
Age More than 60 Yrs
Age Less than 60 Yrs
The percentage of
The percentage of patients of age more than 60 years 36%
51
AGE DISTRIBUTION:
The age distribution of the study population is as follows:
Table 1
Age More than 60 Yrs
Age Less than 60 Yrs
Fig 1
The percentage of patients of age less than 60 years 64%
The percentage of patients of age more than 60 years 36% Age More than 60 Yrs
Age Less than 60 Yrs as follows:
9
16
patients of age less than 60 years 64%
The percentage of patients of age more than 60 years 36% Age More than 60 Yrs
SEX DISTRIBUTION OF STUDY GROUP:
The sex distribution of the study population is as follows:
The percentage of males
The percentage of females Number of Males
Number of Females
52
DISTRIBUTION OF STUDY GROUP:
The sex distribution of the study population is as follows:
Table 2
Fig 2
The percentage of males – 24%
The percentage of females – 76%
Number of Males
Number of Females Number of Females
The sex distribution of the study population is as follows:
Number of Males
Number of Females 6
The correlation between age and
Age
The mean age of patients who survived is
of patients who died is 70.38 years . The correlation between the age of the patient and mortality outcome is
higher the age of the patient, greater is the risk of mortality. 0
10 20 30 40 50 60 70 80
Mortality
53
AGE
The correlation between age and mortality in the study population
Table 3
Out come Mean
Mortality Survival
Fig 3
he mean age of patients who survived is 53.12 years. The mean age 70.38 years . The correlation between the age of the patient and mortality outcome is statistically significant (p<0.05) i.e. higher the age of the patient, greater is the risk of mortality.
Mortality Survival
mortality in the study population
.
70.38 53.12
HISTORY OF FEVER
The correlation between history of fever and m
P = 0.484
There is no statistical significance with regards to correlation between history of fever and mortality.
0 10 20 30 40 50 60 70
Survived
Fever Present
Fever Absent
54
HISTORY OF FEVER
The correlation between history of fever and mortality in the study population
Table 4:
Fig 4
There is no statistical significance with regards to correlation between history of fever and mortality.
Died
Fever Present
Fever Absent
Survival Mortality
35.3
64.7
ortality in the study
There is no statistical significance with regards to correlation Fever Present
Fever Absent
50
HISTORY OF
The correlation between history of flank pain and mortality in the study
P = 0.484 Statisticall
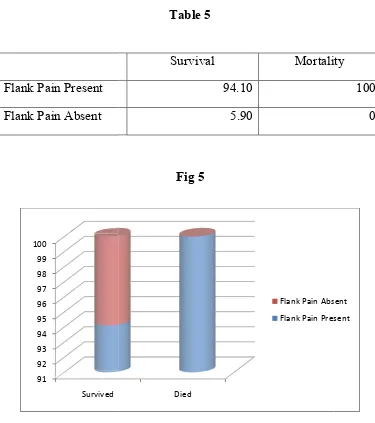
There is no statistical significance with regards to correlation between history of flank pain and mortality.
91 92 93 94 95 96 97 98 99 100
Survived Flank Pain Present Flank Pain Absent
55
HISTORY OF FLANK PAIN
[image:55.612.123.498.182.605.2]The correlation between history of flank pain and mortality in the study population
Table 5
Fig 5
lly not significant.
is no statistical significance with regards to correlation between history of flank pain and mortality.
Died
Flank Pain Absent
Flank Pain Present
Survival Mortality
94.10 5.90
The correlation between history of flank pain and mortality in the study
is no statistical significance with regards to correlation Flank Pain Absent
Flank Pain Present Mortality
The correlation between history of UTI symptoms and mortality in the
UTI Symptoms Present
UTI Symptoms Absent
P = 0.569
There is no statistical significance with regards to correlation between history of UTI symptoms and mortality
80 82 84 86 88 90 92 94 96 98 100
Survived
56
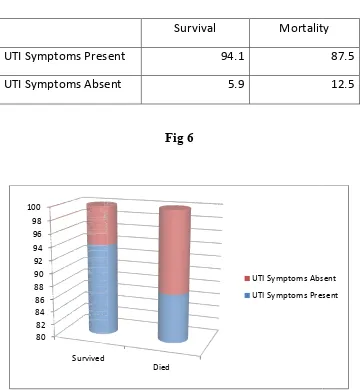
UTI SYMPTOMS
[image:56.612.134.495.210.600.2]The correlation between history of UTI symptoms and mortality in the study population
Table 6
Survival Mortality
UTI Symptoms Present 94.1
UTI Symptoms Absent 5.9
Fig 6
There is no statistical significance with regards to correlation between history of UTI symptoms and mortality
Died
UTI Symptoms Absent
UTI Symptoms Present The correlation between history of UTI symptoms and mortality in the
Mortality
87.5
12.5
There is no statistical significance with regards to correlation UTI Symptoms Absent
The correlation between duration of diabetes mellitus and
Duration of DM
There exist a statistically significant
between duration of diabetes mellitus and mortality DM in years in patients who survived is
in years in patients who 0
5 10 15 20 25
Mortality
57
DURATION OF DM
The correlation between duration of diabetes mellitus and mortality
Table 7
Out come Mean
Mortality 22.38
Survival
Fig 7
statistically significant P = 0.000(< .05) correlation between duration of diabetes mellitus and mortality. The mean duration
patients who survived is 9.35. The mean duration patients who died is 23.38.
Mortality Survival
mortality
22.38 9.35
HISTORY OF
The correlation between
UTO Present
UTO Absent
P = 0.400 The correlation between
and mortality
in the study population is not s
0% 10% 20% 30% 40% 50% 60% 70% 80% 90% 100%
UTO Present
58
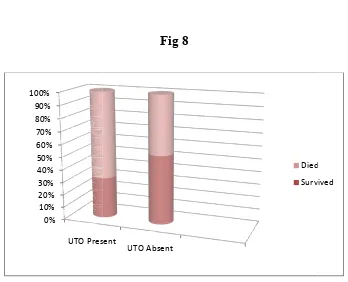
HISTORY OF URINARY TRACT OBSTRUCTION
The correlation between history of urinary tract obstruction and mortality
[image:58.612.139.487.361.643.2]in the study population.
Table 8
Survival Mortality
11.8
88.2
Fig 8
The correlation between history of urinary tract obstruction
in the study population is not s
tatistically significantUTO Present
UTO Absent
Died
Survived
URINARY TRACT OBSTRUCTION
and mortality
Mortality
25
75
history of urinary tract obstruction ignificant. Died
HISTORY OF RENAL STONES
The correlation between renal stones and mortality in the study
P = 0.170 Statistically not 0%
10% 20% 30% 40% 50% 60% 70% 80% 90% 100%
Renal Stones Present Renal Stones Present
Renal Stones Absent
59
HISTORY OF RENAL STONES
The correlation between renal stones and mortality in the study
[image:59.612.140.486.323.635.2]population
Table 9
Fig 9
Statistically not significant. Renal Stones Renal Stones
Absent
Died
Survived Survival Mortality
Renal Stones Present 5.9
Renal Stones Absent 94.1
The correlation between renal stones and mortality in the study
Died
Survived Mortality
25
HISTORY OF INSTRUMENTATION
The correlation between
Instrumentation Present
Instrumentation Absent
P = 0.170 The correlation between
mortality
in the study population is not
0% 10% 20% 30% 40% 50% 60% 70% 80% 90% 100%
Survived
60
HISTORY OF INSTRUMENTATION
The correlation between history of instrumentation and mortality
[image:60.612.141.488.227.639.2]study population.
Table 10
Survival Mortality
Instrumentation Present 5.9
Instrumentation Absent 94.1
Fig 10
The correlation between history of instrumentation and
in the study population is not
statistically significantDied
Instrumentation Absent
Instrumentation Present
and mortality
in the
Mortality
25
75
and ignificant. Instrumentation Absent
61
COMPLETE BLOOD COUNT
[image:61.612.133.494.182.651.2]The correlation between complete blood count and mortality in the study population
Table 11
Out come Mean
CBC Mortality 18575.00
Survival 13558.82
The correlation between
Out come Platelet
count
Mortality Survival
There exist a statistically significant
between platelet count and mortality. who survived is 18304.81.
who died is 54000.
62
PLATELET COUNT
The correlation between platelet count and mortality in the study population
Table 12
Out come Mean
Mortality 54000.00
Survival 18304.81
Fig 12
statistically significant P = 0.000 (< 0.05) correlation en platelet count and mortality. The mean platelet count in
18304.81. The mean platelet count in years in Mortality
Survival and mortality in the study
54000.00 18304.81
P = 0.000 (< 0.05) correlation platelet count in patients platelet count in years in patients
Mortality
The correlation between
Urine Acetone Present
Urine Acetone Absent
There exist a statistically
between urine acetone and mortality 0%
10% 20% 30% 40% 50% 60% 70% 80% 90% 100%
Urine Acetone
Present
63
URINE ACETONE
[image:63.612.139.489.232.628.2]The correlation between urine acetone and mortality in the study population
Table 13
Survival Mortality
Urine Acetone Present 5.9
Urine Acetone Absent 94.1
Fig 13
tatistically significant P = 0.000 (< 0.05) correlation between urine acetone and mortality.
Urine Acetone
Absent
Died
Survived and mortality in the study
100
0
P = 0.000 (< 0.05) correlation Died
The correlation between
Urine Spot PCR
There exist a statistically
between urine acetone and mortality patients who survived is
who died is 4.52.
64
URINE SPOT PCR
[image:64.612.138.489.172.578.2]The correlation between urine spot PCR and mortality in the study population
Table 14
Out come Mean
Mortality Survival
Fig 14
tatistically significant P = 0.000 (< 0.05) correlation between urine acetone and mortality. The mean Urine spot PCR value in patients who survived is 2.65. The mean Urine spot PCR value in
Mortality
Survival and mortality in the study
4.52 2.65
P = 0.000 (< 0.05) correlation Urine spot PCR value in Urine spot PCR value in patients
Mortality
The correlation between
Blood Sugar
There exists a statistically
between blood sugar values and mortality patients who survived is
died is 454.25. 0 50 100 150 200 250 300 350 400 450 500
Mortality
65
BLOOD SUGAR
The correlation between blood sugar and mortality in the study population
Table 15
Out come Mean
Mortality 454.25
Survival 318.24
Fig 15
tatistically significant P = 0.000 (< 0.05) correlation between blood sugar values and mortality. The mean blood sugar in patients who survived is 318.29.The mean blood sugar in patients who
Mortality Survival
and mortality in the study population
454.25
318.24
SERUM CREATININE
The correlation between
Se Cr
P = 0.386 The correlation between serum creatinine and mortality is not statistically significant
survived is 4.74.The mean
66
SERUM CREATININE
[image:66.612.139.483.170.598.2]The correlation between serum creatinine and mortality in the population
Table 16
Outcome Mean
Mortality 6.99
Survival 4.74
Fig 16
P = 0.386 The correlation between serum creatinine and mortality is not ignificant. The mean serum creatinine in patients who
The mean serum creatinine in patients who died Mortality
Survival and mortality in the study
6.99 4.74
P = 0.386 The correlation between serum creatinine and mortality is not patients who died is 6.99. Mortality
The correlation between
HbA1C
The correlation between
P = 0.000 (< 0.05) . The mean The mean HbA1C in patients who
67
HbA
1C
[image:67.612.142.486.167.577.2]The correlation between HbA1C and mortality in the study population
Table 17
Out come Mean
Mortality 9.84
Survival 7.78
Fig 17
The correlation between HbA1C and mortality is statistically s The mean HbA1C in patients who survived is
patients who died is 9.84.
Mortality
Survival and mortality in the study population
9.84 7.78
significant
patients who survived is 7.78. Mortality
URINE CULTURE AND SENSITIVITY
The correlation between
E. Coli
Klebsiella
The correlation between statistically significant
0% 10% 20% 30% 40% 50% 60% 70% 80% 90% 100%
Survived
68
URINE CULTURE AND SENSITIVITY
[image:68.612.140.486.367.638.2]The correlation between urine culture and sensitivity and mortality in the study population
Table 18
Survived Died
100
0
Fig 18
The correlation between urine culture and sensitivity and mortality P = 0.000 (< 0.05)
Survived Died
Klebsiella
E. Coli
and mortality in the
37.5
62.5
and mortality is Klebsiella
URINE CULTURE AND SENSITIVITY
The organisms grown
E. Coli
Klebsiella
In 80% of cases E.Coli is grown
In 20% of cases Klebsiella is grown.
69
URINE CULTURE AND SENSITIVITY
[image:69.612.141.486.204.589.2]The organisms grown in urine culture and sensitivity in our study population.
Table 19
E. Coli 20
Klebsiella 5
Fig 19
In 80% of cases E.Coli is grown .
In 20% of cases Klebsiella is grown.
E. Coli
Klebsiella in urine culture and sensitivity in our study
E. Coli
BLOOD CULTURE AND SENSITIVITY
The organism grown in blood culture and sensitivity
No Growth
E.Coli
Klebsiella
0 2 4 6 8 10 12 14 16
No Growth
70
BLOOD CULTURE AND SENSITIVITY
The organism grown in blood culture and sensitivity in our study population.
Table 20
16
4
5
Fig 20
No Growth E.Coli Klebsiella
BLOOD CULTURE AND SENSITIVITY
The correlation between
No Growth
E.Coli
Klebsiella
The correlation between statistically significant
0% 10% 20% 30% 40% 50% 60% 70% 80% 90% 100%
No Growth
71
BLOOD CULTURE AND SENSITIVITY
[image:71.612.136.492.181.639.2]The correlation between blood culture and sensitivity and mortality in the study population
Table 21
Survival Mortality
94.1
5.9
0
Fig 21
The correlation between blood culture and sensitivity and mortality P = 0.000 (<0.05)
No Growth E.Coli Klebsiella
Died
Survived
and mortality in the
Mortality
0
37.5
62.5
and mortality is Died
72
GRADING BY CT KUB
The distribution of patients in the study population according to
[image:72.612.139.486.216.547.2]grading by CT KUB
Table 22
Class I 6
Class II 10
Class III A 4
Class III B 5
Fig 22
The percentage of patients with Class I - 24% The percentage of
patients with Class II – 40% The percentage of patients with
Class III A – 16% The percentage of patients with Class III B –
20%
Class I
Class II
Class III A
GRADING BY CT KUB
The correlation between grading by CT KUB and mortality in the
Class I
Class II
Class III A
Class III B
0% 10% 20% 30% 40% 50% 60% 70% 80% 90% 100%
Survived
73
GRADING BY CT KUB
The correlation between grading by CT KUB and mortality in the
[image:73.612.129.500.199.680.2]study population
Table 23
Survival Mortality
35.3
58.8
0
5.9
Fig 23
Survived Died
Class II
Class I
The correlation between grading by CT KUB and mortality in the
Mortality
0
0
50
50
Class II
GRADING BY CT KUB
There exists a statistically significant
KUB and mortality P = 0.000 (<0.05) 0%
10% 20% 30% 40% 50% 60% 70% 80% 90% 100%
Survived
74
GRADING BY CT KUB
Fig 24
statistically significant correlation between grading by CT P = 0.000 (<0.05).
Survived Died
Class III B
Class III A
correlation between grading by CT Class III B
75
MEDICAL TREATMENT
The distribution of patients who received medical treatment
Fig 25
1. Meropenem 2. Ceftriaxone
3. Ceftriaxone and Piperacillin and tazobactam 4. Imepenem
5. Piperacillin and tazobactam 6. Vancomycin
7. Amikacin
[image:75.612.166.470.184.454.2]The correlation between dialysis and mortality in the study
Hemodialysis
Peritoneal dialysis
There exists a statistically significant
mortality P = 0.000 (<0.05) . 0%
10% 20% 30% 40% 50% 60% 70% 80% 90% 100%
Survived
76
DIALYSIS
The correlation between dialysis and mortality in the study
[image:76.612.134.493.360.643.2]population
Table 24
Survival Mortality
17.6
82.4
Fig 26
statistically significant correlation between dialysis and P = 0.000 (<0.05) .
Survived Died
Peritoneal dialysis
Hemodialysis
The correlation between dialysis and mortality in the study
Mortality
100
0
77
SURGICAL TREATMENT
[image:77.612.138.487.175.643.2]The distribution of patients who received surgical treatment
Table 25
No Intervention 18
CT guided aspiration 3
Partial Nephrectomy 2
Nephrectomy 2
Fig 27
0 2 4 6 8 10 12 14 16 18 20
No Intervention CT guided aspiration
Partial Nephrectomy
78
SURGICAL TREATMENT
The correlation between surgical treatment and mortality
Table 26
Survival Mortality
No Intervention 82.2 37.5
CT guided aspiration 5.9 25
Partial Nephrectomy 5.9 12.5
[image:78.612.135.493.195.654.2]Nephrectomy 0 25
Fig 28
There exists a statistically significant correlation between surgical treatment and morality P = 0.043 (<0.05)
No Intervention
CT guided aspiration
Partial Nephrectomy
TREATMENT SUMMARY
The distribution of patients who received medical treatment alone
and combined surgical treatment with mortality
Medical treatment
Medical and surgical treatment
79
TREATMENT SUMMARY
The distribution of patients who received medical treatment alone
[image:79.612.131.495.196.627.2]combined surgical treatment with mortality
Table 27
Medical treatment 18
Medical and surgical treatment 7
Fig 29
Medical treatment
Medical and surgical treatment
The distribution of patients who received medical treatment alone
Medical treatment
SURVIVAL AND MORTALITY
The correlation between surgical treatment and mortality
No of patients survived
No of patients died
80
SURVIVAL AND MORTALITY
The correlation between surgical treatment and mortality
Table 28
Fig 30
No of patients survived
No of patients died
No of patients survived 17
No of patients died 8
The correlation between surgical treatment and mortality
No of patients survived
81
DISCUSSION
In our study it is found that, 24% of the patients are above sixty years of age, 76% of patients are below sixty years of age. All the above sixty years of age has severe disease and did not survive. The mean age of patients who survived is 53.12 years . The mean age of the patients who died is 70.38 years. In a previous study the mean age of the patients was shown to be 58 years. In that study, the mean age of patients who survived was 59 years . The mean age of the patients who died was 67 years.
In our study the ratio between affected female and male is 3.16:1. So there is female preponderance in our study. In a previous study the female: male ratio was 5.6:1.
Although the classical symptoms of this disease are fever and flank pain, urinary tract symptoms, in our study fever is not present in 32% of our patients. UTI symptoms are not present 4%. In a previous study fever is not present in 21% of patients.
82
hypertrophy. 8% of the patients have undergone transurethral resection of prostate. In a previous study, it was shown that 24% of the patients had urinary tract obstruction.
In our study, history of instrumentation is present in 12% of patients. 8% of the patients have renal stones. In a previous study, history of instrumentation is noted in 20% of the patients.
In our study, the mean duration of diabetes mellitus is 16 years. The mean duration of diabetes mellitus in patients who survived is 9.3 years. The mean duration of diabetes who died is 22.3 years . The mean duration of diabetes mellitus in a previous study was about 20 years.
In our study, leukocytosis is present in 95% of the patients. The mean total count in patients who survived is 13558. The mean total count in patients who died is 18575. In a previous study 69% of the patients had leukocytosis.
83
the patient had thrombocytopenia . In that study, 36% of the patients with thrombocytopenia had survived and 64% of the patients died.
In our study, 32% of the patients have positive urine acetone during admission. All the patients with diabetic ketosis died.
In our study, proteinuria is present in 85% of the patients. In a previous study, proteniuria was present in 20% of the patients.
In our study, the mean blood sugar in patients who survived is 318.24. The mean blood sugar in patients who died is 454.25. 87% of the patients who had diabetic ketosis at admission required surgical intervention. The mortality in patients with diabetic ketosis is 100%.
In our study, the mean serum creatinine in patients who survived is 4.74% and died is 6.99% . In a previous study 28% of the patients with elevated creatinine had died and 67% of the patients had survived.
84
In our study E.coli is grown in urine culture among 80% of the patients. Klebsiella is grown in 20% . The mortality is 100% in patients who had growth of Klebsiella and 15% in E.coli. All the patients who had Klebsiella grown also had blood culture positive for Klebsiella.
All the patients with growth of Klebsiella required surgical intervention. There is no mixed culture positivity in our study. In a previous study it is shown that E.coli is grown in 70% of the patients and Klebsiella in 28% of the patients.
In our study, in blood culture 20% of the patients had Klebsiella grown. E.coli is grown in 16% of the patients. No organism is grown in 64% of the patients. The mortality rates in patients with Klebsiella is 100% and E.coli is 16%. There is no mixture culture positivity.
85
mortality rate in patients with Class I and Class II is 0 and 10% respectively. The mortality rate in patients with Class III A and B is 29% and 9% respectively. The mortality rate in Class IV disease is 50%.
In our study, all the patients require renal replacement therapy. 56% of the patients required peritoneal dialysis. All those patients who required peritoneal dialysis survived. 44% of the patients required hemodialysis. The mortality rate in patients treated with hemodialysis is 72%.
In our study, all the patients are treated with appropriate antibiotic according to sensitivity pattern. 72% of the patients does not require any surgical intervention. The mortality rate of patients who are treated medical therapy alone is 11%. But all of them belong to Class I and Class II group.
86
belong to Class III A and B groups. All the patients in Class III A and B requires surgical intervention
87
CONCLUSION
To summarise the results of our study
• Female patients are more commonly affected than males
• Mortality due to the disease is greater in patients above sixty years of age.
• Urinary tract obstruction is a separate risk factor for mortality in addition to Diabetes mellitus.
• Mortality rate is more if the duration of diabetes is more than sixteen years.
• Thrombocytopenia at presentation increases mortality rate.
• All the patients who are dmitted with diabetic ketosis succumb to the illness.
• Patients with poor glycemic control reflected by high HbA1C carried poor prognosis.
• The commonest organism grown in urine culture is E.coli. Klebsiella is grown in 20% of the patient.
• All patients with klebsiella grown in urine culture also have blood culture positive for klebsiella.
88
• 36% of the patients have sterile blood culture.
• The mortality rate is high in patients who had blood culture positivity. (Klebsiella - 100%, E.coli – 75%)
• 64% of patients had Class I, Class II disease (as per CT KUB), all of them survived with medical treatment alone.
• The mortality rate is 75% in Class III A and 100% in Class IIIB
• All the patients required renal replacement therapy.
• 72% of patients are treated by medical therapy alone, in which the mortality rate is 11% .
89
As per the inference from our study
E.coli or Klebsiella infection in patients with diabetes mellitus is the corner stone for development of EPN. Emphysematous pyelonephritis can be successfully as follows.
Although surgery was performed routinely, consensus now favors conservative therapy including placement of catheter drainage nephrostomy for drainage.
All patients are treated with antibiotics and obstruction, if present should be relieved.
Class I disease can be treated with antibiotics alone.
Class II disease can be treated with antibiotics and percutaneous catheter drainage, if necessary.
Class III A and III B disease at low risk can be initially treated with antibiotics and percutaneous catheter drainage. Sometimes nephrectomy may be necessary.
Class III A and III B disease at high risk require antibiotics plus nephrectomy.
Class IV disease should initially be treated with antibiotics and percutaneous catheter drainage. Nephrectomy is a last option.
90
BIBLIOGRAPHY
1. Costas S: Renal and perirenal emphysema. BJU 1972, 44:311-9. 2. Ahlering TE, Boyd SD, Hamilton CL, et al.: Emphysematous
pyelonephritis: a 5-year experience with 13 patients. J Urol 1985, 134:1086-8.
3. Vetere NS, Monti J, Gutman D: A case report of emphysematous pyelonephritis secondary to ureteral obstruction in a non-diabetic patient. Am J Emerg Med 2006, 24(6):749-50.
4. Jain SK, Agarwal N, Chaturvedi SK: Emphysematous pyelonephritis: a rare presentation. J Postgrad Med 2000, 46:31-2. 5. A practical guide to Diabetes mellitus 6th edition, Nihal thomas,
CMC Vellore
6. Brenner text book of nephrology 8th edition. 7. Schrier text book of nephrology 4th edition. 8. Heptinstall’s pathology of kidney 4th edition. 9. Harrison’s text book of medicine 18th edition. 10.Joslin’s text book of diabetology 7th edition
91
13.Schultz EH, Klorfein EH: Emphysematous pyelonephritis. J Urol 1962, 87:762-6.
14.Campbell's Urology Walsh, Patrick C 7th ed Cloth Text 1997. 15.Ahlering TEBoyd SDHamilton CL et al. Emphysematous
pyelonephritis: a 5-year experience with 13 patients. J Urol. 1985;1341086- 1088.
16.Shokeir AAEl-Azab MMohsen TEl-Diasty T Emphysematous pyelonephritis: a 15-year experience with 20 cases. Urology. 1997;49343-346.
17.Menif E, Nouira K, Baccar S, et al. Emphysematous pyelonephritis: report of 3 cases. Ann Urol 2001; 35:97–100. 18.Johnson JR. Virulence factors in Escherichia coli urinary tract
infection. Clin Microbiol Rev 1991;4:80
19.Pontin ARBarnes RDJoffe JKahn D Emphysematous pyelonephritis in diabetic patients. Br J Urol. 1995;7571- 74 20.Yang WHShen NC Gas-forming infection of the urinary tract:
an investigation of fermentation as a mechanism. J Urol. 1990;143960- 964
92
22.Evanoff GVThompson CSFoley RWeinamn EJ Spectrum of gas within the kidney: emphysematous pyelonephritis and emphysematous pyelitis. Am J Med. 1987;83149- 154
23.Michaeli JMogle PPerlberg SHemiman SCaine M Emphysematous pyelonephritis. J Urol. 1984;131203- 208 24.Wold AE, Caugant DA, Lidin- Janson G, et al. Resident colonic
E coli strains frequently display uropathogenic characteristics. J infect D is 1992;165:46
25.Rantz LA. Serological grouping of E. coli; study in urinary tract infection . Arch Intern Med 1962;109:37
26.Evanoff GVThompson CSFoley RWeinamn EJ Spectrum of gas within the kidney: emphysematous pyelonephritis and emphysematous pyelitis. Am J Med. 1987;83149- 154
27.Alexander JC Pneumopyonephrosis in diabetes mellitus: case report. J Urol. 1941;45570
28.Pontin ARBarnes RDJoffe JKahn D Emphysematous pyelonephritis in diabetic patients. Br J Urol. 1995;7571- 74 29.Langston CSPfister RC Renal emphysema: a case report and
review of the literature. AJR Am J Roentgenol. 1970;110778 30.Michaeli J, Mogle P, Perlberg S, et al.: Emphysematous
93
31.Wan YLLee TYBullard MJTsai CC Acute gas-producing bacterial renal infection: correlation between imaging findings and clinical outcome. Radiology. 1996;198433- 438
32.Huang JJ, Tseng CC. Emphysematous pyelonephritis: clinicoradiological classification, management, prognosis, and pathogenesis. Arch Intern Med 2000; 160:797–805.
33.Best CD, Terris MK, Tacker JR, et al.: Clinical and radiological findings in patients with gas forming renal abscess treated conservatively. J Urol 1999, 162:1273-6.
34. Tahir H, Thomas G, Sheerin N, Bettington H, Pattison JM, Goldsmith DJ. Successful medical treatment of acute bilateral emphysematous pyelonephritis. Am J Kidney Dis 2000; 36:1267– 1270.
35.Kondo T, Okuda H, Suzuki M, et al.: [A case of emphysematous pyelonephritis improved with conservative therapy–indication for conservative therapy]. Hinyokika Kiyo 2000, 46:335-8
94
37. Chen MT, Huang CN, Chou YH, et al.: Percutaneous drainage in the treatment of emphysematous pyelonephritis: 10-year experience. J Urol 1997, 157:1569-73.
38.Hui L, Tokeshi J: Emphysematous pyelonephritis. Hawaii Med J 2000, 59:336-7.
95
PROFORMA
Personal data
Name: Age: Sex:
Address: Occupation: I.P No:
Date of Admission: Date of Discharge:
History
1. Fever
2. Abdominal Pain, Flank Pain
3. Vomiting
4. Urinary Symptoms
96
Past History
History of Diabetes Mellitus
- Duration
- Mode of Therapy
- Control Status History of Comorbid Illness
- Hypertension
- Coronary Artery Disease Previous Hospitalisation
History of Urinary tract obstruction History of Renal Stones
History of Instrumentation, trauma
History of Immunosuppressive illness, drugs
Family History
1. Diabetes Mellitus
2. Other Illness
Personal History
97
Clinical Examination
Height Weight
Vitals
Pulse Rate Respiratory Rate
Blood Pressure Temperature
Systemic examination
Abdomen
1. Inspection 2. Palpation 3. Percussion 4. Auscultation
CVS
RS
CNS
98
1. CBC
2. Urine Albumin Sugar Spot PCR Deposit Acetone
3. Urine Culture and sensitivity
1 2 3 4. Blood Culture and Sensitivity
5. Blood urea and Serum Creatinine
6. Hb1AC
7. Antibodies for HIVI and HIV2
8. X-RAY KUB
9. USG KUB
99
Treatment
1. Fluids
2. Antibiotics
3. Dialysis – Peritoneal Dialysis/ Hemodialysis
4. Percutaneous drainage/ CT guided drainage/ Stenting
100
MASTER CHART
S L N O P a ti e n t' s N a m e A g e S e x H /o F e v e r F la n k P a in V o m it in g U T I S y m p to m s H /O D M D u ra ti o n o f D M H /o U ri n a ry t ra ct o b st ru ct io n H /o o f R e n a l S to n e s H /o I n st ru m e n ta ti o n C B C ` P la te le t co u n t U ri n e D e p o si ts P u s ce ll s U ri n e A ce to n e U ri n e S p o t P C R U ri n e C /S B lo o d C /S B lo o d S u g a r S e C r H b A 1 C H IV X ra y K U B E v id e n ce o f E P N i n U S G A b d G ra d in g o f E P N b y C T K U B M e d ic a l T re a tm e n t D ia ly si s S u rg ic a l T re a tm e n t O u tc o m e1 Nagammal 50 F Y Y Y Y Y 9Yrs N N N 13600 178000 5 Ni l 1. 2 E.Coli Grown No Growth 250
1. 8 7.4
Ne g
NA D Y
Cla ss II Piperacill in plus tasobact am and Insulin Periton eal Dialysis
Nil Surviv ed
2 Chandra 66 F N Y Y Y Y 22Yr
s Y Y N 17400 69000 15 P os 4. 5 E.Coli Grown E.Coli
Grown 440 5.
8 9.2 Ne
g NA
D Y Cla ss III A Meropen em and Insulin Hemo Dialysis Partial Nephrecto
my of right kidney
Died
3 Radhammal 46 F Y Y Y Y Y 7Yrs N N N 14300 189000 5 Ni l 2. 7 E.Coli Grown No Growth 280
2. 7 8.6
Ne g
NA D Y
Cla ss II Impeinen and Insulin Periton eal Dialysis
Nil Surviv ed
4 Swamyk annu 65 M Y Y Y Y Y 30Yr
s N N N 17600 42000 10 P os 4. 7 E.Coli Grown E.Coli Grown 456
4. 7 9.9
Ne g
NA D Y
Cla ss III B Meropen em, Ceftriaxo ne and Insulin Hemo Dialysis CT guided drainage Died
5 Ponnammal 48 F Y Y Y Y Y 7Yrs N N N 14600 174000 5 Ni l 2. 2 E.Coli Grown No Growth 3 01 2. 3 7.4
Ne g
NA D Y
Cla ss II Piperacill in plus tasobact am and Insulin Periton eal Dialysis
101 6 Arokiya dass 72 M Y Y Y Y Y 24Yr
s N Y
Y
17400 47000 15 P os 4. 6 Klebsie lla Grown Klebsie lla Grown
474 6. 2 10. 6 Ne g NA D Y
Cla ss IIIB Meropen em, Ceftriaxo ne and Insulin Hemo Dialysis CT guided drainage Died
7 Kaveri 47 F N Y Y Y Y 8Yrs N N N 12300 162000 5 Ni l 2. 4 E.Coli Grown No Growth 306
2. 4 7.6
Ne g
NA D Y
Cla ss II Piperacill in plus tasobact am and Insulin Periton eal Dialysis
Nil Surviv ed
8 Saradhammal 72 F N Y Y Y Y 25Yr
s N N N 18200 56000 15 P os 4. 2 Klebsie lla Grown Klebsie lla Grown
448 5. 9 10. 6 Ne g NA D Y
Cla ss III B Piperacill in plus tasobact am and Ceftriaxo ne and Insulin Hemo
Dialysis Nil Died
9 Murugammal 52 F N Y Y Y Y 8Yrs N N N 13600 154000 10 Ni l 2. 8 E.Coli Grown No Growt h
298 3. 2 7.6
Ne g
NA D Y
Cla ss I Meropen em and Insulin Periton eal Dialysis
Nil Surviv ed
10 Rose 58 F N Y