PULMONARY FUNCTION TESTS IN ISOLATED
RHEUMATIC MITRAL STENOSIS
DISSERTATION SUBMITTED FOR THE FULFILLMENT OF
DOCTOR OF MEDICINE BRANCH I – GENERAL MEDICINE
MARCH 2007
CERTIFICATE
This is to certify that this dissertation entitled “PULMONARY FUNCTION TESTS IN ISOLATED RHEUMATIC MITRAL
STENOSIS” submitted by Dr. N. PERIYASAMY to The Tamil Nadu
Dr.M.G.R. Medical University, Chennai is in partial fulfillment of the requirement for the award of M.D. degree Branch I (General Medicine) and is a bonafide research work carried out by him under direct supervision and guidance.
Dr. Nalini Ganesh, M.D., Dr. Nalini Ganesh, M.D.,
Professor and Head, Professor and Head, Department of Medicine, Department of Medicine, Govt. Rajaji Hospital, Govt. Rajaji Hospital, Madurai Medical College, Madurai Medical College,
DECLARATION
I, Dr. N. PERIYASAMY declare that I carried out this work on
“PULMONARY FUNCTION TESTS IN ISOLATED RHEUMATIC
MITRAL STENOSIS” at Department of General Medicine,
Government Rajaji Hospital during the period of March 2005 – April 2006. I also declare this bonafide work or a part of this work was not submitted by me or any other for any award, degree, diploma to any university, board either in India or abroad.
This is submitted to the Tamilnadu Dr.M.G.R. Medical University, Chennai in partial fulfillment of the rules and regulation for the M.D. in General Medicine Degree examination.
ACKNOWLEDGEMENT
At the outset, I thank our Dean Prof. Dr. S.M. Sivakumar M.S,,
for permitting me to carry out this study in our hospital.
I am greatly indebted to my beloved Chief & Head of the Department Prof.Dr.Nalini Ganesh, M.D., for her guidance, encouragement and support during the study period.
I am obliged to Dr. V. Amuthan, D.M. Asst. Professor, Department of Cardiology.
I am thankful to Dr. C. Vivekanandan, M.D. DTCD, Department of Thoracic Medicine, for his valuable suggestions and guidance.
I acknowledge the support extended by Dr. S. Selvaraj, MCH,
Professor of Cardiothoracic Surgery, GRH, Madurai.
I express my gratitude to my assistant professors
Dr.V.T.Premkumar, M.D, Dr.M. Sooriyakumar, M.D, and Dr.V.Ganesh Pandian, M.D. for their valuable suggestion.
CONTENTS
S.NO CONTENTS PAGE
1. INTRODUCTION 1
2. AIMS & OBJECTIVES 3
3. REVIEW OF LITERATURE 4
4. MATERIALS & METHODS 24
5. RESULTS 28
6. DISCUSSSION 51
7. CONCLUSION 57
APPENDIX
INTRODUCTION
Rheumatic heart disease is the most commonest acquired heart disease all over the world.
Mitral Stenosis is almost always rheumatic in origin. Two third of the patients with mitral stenosis are females and mixed mitral stenosis and mitral regurgitation are generally rheumatic in origin; Very rarely, MS is congenital. Predominant Mitral stenosis occurs in approximately 40% of patients with rheumatic heart disease. It remains a major problem in developing nations, especially in tropical and semitropical countries.
In Rheumatic stenosis the valve leaflets are diffusely Thickened by fibrous tissue and/or calcific deposits. The mitral commissures fuse, the chordae tendinae fuse and shorten, the valve cusps become rigid and these changes in turn, lead to narrowing at the apex of the valve Calcification of the stenotic mitral valve immobilizes the leaflets and narrows the orifice further. In normal adults the mitral valve orifice is 4-6 cm2. In the presence of significant, i.c., when the orifice is less than
approximately 2cm2, blood can flow from the to the left ventricle only if
propelled by an abnormally elevated left atrioventricular pressure gradient, the hemodynamic hall mark of mitral stenosis. When the mitral valve opening is reduced to 1cm2, often referred to as critical mitral
maintain a normal cardiac output. The elevated pulmonary venous and pulmonary arterial wedge pressures reduce pulmonary compliance, contributing to exertional dyspnea.
Pulmonary Hypertension
The clinical and haemodynamic features of mitral stenosis are influenced importantly by the level of the pulmonary arterial pressure. Pulmonary hypertension results from
1. Passive backward transmission of the elevated LA Pressure;
2. Pulmonary venous hypertension (reactive pulmonary hypertension) 3. interstial odema in the walls of the small pulmonary vessels; and 4. Organic obliterative changes in the pulmonary vascular bed.
Other pulmonary changes
Fibrous thickening of the walls of the alveoli and pulmonary capillaries occur commonly in mitral stenosis.
AIMS & OBJECTIVES OF THE STUDY
1. To know the type of pulmonary dysfunction in rheumatic mitral
stenosis.
2. Relation between grading of dyspnoea (NYHA Class I to IV) and
severity of pulmonary dysfunction.
3. Relation between mitral valvular size (orifice size) and severity of
pulmonary dysfunction.
REVIEW OF LITERATURE
Rheumatic Fever
Acute Rheumatic fever, a non infectious delayed complication of streptococcal sore throat due to group A β hemolytic streptococcus. 0.3% of patients only develop rheumatic fever after a streptococcal throat.
Epidemiology of Rheumatic Fever and heart disease.
Rheumatic Fever is a major cardiovascular health problem in many nations of the world.
The incidence and prevalence of Rheumatic Fever world wide are enormous. The prevalence of Rheumatic Fever and RHD is highly variable, with the highest rates in the middle eastern and sub-saharan African regions. For instance, it is estimated that 3.2 million patients had rheumatic heart disease in India in 1991 and atleast two thirds of these were young children. The incidence is declining in all over the world because of improving socio economic status and reduced crowding and increase use of penicillin.
Agent, Host and Environmental Factors
access to medical cave continue to influence the development of Rheumatic Fever.
Social and Economic burden
India has good epidemilogic data on Rheumatic fever. The prevalence of Rheumatic fever or Rheumatic heart disease among school children is 2 to 11 per 1000, with a mean of 6 per 1000.
Indian Government allocates a mere 2% of budget for health related activities, compared with 5 to 10% in the developed world.
Pathogenesis
Rheumatic fever is a immune (cellular and antibody) mediated injury. The current understanding proposes that rheumatogenic streptococci contain multiple antigenic determinants that mimic normal human tissue antigens; these antigens are recognized as Foreign by the susceptible host and result in a hyperactive immune response (both humoral and cellular)
tropomyosin and structural proteins like keratin, laminin and vimentin, which are common in the cardiac interstitium.
Cellular immunity instead may contribute significant T cell infiltration in the valvular tissue and synovium. Membrane antigens of group A streptococci can stimulate T cell cytotoxic for cardiac but not skeletal muscle cell.
Rheumatic Fever risk has been associated with increased prevalence of HLA- DR4 in the United States and Saudi Arabia and with increased prevalence of DR3 and DQW2 in India. However, DR2 has increased prevalence in the African American population in the united states, whereas it seems to be protective in Indians.
Pathologic characteristics of cardiac involvement
Macroscopic appearance is fibrinous pericarditis with Epicardial
involvement:
Pinhead vegetations on valve leaflet tissue; microscopic appearance is Fibronoid necrosis in the valve leaflet, cellular infiltrates, and neovascularization of valve. Macroscopically valves are dull and thickened, unlike the smooth pliable normal appearance, and show small verrucous vegetations on the atrial surface of the mitral valve, the chords and the ventricular surface of the aortic valve. The valves are significantly inflamed and edematous and demonstrate extensive pallisading mononuclear infiltration. Aschoff bodies are occasionally seen. There is granulation tissue and fibrous scarring in the late stages of the disease. Aschoff bodies are seen in 30% to 40% of patients with proven or suspected carditis.
Clinical Features
Joint symptoms
Arthritis is a major manifestation of Rheumatic Fever. Arthritis occurs in more than 2/3rd of patients. Large joints of the extremity are
arthritis resolves in most patients within 3 to 4 weeks and does not result in any permanent damage.
Carditis
Rheumatic carditis is an early manifestation; almost 80% of patient who develop carditis do so within the first 2 weeks of the onset of Rheumatic Fever. The most common evidence of carditis is a blowing pansystolic Mitral regurgitation murmur. It is usually grade II to IV, radiates to the axilla, and sometimes is associated with apical, low pitched, short, middiastolic rumble without a presystolic accentuation (carey coombs murmur). Valvular stenosis does not occur in Acute Rheumatic carditis. Mitral regurgitation is due to Active inflammatory valvulitis, valve prolapse, annular dysfunction or dilatation and ventricular enlargement. The aschoff nodules have a predilection for valve rings and this may account for annular dysfunction and dilatation.
Myocarditis is often indicated by the presence of a soft first sound, gallop sounds, cardiomegaly and / or congestive cardiac failure. Myocardial biopsies in patient with active rheumatic carditis do not show significant evidence of myocyte damage. It is now generally believed that congestive heart failure in patients with acute rheumatic carditis is caused by severe mitral regurgitation.
friction rub in this setting is evidence for rheumatic carditis. Presence of pericarditis indicates severe carditis.
Neurologic manifestation
Chorea is usually a late manifestation and appears several weeks after an acute attack of Rheumatic fever at a time when other manifestation have disappeared and patients often do not fulfill the Jones criteria. The onset is usually gradual. The patient appears increasingly nervous, is dysarthric, makes grimacing gestures, had difficulty in writing and shows characteristic purposeless movements of the arms and legs. These involuntary movements are increased by effort or excitement, are absent during sleep, and may be associated with muscular weakness. The pathogenesis of chorea remains unclear. Sydenham’s chorea is usually a self limited condition and recovers without residua.
Skin manifestations
Subcutaneous nodules, a late manifestation of Rheumatic fever, occur in 1% to 21% of patients and the presence of subcutaneous nodules usually suggests underlying carditis. The nodules are firm and painless, 0.5 to 3 cm and are usually on bony proninance or vertebral spinous processes and on extensor tendons. They usually appear in crops and disappear within 8 to 12 weeks in most patients.
subcutaneous nodules, however can be an early or a late manifestation and can be present in the absence of features to indicate active Rheumatic fever. It occurs in less than 10% to 15 % of patients, is present on the trunk and proximal extremities as a serpigenous macular non pruritic rash, and is often very evanescent.
Other features
A number of other signs and symptoms seen in patients with acute rheumatic fever and in view of their nonspecific nature are called minor manifestation for diagnostic purposes. These include fever, prolonged PR interval, and elevated acute-phase reactants.
The Jone’s criteria for diagnosis of acute Rheumatic fever
Major criteria Minor criteria
Carditis Previous Rheumatic Fever or RHD
Polyarthtis Arthralgia
Chorea Fever
Subcutaneous nodules ESR
Erythema marginatum Positive Creative Protein Leukocytosis
Prolonged PR interval
and more than 330 units in children. The best diagnostic specificity is obtained by demonstrating an interval increase in ASO in two paired serial samples. Increased ASO titres are seen in within 7 to 10 days. Anti DNase B which remain elevated for several months after even uncomplicated streptococcal infections.
Role for Echocardiography
Clinically detectable valvular regurgitation (Usually mitral and occasionally Aortic) is the hallmark of Acute carditis. Echo cardiography consistently demonstrate valve regurgitation not detectable with clinical examination.
Investigations in Acute rheumatic Fever
1. Evidence of a systemic illness (Non specific) Leukocytosis, raised
ESR, raised CRP.
2. Evidence of proceeding streptococcal infection (specific) Throat
Swab culture: GroupA β–haemolytic streptococci Antistreptolysin O antibodies (ASO titres)
3. Evidence of carditis
Chest radiograph : Cardiomegaly; pulmonary congestion
ECG : first and second degree heart block; features of pericarditis; T wave inversion; reduction in QRS voltages
Chronic rheumatic heart disease
Chromic valvular heart disease develops in at least half of those affected by rheumatic fever with carditis. Two-thirds of cases occur in women. Some episodes of rheumatic Fever may pass unrecognized and it is only possible to elicit a history of Rheumatic Fever or chorea in about half of all patients with chronic rheumatic heart disease. The mitral valve is affected in more than 90% of cases; The aortic is the next most frequently affected valve, followed by tricuspid and then the pulmonary valve. Isolated mitral stenosis accounts for about 25% of all cases of rheumatic disease and an additional 40% have mixed mitral stenosis and regurgitation.
Pathology
Pathophysiology
In normal adults the mitral valve orifice is 4-6 cm2. in the presence
of significant obstruction, I.e when the orifice is less than approximately 2cm2, blood flow from the LA to the left ventricle (LV) only if propelled
by an abnormally elevated left atrio-ventricular pressure gradient, the hemodynamic hall mark of mitral stenosis. When the mitral valve opening is reduced to 1cm2, often referred to as “critical” MS, Left Atrial
pressure of approximately 25 mm Hg is required to maintain a normal cardiac output. The elevated pulmonary venous and pulmonary arterial PA wedge pressure reduce pulmonary compliance, contributing to exert ional dyspnea.
454-D
Symptoms of mitral stenosis
1. Breathlessness
2. Fatigue
3. Oedema, ascites 4. Palpitation 5. Haemoptysis
6. Cough with expectations
7. Chest pain
8. Symptoms of Thrombo embolic complications e.g. Stroke,
Signs of Mitral Stenosis
1. Atrial fibrillation 2. Mitral facies
3. Auscultation : Loud first heart sound, opening snap, middiastolic
murmur
4. Signs of raised pulmonary capillary pressure, crepitations,
pulmonary oedema, effusions.
5. Signs of pulmonary hypertension, RV heave, loud P2
Investigations in mitral stenosis
ECG
Lt atrial hypertrophy
Right ventricular hypertrophy
Chest radiograph
Enlarged left atium
Signs of pulmonary venous congestion
Echo
Thickened immobile cusps Reduced valve area
1. Mild 1.5 - 2.0 cm2 2. Moderate 1.0 – 1.5 cm2 3. Severe <1 cm2
Doppler
Pressure gradient across mitral valve Pulmonary artery Pressure.
Cardiac cathetorisation
Pressure gradient between LA (or pulmonary wedge) and LV
Pulmonary function abnormalities
Pulmonary function abnormalities denote a disease of either airways or lung parenchyma or both interfering with normal alveolo-arterial gas exchange.
Broadly pulmonary function abnormalities are categorized into 2 patterns
:-1. Obstructive 2. Restrictive
Patterns of abnormal ventilatory capacity
FEV1 FVC FEV1/FVC
Obstructive ↓↓ ↓ / N ↓
Restrictive ↓ ↓ ↓ ↑ / N
This segregation into either of the pattern is done based on analysis of pulmonary function tests which encompasses a multitude of indicators as described below:
Pulmonary Function Tests
Even though many tests are present to know the lung dysfunction, PFT is easiest and one of the best tests to know ventilation dysfunction.
Definitions
Tital volume – the amount of air moves into lungs with each inspiration (or exhale in each expiration).
Inspiratory reserve volume
The air inspired with a maximal inspiratory effort in excess of the tidal volume.
Expiratory Reserve Volume
Residual volume
The Air left in the lungs after a maximal expiratory effort.
Vital Capacity
The largest amount of air that can be exhaled after a maximal inspiratory effort.
The fraction of vital capacity expired during the first second divided by the vital capacity is FEV1.
Spirometry
Introduction
Spirometry is a test of lung function that measures how much and how quickly air can be moved into and out of the lungs. The measurements are made using a spirometer.
A spirometer is an instrument used to measure respired volumes and flows (i.e. spirometry). Many spirometers are able to measure both inspiratory and expiratory airflow.
How to perform spirometry
preferable to standing as this is the most stable position should the patient experience dizziness during the test. The seated position is also preferable for patient with urinary incontinence who may otherwise limit the expiratory effort.
The key steps are to urge the patient to:
Breathe in fully (the lungs must be absolutely full).
Seal the lips around the mouthpiece and immediately.
Blast the air out as fast and as far as possible until the lungs are completely empty.
Repeat the test until three acceptable and reproducible results are obtained (up to a maximum of 8 efforts)
The highest FEV1 and FVC should be reported, even if they come
from separate blows.
Contraindications
Spirometry is a very safe procedure. However, it is physically demanding as it requires maximal patient effort and it involves the generation of high airway and intrathoracic pressures. It is advisable that spirometry be delayed / abandoned for:
Recent eye surgery.
Unstable cardiac function.
Haemoptysis of unknown cause (e.g.? TB)
Pneumothorax.
Chest and abdominal pain.
Nausea and diarrhoea.
Inability to comprehend the instructions.
This a simple method for studying the pulmonary ventilation by recording the volume movement of air into and out of the lungs. In this test, the subject inhales maximally to total lung capacity (TLC) and then exhales as rapidly and forcefully as possible into the turbine of the spirometer, which calculates the flow rates and volume measurements. The flow rates can calculated from the ‘spirogram’ which is a plot of volume verses time, and the volume can be calculated from the ‘flow-volume tracings’ which is a plot of airflow verses the expired or inspired lung volume.
Flow rates
Forced Vital Capacity (FVC) is the maximal volume of gas which can be expired from the lungs during a forced expiration from a position of full inspiration. The FVC can be subdivided into the Forced Expiratory Volume in the first second (FEV1), represents the integrated flow over the
It is effort independent and normally 70% - 80% of the FVC is expired in the first second.
A more sensitive means of evaluating airway obstruction is therefore, to express the forced expired volume as a percentage of vital capacity, abbreviated as FEV1% (or FEV1/FVC). This ratio is relatively
independent of the patient’s size, and is a specific measure of airway obstruction with or without associated restriction of lung volumes. Normally it is 75% or greater.
Another way of assessing airflow obstruction is to measure specific flow rates. Peak Expiratory Flow Rate (PEFR) is a defined as the maximum flow achievable from a forced expiration starting at full inspiration with an open glottis. It measures the maximum expiratory flow rate over the first 10 millisecond. PEFR is reduced by larger airway narrowing due to asthma, COPD, vocal cord palsy and expiratory muscle weakness etc. The Forced Expiratory Flow from 200 ml to 1200 ml below maximal inspiration (FEF2-12) can also be measured. FEF2-12, also
called Maximal Expiratory Flow Rate (MEFR) is used to evaluate the portion of the curve most affected by obstruction of large airways and is most responsive to bronchodilators. FEF2-12 and PEFR are useful in the
Maximal Mid-expiratory flow Rate (MMFR). This is effort independent and is very sensitive to airflow obstruction in peripheral, small airways, where disease of chronic airflow obstruction are thought to begin. FEF25%-75% is dependent on FVC, in other words, it is the average flow rate
during the middle two quarters of FVC.
Flow Volumes
Flow volume curve, a recording during spirometry, of the expiratory flow plotted against expired volume, instead of time, resemble a triangular shaped envelope. At the point where 25% of the vital capacity has been exhaled, this flow rate is termed V max25 or FEF 25%
when 50% of the vital capacity has been exhaled it is termed Vmax50 or
FEF 50% and at 75 of vital capacity it is vmax75 or FEF 75% which refers to
the maximal expiratory flow when 75% of FVC remain to be exhaled. Similarly FEF 50% and FEF 75% correspond to MEF50% and MEF25%
respectively.
FEF75% is though to be very sensitive to detect early small airway
obstruction. In early small airway disease, the only abnormality detected may be reduced FEF75% and FEF50% with normal PEFR and FEV1.
It is a well studied fact that patients with rheumatic mitral stenosis are prone to develop pulmonary ventillatory dysfunction and the severity of mitral stenosis influence the degree of lung function impairment.
In an analysis of 105 patientgs with rheumatic mitral valve diseases [20-21% patients with mitral stenosis and 80-84% with combined mitral valve disease with a stenosis predominance] Hryniewiecki T et al. observed that 93.5% patients had documented airway function disturbance. Using a diagnostic criteria as MEF 50<60% of predicted value, they found out that peripheral airway obstruction had a significant correlation to severity of mitral stenosis. Also bronchial hyperreactivity was noted in 23% patients, but main bronchus obstruction was not significantly present in association with any of the analyzed cardiological parameters.
was associated with a moderate restrictive defect with an inverse correlation and there was no significant involvement of larger airways.
Mahmoud. M Nour et al, in an analysis comparing patients with simple mitral stenosis and those with advanced mitral stenosis scheduled for valve replacement surgery (MVR) confirmed that patients with mitral stenosis have both restrictive and obstructive pattern of pulmonary dysfunction which correlated with the severity of mitral stenosis and with respiratory symptoms.
MATERIALS AND METHODS
This was a case control – cross sectional study conducted at Govt. Rajaji hospital, Madurai. The study population was divided into two groups.
Group I consisted of 60 Isolated Rh. Mitral stenosis, diagnosed by echo cardiography. Group consisted of 20 Non smoking, healthy volunteers, who served as controls.
Group I (N=60) inclusion criteria
1. Age - 10-51
2. Sex - Male or Female
3. Disease - Isolated Rheumatic Mitral stenosis
Exclusion Criteria
1. H/o smoking 2. H/o Alcohol
3. H/o Any major illness or H/o hospitalization during the past 6
months.
4. History, clinical, radiological evidence of respiratory illness.
5. Past H/o Bronchial asthma, pulmonary tuberculosis, COPD.
Group II (n = 20) inclusion criteria
1. Age 18-59
2. Sex Male or Female 3. Non smoker
Exclusion criteria
1. H/o. smoking
2. H/o. Alcoholism
3. H/o. recent respiratory illness or Recent hospitalization 4. H/o. Cardiovascular disease
5. History, Clinical, radiological evidence of respiratory illness.
6. Past H/o. bronchial Asthma, pulmonary Tuberculosis, COPD 7. X-ray chest abnormalities
8. ECG abnormalities
The patients and controls were evaluated as per the predesigned proforma and routine relevant investigations were done to assess their cardiac status and pulmonary status.
The routine scheme of evaluation included 1) History
5) X-ray chest P/A view
6) Basic haemogram
7) Blood sugar, urea and serum creatinine 8) Echocardiogram
After assessing the baseline clinical and laboratory parameters patients and controls were subjected to computerized Spiro metric evaluation in batches after obtaining consent.
All the reading were expressed as the percentage of the predicted value for that particular Age, sex, height and weight comparable to south Indian population defined by Knudsen et al. Every test was repeated on three different occasions and the best of the three reading were taken.
The various spirometric parameters recorded were 1. Forced vital capacity (FVC)
2. Forced expiratory volume in the 1st Second (FEV1) 3. Percentage of FVC expelled as FEV1.
FEV1 x 100 FVC
Interpretation
The Spirometric readings are useful in the interpretation of the pattern of pulmonary dysfunction. The various abnormalities are
I. Restrictive pattern
Establish restriction – FVC < 80% II. Obstructive Pattern
Established obstruction – FEV1/FVC < 75
Early large airway obstruction – PEFR < 70% and FEV1 < 80%
Early small airway obstruction – FEF50 < 70%
FEV75 < 70%
II. Mixed Patter
1. When both FEF/FVC < 75% and FVC <80%
RESULTS AND STATISTICAL ANALYSIS
A. COMPARISON OF PARAMETERS IN STUDY CASES AND
[image:33.595.85.515.276.482.2]CONTROLS
Table 1
Age
Age Group Study Cases Controls
No. % No. %
< 20 6 10 2 10
20-29 22 36.7 7 35
30-39 20 33.3 7 35
40-49 10 16.7 3 15
50 & above 2 3.3 1 5
Total 60 100 20 100
Mean S.D.
31.4 9.2
32.3 10.8
‘p’ 0.9734
Table 2 Sex
Sex Study Cases Controls
No. % No. %
Male 36 60 10 50
Female 24 40 10 50
‘p’ 0.6014
Table 3
Parameters Study Cases Controls
p
Mean S.D. Mean S.D.
EVC 40.55 13.1
7
65.6 9.75 0.0001(Significant)
FEV1 57.98 14.5 99.4 12.4
8
0.0001(Significant)
FVC 51.96 13.8
9
87.05 8.2 0.0001(Significant)
PEF 46.97 21.2 74.2 16.2 3
0.0001(Significant)
FEV1/FVC% 114.1
7
6.85 119.2 4.13 0.0073(Significant)
MEF50 60.23 28.5
8
92.4 8.23 0.0001(Significant)
MEF75 48.28 26.9
7
75.25 12.9 5
0.0001(Significant)
TABLE 4
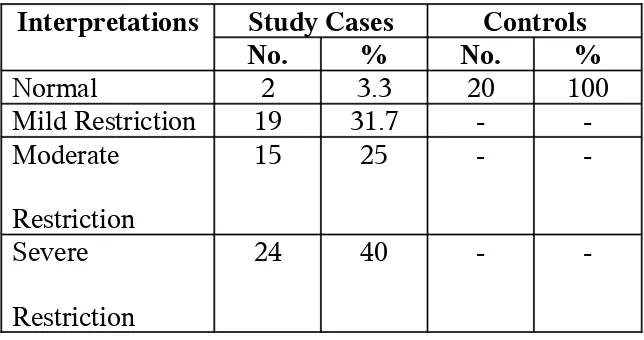
INTERPRETATIONS OF CASES IN THE TWO GROUPS
Interpretations Study Cases Controls
No. % No. %
Normal 2 3.3 20 100
Mild Restriction 19 31.7 - -Moderate
Restriction
15 25 -
-Severe Restriction
24 40 -
-‘p’ = 0.0001 ( Significant )
B. RELATIONSHIP OF VARIOUS PARAMETERS WITH
[image:37.595.95.503.231.481.2]INTERPRETATION IN THE STUDY CASES
Table 5
Age and Interpretation
Age Interpretation Normal Mild Restriction Moderate Restriction Severe Restriction
No. % No. % No. % No. %
< 20 (6) - - 3 50 1 16.7 2 33.3
21-30 (22) 1 4.5 7 31.8 6 27.3 8 36.4
31-40 (20) - - 6 30 6 30 8 40
41-50 (10) 1 10 2 20 2 20 5 50
> 50 (2) - - 1 50 - - 1 50
Total (60) 2 3.3 19 31.7 15 25 24 40 Mean age S.D. 38 12.7 30.7 9.5 29.8 8.4 32.4 9.4 0.7298 (not significant)
There is no statistically significant difference in pulmonary function test with respect to age.
TABLE 6
Sex Normal Mild
Restriction
Moderate
Restriction
Severe
Restriction
No. % No. % No. % No. %
Male (36) 1 2.8 10 27.8 7 19.4 18 50 Female (24) 1 4.2 9 37.5 8 33.3 6 25 P 0.5434 ( not significant )
Female patients.
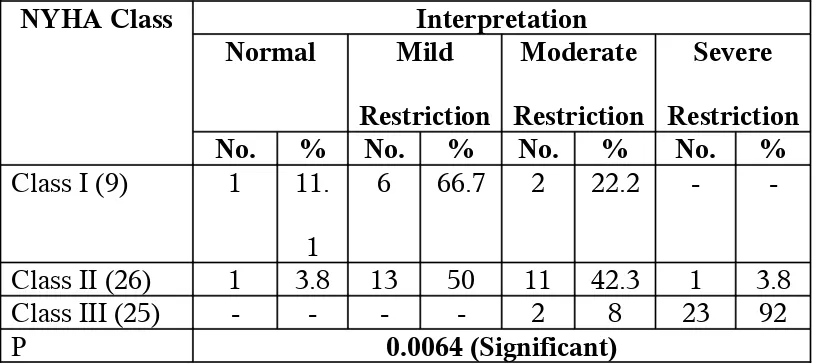
TABLE 7
NYHA AND INTERPRETATION
NYHA Class Interpretation
Normal Mild
Restriction
Moderate
Restriction
Severe
Restriction
No. % No. % No. % No. %
Class I (9) 1 11. 1
6 66.7 2 22.2 -
-Class II (26) 1 3.8 13 50 11 42.3 1 3.8
Class III (25) - - - - 2 8 23 92
P 0.0064 (Significant)
NEWYORK HEART ASSOCIATION CLASSIFICATION
FOR DYSPNOEA.
Class I No symptoms with ordinary physical activity.
Class II Symptoms with ordinary activity, slight limitation of physical activity.
Class III Symptoms with less than ordinary activity, marked limitation of activity.
Class IV Symptoms with any physical activity or even at rest.
dyspnoea. Class IV dyspnoea patients were not included in this study because of they were haemodynamically unstable.
In this study, Class III dyspnoea patients were (25%) found to have severe restrictions (92%)
Table 7A: NYHA and MVO size
NYHA Class MVO Size
Range Mean S.D
I 0.8 – 1.2 0.96 0.16
II 0.6 – 1.2 0.87 0.16
III 0.52 – 0.9 0.7 0.11
‘p’ 0.0001 (Significant)
Statistically significant relationship exists between NYHA Class and MVO size.
Table 7B: NYHA Class and mean MV Gradient.
NYHA Class Mean MV Gradient
Range Mean S.D
I 8 – 23 13.78 5.45
II 8 – 34 16.92 6.28
III 10 – 32 21.04 6.48
‘p’ 0.0079 (Significant)
[image:41.595.88.513.280.386.2] [image:41.595.86.514.526.630.2]Table 8
Size of MVO (Cm2) and Interpretation
Interpretation Size of MVO (Cm2)
Range Mean S.D.
Mild Restriction 0.8-1.2 0.98 0.15 Moderate
Restriction
0.7-1 0.81 0.1
Severe Restriction
0.52-0.9 0.69 0.11
p 0.0001 ( significant)
As degree of restriction becomes Severe Restriction, mean MVO values decrease. This decrease is statistical significant.
Correlation between MVO size and mean MV gradient (r) = 0.53 r > 0.5
[image:42.595.117.480.135.304.2]MVO size and mean MV gradiant are correlated.
Table 9
Mean MV Pressure gradient (mm Hg) and Interpretation
Interpretation Mean MV Pressure gradient (mm Hg)
Range Mean S.D.
Mild Restriction 8-23 13.6 4.5
Moderate Restriction
10-28 18.7 5.8
Severe Restriction 10-32 21.2 6.1
As the mitral valve pressure gradient increases the degree of restriction become severe.
Table 10
LA CLOT AND INTERPRETATION
LA Clot Interpretation Normal Mild Restriction Moderate Restriction Severe Restriction
No. % No. % No. % No. %
Present (6) - - 1 16.7 - - 5 83.3
Absent(54) 2 3.7 18 33.3 15 27.8 19 35.2
P 0.3067(Not significant)
The patients with left atrial clot found to have Severe restrictive pulmonary functions (83.3%).
Table 11
EVC % and Interpretation
Interpretation EVC %
Range Mean S.D.
Mild Restriction 25-71 47.4 13.2 Moderate
Restriction
25-67 45.3 11.7
Severe Restriction 15-54 31.9 9.6
[image:43.595.122.477.514.656.2]Table 12
FEV1 and Interpretation
Interpretation FEV1
Range Mean S.D.
Normal 80-90 85 7.1
Mild Restriction 61-74 68.7 4.3 Moderate Restriction 46-69 62.5 7.5 Severe Restriction 24-70 44.4 11.1
p 0.0001 (Significant)
Table 13
FVC and Interpretation
Interpretation FVC
Range Mean S.D.
Normal 72-81 76.5 6.4
Mild Restriction 60-75 64.1 4.5 Moderate Restriction 32-60 55 6.9 Severe Restriction 20-61 38.4 8.8
[image:44.595.113.480.562.662.2]p 0.0001 (Significant)
Table 14
PEF and Interpretation
Interpretation PEF
Range Mean S.D.
Mild Restriction 20-103 54.4 25.1 Moderate Restriction 21-96 50.2 22.9 Severe Restriction 15-66 38.6 12.8
Table 17
FEV1/FVC and Interpretation
Interpretation FEV1/FVC
Range Mean S.D.
Mild Restriction 99-120 111.5 7.5 Moderate Restriction 98-123 114.2 0.7 Severe Restriction 104-125 116.2 6.2
p 0.1053
Table 18
MEF50 and Interpretation
Interpretation MEF50
Range Mean S.D.
Mild Restriction 4-135 64.2 35.8 Moderate Restriction 26-117 70.4 29.3 Severe Restriction 20-89 50.1 18.9
p 0.1503(not significant)
Table 19
MEF75 and Interpretation
Interpretation MEF75
Range Mean S.D.
Mild Restriction 6-137 55.5 33 Moderate Restriction 23-105 55.3 28.1 Severe Restriction 6-90 39.2 19
STATISTICAL ANALYSIS
This study included 60 Patients of Isolated Rheumatic mitral
stenosis aged between 10 and 51 years and 20 patients of control between 18 and 59 years
Male patients were 36 in group I Female patients were 24 in group I
In group II (Control), the Male Female ratio was 1:1
There was statistically significant difference in the pulmonary function values between the study cases and normal cases of the 60 patients in group I, 2 patient did not have any pulmonary dysfunction whereas 19 patients (31.7%) were found to have mild restrictive pattern in pulmonary function, 15 patient (25%) were found to have moderate restrictive pattern, and 24 patient 40% were found to have severe restriction.
In group II (Controls), all 20 patients were found to have no pulmonary dysfunction.
Spirometric parameters
Controls Vs cases
96.7% of patients were found to have mild to severe form of restriction.
As NYHA class increases, the restriction also increase. As mitral value size reduces, the restriction also increase.
DISCUSSION
The incidence and prevalence of Rheumatic Fever world wide are enormous. The prevalence of Rheumatic Fever and RHD is highly variable, with the highest rates in the middle eastern and sub-saharan African regions. For instance, it is estimated that 3.2 million patients had rheumatic heart disease in India in 1991 and atleast two thirds of these were young children. Rheumatic Fever is a major cardiovascular health problem in many nations of the world.
Chronic valvular heart disease develops in at least half of those affected by rheumatic fever with carditis. Two-thirds of cases occur in women. Some episodes of rheumatic fever may pass unrecognized and it is only possible to elicit a history of rheumatic fever or chorea in about half of all patients with chronic rheumatic heart disease. The mitral valve is affected in more than 90% of cases; the aortic is the next most frequently affected valve, followed by tricuspid and then the pulmonary valve. Isolated mitral stenosis accounts for about 25% of all cases of rheumatic disease and an additional 40% have mixed mitral stenosis and regurgitation.
In normal adults the mitral valve orifice is 4-6 cm2. In the presence
propelled by an abnormally elevated left atrio-ventricular pressure gradient. This is the hemodynamic hall mark of mitral stenosis. When the mitral valve opening is reduced to 1cm2, often referred to as “critical”
MS, a Left Atrial pressure of approximately 25 mm Hg is required to maintain a normal cardiac output. The elevated pulmonary venous and pulmonary arterial wedge pressure reduce pulmonary compliance, contributing to exertional dyspnoea.
Apical 4 chamber view showing Fish-mouth appearance of severe
The Rheumatic mitral stenosis patients are more prone to develop pulmonary dysfunction and the severity of mitral stenosis may influence the degree of lung function impairment. The clinical and haemodynamic features of mitral stenosis are influenced importantly by the level of the pulmonary arterial pressure. Fibrous thickening of the walls of the alveoli and pulmonary capillaries occur commonly in mitral stenosis. Pulmonary function abnormalities, like vital capacity, total lung capacity, maximum breathing capacity, and oxygen uptake per unit of ventilation are reduced. Airway resistance is abnormally increased and diffusion capacity is also reduced. These changes in the lungs are due, to increased transudation of fluid from the pulmonary capillaries into the interstitial and alveolar spaces. However, the increased capacity of the pulmonary lymphatic system to drain excess fluid retards the development of alveolar edema.
The Patient population and controls were matched with respect on age and sex. Statistical analysis revealed that age and sex did not statistically influence the pulmonary function abnormalities. It was observed that as the valve orifice diminishes there is progressive restriction in the pulmonary functions. Also as the mitral valve pressure gradient rises the pulmonary functions deteriorate producing progressive dyspnoea.
In a study of 105 patients with rheumatic mitral stenosis Hryniewiecki T, et al., demonstrated that 93.5% patients had lung function impairment predominantly restrictive pattern. They observed that as the severity of mitral stenosis increases, there is a progressive deteriation in the pulmonary function. In our study also, as depicted in Fig.7 there was a linear correlation between the severity of mitral stenosis and progressive restrictive pattern of pulmonary function abnormalities. It was documented in our study that 96.7% of patients with isolated rheumatic stenosis had features of restrictive pattern of pulmonary abnormality.
The restrictive dysfunction observed in this study was consistent with the study done by Chattarji et al. They found that a moderate restriction defect and small airway defect which is found in cases of mitral stenosis, directly correlates to the pulmonary artery pressure, left atrial pressure, mitral valve area and transmitral gradient. There was no significant involvement of the large airways. In our study also as demonstrated in Fig.6 there was an inverse correlation between mitral valve orifice area and severity of restrictive pattern of pulmonary function abnormalities.
LIMITATIONS
1. The study was restricted to the hospital patients. So if relevance in general population is unknown.
2. Though carefully designed and meticulously carried out, the study
is subject to subject error, instrument error and investigator error.
3. Class IV dyspnoea patients not included in this study.
4. Since the study was a cross sectional analysis, follow up the
CONCLUSION
Our study leads to the following conclusions
1. Most of the Isolated rheumatic mitral stenosis patients have mild to
severe restriction of pulmonary function.
2. The Rheumatic mitral stenosis patients when compared with controls, showed statistically significant reduction in EVC, FEVI, FVC, PEF, FEVI/FVC%, MEF50 MEF75.
3. The degree of restriction is correlated with grade of dyspnoea
(NYHA Class).
4. As the mitral valvular size decreases, the grading of dyspnoea (NYHA Class) increases.
5. As the mitral valve gradient increases, the degree of restriction also increases.
6. As the mitral valve size decreases, the mean mitral valve gradient increases.
BIBLIOGRAPHY
1. Harrison’s Principles of medicine 16th edition2005, p.1390.
2. Davidson’s Principles and practice of medicine, 19th edition 2002,
P.451.
3. Valvular heart disease / edited by Joseph.S. Alpert, James.E.Dalen,
Shahbudin H, 3rd edition P 41.
4. Murray and Nadel Text book of respiratory medicine 3rd edition
p.2309.
5. Gerald L.Baum and Emanuel wolinsky, Text book of pulmonary
diseases, 5th edition, vol.II, p.1649.
6. SpirosG, Michael R lung Function tests, medicine international;
1995,8,p.242.
7. Doyle AE et pulmonary vascular pattern in pulmonary hypertension Br.Heart 1957: 19: 355
8. Egeblad L.etal., Assessment of rheumatic mitral valve disease.
Br.Heart J 1983: 49; 38
9. Benow Ro et al : Acc / AHA Guidelines for management of patient
with valvular heart disease. J Am coll cordial 32:1486 1998
11.Kinkare, S.G. and Kulkarni, H.L. : Quantitative study of mitral valve in chronic rheumatic heart disease. Int.J.Cardiology. 16:271,1987
12.Hortskotte, D.Niehues, R., and Strauer, B.E.: Pathomorphological aspects, aetiology and natural history of acquired mitral valve stenosis. Eur.Heart J.: 12:55, 1991.
13.Taranta A., Kleinberg E., Feinstein, AR, : Rheumatic fever in children and adolescents. Relationship of the rheumatic rate per streptococcal infections to pre-existing clinical features of patients. Ann.Int Med. (suppl5) : 58-67, 1964
14.Meisner, J.S., Keren G., Pajaro, O.E., Mani A. et al: Atrial
contribution to ventricular filling in mitral stenosis. Circulation 84:1469-1480, 1991.
15.Abbo KM, Caroll JD, Hemodynamics of mitral stenosis: A review.
Cathetrization and Cardiovascular Diagnosis, Suppl. 2:16-25,1994
16.Barrington WW, Bashore T, Wooley CF : Mitral stenosis Mitral
dome excursion at M1 and mitral opening snap – The concept of reciprocal heart sounds. Am. Heart J. 115:1280-90, 1988.
17.Abernathy W, Willis P : Thromboembolic Complicatons of
18.Duchak J, Chang S, Feigenbam H : The Posterior Mitral Valve ECHO and the Echocardiographic diagnosis of Mitral stenosis. Am J Cardio 1972; Vol 29: P628-632.
19.Hryniewicki T, Rawcynska-Englery I, Malinowski R, et al. :
Analysis of airway function in patients with mitral valve disease in various stages of progression; Przegl Lek.1999;56(4):270-275. 20.Chatterji RS, Panda BN, et al. Lung function in mitral stenosis
J.Assoc Physicians India. 2000 Oct; 48 (10): 976-980
21.Mahmoud M. Nour, Hani Shuhaiber et al. Lung function and
severity of mitral stenosis; Medical principles and practice 1999; 8:32-39
PULMONARY FUNCTION TESTS IN ISOLATED
RHEUMATIC MITRAL STENOSIS
1. Name 2. Age 3. Sex
4. H/o. Hypertension, IHD, Aortic Valve disease, or any other congenital heart disease, bronchial asthma, pulmonary tuberculosis, COPD, H/o. smoking.
5. Any Respiratory disease : 6. Any Specific Complaints : 7. Clinical Features :
a. PR b) BP c) RR d) Chest expansion e) Temp f) JVP g) Clubbing h) Dyspnoea NYHA class I) CVS J) RS k) Abdomen l) Nervous System
8. Investigations
Alb TC
a) RBS b) Urine Sugar c) Blood DC
Deposits Hb
d) Blood Urea e) Serum Creatinine f) ECG g) X Ray – Chest h) ECHO i) Others
LVIDd (cm) LIVDs (cm) LVEF % RA, RV, LA & LV
Thickness MV Score for MS Subvalvular fusion Mobility Restriction
LA Clot Calcification
MVO (sq.cm) Pulmonary hypertension
Doppler studies Peak gradient Mean gradient
IMPRESSIONS
J. Pulmonary Function Test Para
Meter FVC FEV1 PEF FEF50 FEF75 FEV1/FVC EVC Impre ssion % of
Predicted
14. Treatment Particulars 15. Complications
Fig. 1. COMPARISON OF AGE BETWEEN CASES AND
CONTROLS
0 5 10 15 20 25 30 35
Mean S.D.
Fig. 2 SEX COMPOSITION OF THE STUDY POPULATION
0
10
20
30
40
50
60
Cases
Controls
Fig. 3 COMPARISON OF PULMONARY FUNCTION INDICES BETWEEN CASES AND CONTROLS
0
20
40
60
80
100
120
P
er
ce
n
ta
g
e
o
f
P
re
d
ic
te
d
EVC FEV1 FVC PEF FEV1/FVC% MEF50 MEF75
Parameters
Fig. 4. PIE CHART SHOWING DISTRIBUTION OF
ABNORMALITIES IN PULMONARY FUNCTION TEST IN
CASES AND CONTROLS
25
2.5
23.75 18.75
30
controls MS+Normal
Fig. 5 CORRELATION OF SEVERITY OF SYMPTOMS AND
ABNORMALITIES IN PULMONARY FUNCTION TEST
0
5
10
15
20
25
Mild Restriction Moderate Restriction Severe Restriction
Fig. 6. CORRELATION BETWEEN SIZE OF MITRAL VALVE
ORIFICE AND PULMONARY FUNCTION
0
0.2
0.4
0.6
0.8
1
Mild Restriction Moderate Restriction Severe Restriction
Fig. 7. CORRELATION OF MEAN MITRAL VALVE PRESSURE
GRADIENT (MVPG) AND PULMONARY FUNCTION TEST
0
5
10
15
20
25
Mild Restriction Moderate Restriction
Severe Restriction