PEDIATRIC RISK OF MORTALITY III
(PRISMIII) SCORE AS A PREDICTOR OF
MORTALITY IN PICU
Dissertation submitted for
M.D DEGREE EXAMINATION
BRANCH VII – PEDIATRIC MEDICINE
MADRAS MEDICAL COLLEGE
THE TAMILNADU DR. M.G.R. MEDICAL UNIVERSITY
CERTIFICATE
Certified that this dissertation titled “PEDIATRIC RISK OF
MORTALITY SCORING IN PICU, ICH& HC, EGMORE” is a bonafide work done by Dr.G.THIYAGU, M.D., post-graduate student of Pediatric Medicine,
Institute of Child Health and Hospital for Children, Madras Medical College,
Chennai, during the academic year 2003-2006.
Dr.Saradha Suresh.M.D.,D.C.H.,P.hD., Dr.Kulandhai Kasthuri.M.D.,D.C.H., Addl. Professor of Pediatrics, Addl. Professor of Pediatrics,
Institute of Child Health and Institute of Child Health and Hospital Hospital for Children, Hospital for Children,
Egmore, Chennai-8 Egmore, Chennai-8
Dr.Mangayarkarasi Senguttuvan. Dr.Kalavathy Ponniraivan.M.D., M.D., D.C.H., Dean,
Director and Superidendant, Madras Medical College Institute of Child Health and Chennai-3
SPECIAL ACKNOWLEDGEMENT
I gratefully acknowledge and sincerely thank
Prof. Kalavathi Ponniraivan M.D.,
Dean, MadrasMedical College, Chennai for granting me permission to utilize
ACKNOWLEDGEMENT
I am extremely thankful and grateful to our Respected Director, Prof. Mangayarkarasi Senguttuvan, M.D., D.C.H., for having permitted me to do this dissertation work.
I thank with a deep sense of gratitude my guide and unit chief Prof. Saradha Suresh, M.D., Ph.D., for the boundless affection, kind encouragement and constant support given by her throughout the study.
I am greatly indebted to Prof. Dr.R.Kulandai Kasthuri.,M.D., D.C.H.
for the unstinted guidance given by her throughout my study.
I thank the dedicated Assistant professors of PICU and my unit,
Dr.P.Ramachandran, Dr.S.Thangavelu , Dr.S.Shanthi , Dr.Annamalai Vijayaraghavan, Dr.D.Gunasingh, Dr.C.Subbulakshmi ,Dr.Luke Ravi Chelliah for their guidance and support.
I thank the Professors and the staff of the biochemistry and pathology
department, ICH&HC, Chennai for the help they provided during this study
Above all, I thank the children and their parents, who gave me an
CONTENTS
CONTENTS PAGE NO
1. INTRODUCTION 6
2. REVIEW OF LITERATURE 25
3. JUSTIFICATION FOR THE STUDY 32
4. OBJECTIVES 34
5. METHODOLOGY 35
7. RESULTS 38
8. DISCUSSION 56
9. CONCLUSION 60
10. REFERENCES 61
INTRODUCTION
Prognostication has always been the duty of a physician. This is
perhaps particularly true in the case of critically ill patients. With progress in
all specialities in pediatrics, pediatric critical care has also developed
tremendously. Nowadays Pediatric intensive care units are becoming
increasingly sophisticated in terms of equipment used and the types of
therapy administered in various acute illnesses. The evaluation and
prognostication of all cases admitted to the Pediatric Intensive Care Unit
(PICU) is important for various reasons. Scoring systems aim at providing
an objective measure of the severity and hence the prognosis of patients.
They are also important for medical audit and in the comparison of cohorts
of patients entering clinical trials. A scoring system is also a tool in resource
management . It helps in allocation of limited PICU facilities and provides
an index for the level of intervention appropriate for that patient. The
PRISM III score is one of the most recent scoring systems of pediatric
mortality. The outcome of pediatric intensive care has not been widely
reported in India and few studies describe the use and validation of any
scoring system. This study aims at using the PRISM III score in a PICU in a
SCORING SYSTEMS
Scoring Systems and their Need:
There is an increasing emphasis on the evaluation and monitoring of
various aspects of health care services. Scoring systems aim at providing an
objective and measurable value for any such service. The goal is to provide
the highest quality of care with the available resources to achieve the best
outcome. All scoring systems are designed to quantify and reduce a number
of discreet but interrelated patient characteristics to a single value. This
value can be used to further compare and analyse various aspects like
disease severity, therapies used or final outcome. The scoring system forms
the backbone of any hospital audit.
Scoring Systems in Critical Care:
Like in other areas of health care, intensive care also needs
audit and evaluation of clinical effectiveness. Although various modalities of
treatment are available, no strict guidelines exist for the likelihood of
successful therapy. The clinical effectiveness of any therapy requires
research to measure outcome. Outcome audit can be done by measurement
of mortality, morbidity, disability, functional health status and quality of life.
of outcome. However, in intensive care areas, deaths do offer a sensitive
and appropriate measure. Thus, predicting mortality and the scoring systems,
which do this, become a tool for evaluation of quality of care.
Scoring systems aim at an equation to estimate probability of
outcome. Each system has a group of independent variables (case mix) and
the dependent variable (death) in the form of a mathematical equation. The
equation is applied to the current intensive care unit statistics and a death
rate is derived. The actual and expected death rates are compared.
Scoring Systems: Historical Aspects and Examples:
Perhaps the first known scoring system developed was in the care
of the newborn – the APGAR score 1, in 1953. Many unscientific
observations and steps for resuscitation were practiced at the time. The
APGAR score, which assessed objectively cardiovascular, pulmonary and
neurologic systems, aimed to serve as a comparison of the results of
obstetric practices, maternal sedation and efficacy of resuscitation. Glasgow
Coma Scale 2, which was introduced in 1974 by Teasdale and Jenette for
evaluating severity of the neurological insult, is another important scoring
Applications of Scoring Systems:
Scoring systems provide a measurable, objective value for the outcome
variable being studied. In the intensive care setting, most scores measure
probability of mortality. This data is used for purposes of clinical research,
performance assessment and resource allocation.
a. Clinical research: The scores are used as an objective measure to
demonstrate equivalence of study and control patients in various
therapeutic trials. Data from scoring systems are used for inclusion
criteria to enroll patients within a specified severity or risk range. The
data also enable risk stratification for outcome comparisons.
b. Performance assessment: Data from the scoring systems allows use of
treatment resources within a given setup. Comparison between hospitals
with similar patient populations as well as outcome of a single Intensive
Care Unit over time can be performed with the help of these data.
c. Resource allocation: Data generated from various scoring systems can
help in optimal allocation of resources based on the severity of illness and
Use of Scoring Systems in the Pediatric ICU
Pediatric intensive care is a rapidly evolving area in pediatric
medicine. A more complete understanding of the pathophysiological
processes in critically ill infants and children has led to statistical
refinements in intensive care units. It is important to develop methods for
evaluation of this area of care. As PICUs are multidisciplinary in nature,
generic classification systems, not confined to one area (e.g. trauma) but to
critical care in general are important and necessary. These scoring systems
must be applicable to patients with a wide variety of disease states.
Types of Scoring System:
Scoring systems can be developed for intensive care in general (e.g.
APACHE, PRISM) or for specific conditions like trauma (e.g. TRISS –
Trauma injury severity score). Scoring systems may be based on:
a. Anatomical extent of injury
b. Physiologic derangement
Anatomical Extent of Injury:
Anatomic scoring systems are used for trauma in order to
assess the extent of injury. Example for this is Pediatric Trauma Score3.
Pediatric trauma score takes into account a child’s size, the accessibility of
airway, the systolic blood pressure, the level of consciousness and the
presence or absence of wounds and fractures.
Therapeutic Intervention Scoring System and Clinical classification
system 4:
The type of intervention used in the intensive care setting is the third
principle in the development of score. The number of therapeutic
interventions a patient warrants is measured to reflect the severity and hence
the prognosis
The Therapeutic Intervention scoring System (TISS) was the first scoring
system used to assess critically ill pediatric patients. The patients were
quantitatively evaluated for the amount of care received with the TISS and
categorized qualitatively for severity of illness, Clinical Classification
System (CCS).
The Clinical Classification System was defined as follows:
Class II (physiologically stable patients requiring prophylactic overnight
observation)
Class III (physiologically stable patients requiring intensive nursing and
monitoring)
Class IV (physiologically unstable patients requiring intensive nursing and
physician care)
The TISS scores and CCS classification were found to be consistent in
mortality rates.
Physiology based Scoring Systems :
Physiological Stability Index (PSI) 5:
Physiologic scoring systems measure physiological derangement as a
disruption to homeostasis. Various physiologic parameters are weighted to
reflect prognostic impact. These various physiological measurements come
together as a score to reflect prognosis.
A physiology based classification system applicable to critically ill
pediatric patients was developed and validated in 1982. This was the PSI or
Physiological Stability Index. Each variable in PSI was assigned a score of
Score 1 = range abnormal but no need for change in therapy
Score 3 = abnormal with need for change in therapy
Score 5 = indicates immediate life-threatening situations.
E.g.PaO2 50-60 = score 1; 40-49 = score 3 and < 40 = score 5.
The PSI was validated based on CCS and TISS. From the data
collected, a predicted mortality based on logistic regression analysis was
constructed in which probability of death was determined from the PSI
score. This was subsequently again validated by a multi-institutional cohort
Pediatric Risk of Mortality Score (PRISM Score) 6, 7
The pediatric risk of mortality (PRISM) score was developed from the
Physiology Stability Index. The number of physiological variables required
for Pediatric Intensive Care Unit (PICU) mortality risk assessment was
reduced while aiming for an objective weighting of remaining variables.
Univariate and multivariate statistical techniques were applied to admission
day PSI data (1415 patients, 116 deaths) from four PICUs. The resulting
PRISM score consists of 14 routinely measured physiological variables and
six PICUs (1227 patients, 105 deaths) using chi-square goodness-of-fit tests
and receiver operating characteristic (ROC) analysis. It was found that the
number and distribution of survivors and non survivors and mortality risk
was accurately predicted.
TABLE 1: PRISM SCORE
Variable Age restriction and range Score
Infants Children
Systolic BP(mmHg) 130-160 150-200 2
>160 >200 6
55-65 65-75 2
40-54 50-64 6
<4 0 <50 7
Diastolic BP (mmHg) >110(all ages) 6
Heart rate (beats/min) >160 >150 4
Resp rate (breaths/min) 61-90 51-70 1
>90 >70 2
Apnea Apnea 5
PaO2/FIO2 200-300 (all ages) 2
<200 (all ages) 3
>65 (all ages) 5
G C S <8 6
Pupil reaction Unequal/dilated 4
Fixed and dilated 10
PT/PTT 1.5x control 2
Total bilirubin (mg/dl) >3.5(> 1 month) 6
Potassium (mEq/L) 3.0-3.5 1
6.5 – 7.5 1
<3.0/ >7.5 5
Calcium (mg/dl) 7.0-8.0 2
<7 / >15 6
Glucose(mg/dl) 40-60 4
250-400 2
<40 / >400 8
Bicarbonate (mEq/L) <16 2
Development of PRISM III Score 7
A new pediatric physiology based score for mortality risk, Pediatric
Risk of Mortality III (PRISM III) has been developed. This was developed
involving 32 PICUs. Physiological data included the most abnormal values
from the first 12 and second 12 hours of the PICU stay. Outcome and
descriptive data was also analysed. Variables were stratified by age
(neonate, infant, and child, adolescent). Data was collected from 11,165
admissions and 543 deaths. The PRISM III has 17 physiological variables
subdivided into 26 ranges. The PRISM III is said to have a better age
adjustment for selected variables. Analysis revealed no difference in
mortality prediction between 12 hour and 24 hour scores.
Variables in PRISM III but not in earlier PRISM include
temperature, pH, PaO2, creatinine, BUN, white blood cell count and platelet
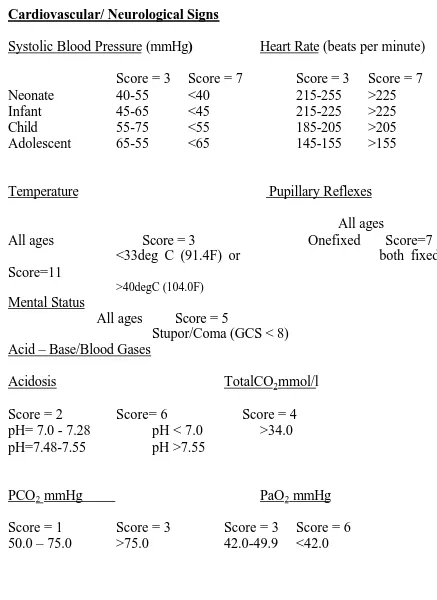
TABLE 2: PRISM (III) SCORE
Cardiovascular/ Neurological Signs
Systolic Blood Pressure (mmHg) Heart Rate (beats per minute)
Score = 3 Score = 7 Score = 3 Score = 7
Neonate 40-55 <40 215-255 >225
Infant 45-65 <45 215-225 >225
Child 55-75 <55 185-205 >205
Adolescent 65-55 <65 145-155 >155
Temperature Pupillary Reflexes
All ages
All ages Score = 3 Onefixed Score=7 <33deg C (91.4F) or both fixed Score=11
>40degC (104.0F) Mental Status
All ages Score = 5
Stupor/Coma (GCS < 8) Acid – Base/Blood Gases
Acidosis TotalCO2mmol/l
Score = 2 Score= 6 Score = 4
pH= 7.0 - 7.28 pH < 7.0 >34.0
pH=7.48-7.55 pH >7.55
PCO2 mmHg PaO2 mmHg
Score = 1 Score = 3 Score = 3 Score = 6
Biochemistry
Glucose Potassium
Score = 2 Score=3
>200 mg/dl >6.9 mmol/l
Creatinine Blood Urea Nitrogen
Score=2 Score = 3
Neonate >0.85 mg/dl Neonate >11.9mg/dl
Infant >0.90mg/dl All other >14.9mg/dl
Child >0.90mg/dl
Adolescent >1.30mg/dl
Hematology
White Blood Cell count (cells/mm3) ProthrombinTime(PT) or Partial Thromboplastin time
Score=3 Score = 3
<3000 Infant PT>22.0 or PTT > 85.0
All other PT>22.0 or PTT > 57.0 Platelet Count (cells/mm3)
Score=2 Score=4 Score=5
Statistical Analysis :
Receiver Operating Curve:
During validation of a scoring system, the discrimination and
calibration are measured. Discrimination tests the ability of a model to
determine patients who live (when death is the outcome variable) from
patients who die. The cutoff points of probability are plotted to give a
receiver operating characteristic (ROC) curve. The greater the true positive
rate to the false positive rate, the greater is the area under the ROC curve.
The area may range from 0.5 (purely due to chance) to 1.0 (perfect).
Calibration tests the extent of agreement between the expected and actual
numbers of hospital deaths across subgroups of patients. The agreement
across the whole range is tested using the goodness of fit statistics.
The ROC curve is a graphical representation of the discriminative
power of a test. Any biological variable e.g. hemoglobin has a range of
normal values. If one cut off point is chosen to differentiate normal from
abnormal, at the extremes of the range there are bound to be false positives
and false negatives. Based on where the cut off point is assigned the test will
return either many false positives (specificity poor but sensitivity good) or
many false negatives (sensitivity poor but specificity good). Thus we require
For any particular test (a laboratory value or scoring system) various cut off
points are plotted as sensitivity (true positives) against true negatives
(1-specificity). The resulting curve is the ROC curve. The curve demonstrates
the discriminative power (to separate for example recovery from death in a
mortality score) at various score points. The test is said to have good
performance if the area under the curve nears 1. A 0.5 result is interpreted as
worthless as this could be by pure chance and the laboratory test or scoring
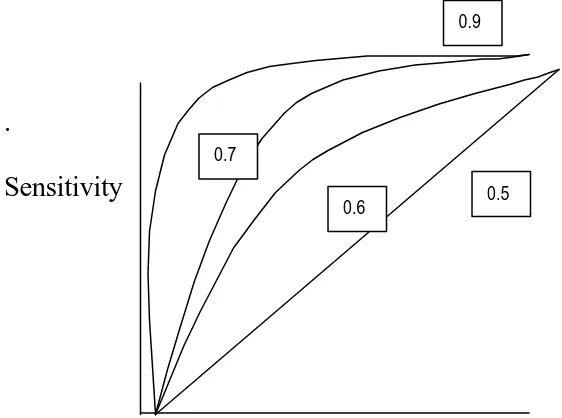
system has not had a good discriminative power. The following ROC curve
[image:20.612.106.387.437.646.2]demonstrates the area under the curve and its interpretation.
FIGURE 1 RECEIVER OPERATING CURVE AND ITS DISTRIBUTION
.
Sensitivity
1 - Specificity
0.5 0.9
A rough guide for classifying the accuracy of a diagnostic test is the
traditional academic point system:
.90-1 = excellent (A)
.80-.90 = good (B)
.70-.80 = fair (C)
.60-.70 = poor (D)
.50-.60= fail
Statistical analysis was also performed using both
univariate and multivariate analysis. Risk factors that were seemed to
significantly contribute to mortality after univariate analysis were
further analysed using logistic regression multivariate model the factors
studied included PRISM III , assisted ventilation, Glasgow Coma Scale ,
Shock, age and sex .
Need for New Scores:
The relationship between physiological status and morbidity risk
may change as new treatment protocols, therapeutic interventions and
as new therapies ameliorate the requirement for ICU care. The new patient
characteristics have to be incorporated into the scoring database. Newer
scores avoid therapeutic variables that may be unduly influenced by practice
patterns.
Limitations of Scoring Systems :
Every score has an average miscalculation rate of 10-15%. The
following are the important limitations in the area of prognostic scoring
systems.
Certain limitations have been identified in the use of scoring systems.
1. Limitation of application: Detailed instructions as to how to apply the
system are not mentioned often. For instance, inclusion criteria, time period
of data collection and different outcome variables are not provided.
1. Limitation of data collection in scoring: The original database for
development varies in validity, reliability and completeness. The details
of this are rarely reported. Generally, missing data are reported as
normal. The confounding effect of this on the scoring is not made clear.
2. Limitation of accuracy of scoring systems: Due to insufficient adjustment
of case mix in the original database, the scoring may not be valid in all
3. Limitation in interpretation of results: Scoring systems like TISS
(Therapeutic intervention scoring system) look at therapy used; the
therapy employed may not be available in all ICUs. The Treatment
practices may vary from one ICU to another. Further, the
appropriateness of the therapy chosen is not verified. The probability
data from scoring systems have to be evaluated with the understanding of
these shortcomings.
4. Though death is the most “convenient” outcome variable, merely using
mortality prediction scores ignores quality of life or morbidity issues.
Also, it disregards the group of physiologically stable patients who need
intensive observation not possible without an ICU setting. Though these
patients may have a low score based on the predictive models, their need
for ICU care cannot be disregarded.
5. None of the scoring systems can be used to predict individual patient
outcome.
6. Resource utilization is an important aim of scoring systems. Patients,
who are moribund with a very high probability of death, survive for only
a few hours in the ICU. These patients derive little benefit from the ICU.
However, as hospitals by protocol admit these patients to the ICU; their
7. Scores based on therapeutic interventions have the fallacy of physicians’
perception of illness. There is no way to ensure a uniform system of
interventions for a variety of problems and PICUs.
8. Current scoring systems do not account for changes in the status of a
patient in the ICU for a prolonged duration. It is unlikely that a score
REVIEW OF LITERATURE
A number of studies have been done using the PRISM score. These
primarily look at three aspects:
1 Validation of usefulness of PRISM score
2 New ways of utilizing this score
3 Comparison of the PRISM to other scoring systems.
Validation of Usefulness of PRISM Score :
Gemke et al 8 studied the utility of the score in a Dutch PICU and
found close agreement between pediatric ICU mortality rate in the study
population compared to the original American study. Kanter et al 9 showed
that pre-ICU PRISM score to be a good measure of illness severity and that
it provides an estimate of hospital mortality. In their study, a score of 24
meant a higher than 50% chance of mortality. Proulx et al 10 observed
multiple organ failure during PICU, age <12 months and PRISM score on
the day of admission to be independent risk factors of death. Tan et al 11
from Singapore showed accurate prediction of mortality with the PRISM III
However, all workers have not found the positive results. Wells et
al 12 from South Africa found poor discriminatory performance of the
PRISM score. This was uniform for all age groups and diagnostic
categories. Particularly important was the poor performance in infants. The
overestimation of severity of illness in infants by this score was also studied
by Goddard 13. A study from Thailand 14 compared PRISM scores in their
patients with respiratory failure. While there was a statistically significant
difference between the scores of survivors to non-survivors, they found that
PRISM under predicted mortality in their population. It is interesting to note
that these studies were not based in the United States. It clearly showed that
the score was not population independent and that demographic
characteristics and disease patterns might have caused the poor performance
of the score.
The limitation of the PRISM score in acute renal failure in children
has been described by Fargason et al 15. They found a considerable overlap
of scores between survivors and non-survivors. Children with acute renal
failure secondary to other diseases had a higher mortality than those with
primary renal disease. However, the scores underestimated mortality in the
former group. Thus it was argued that the PRISM score cannot be used to
The applicability of the PRISM score has been tested in various other
scenarios. Monroe et al 16 has shown the application of PRISM in triage of
diabetic ketoacidosis.
Pollock et al 17 found significantly more infections (10.8%) occurred
in those with higher compared to lower (3.4%) scores. However, it was
found that though sensitivity is 75% (75% 0f those with infection have a
higher score), the positive predictive value is only 11%, i.e. Only 11% of
those identified as having a high score will develop a nosocomial infection.
Orr et al 18 studied the possible use of PRISM score to estimate the
requirement of interventions during the transport of a critically sick child.
They found that the score underestimates the requirement for both intensive
care and interventions during inter-hospital transport. It was found that low
scores had a low negative predictive value; i.e. they were not necessarily at
low risk despite their low scores.
The use of PRISM in submersion injuries has been studied by
Zuckerman et al 19. They found that the PRISM score accurately
distinguished patients who would die or suffer neurological impairment.
The score cutoff was 25. However it is interesting to note that the
assessment of score was done in the emergency department and not in the
been termed “lead time”. It is a cause for concern when assigning scores in
PICU, as any stabilization of patients’ condition in the emergency
department will not be reflected in the ultimate PRISM score. The PRISM
scoring done in the PICU at admission has no ability to score for
interventions already performed before the PICU admission. This will no
doubt lead to lower scores in children who would have presented with
markedly abnormal physiology.
Comparison of PRISM with other Scoring Systems:
Though specific scoring systems have been developed for trauma, the
PRISM score has also been evaluated for its role in trauma assessment.
Castello et al 20 compared the use of ISS (Injury Scoring System) to PRISM.
PRISM was more sensitive an indicator of resource utilization but less
sensitive for determining risk adjusted mortality compared to ISS. It was
also found that PRISM underestimates the mortality associated with head
trauma.
The PRISM score has also been evaluated for specific disease states.
Leteurtre et al 21 compared the PRISM to the PIM (Pediatric Index of
Mortality) in children with meningococcal septic shock. They found that the
New ways of using PRISM score:
The validity of the PRISM score done at the time of admission has
been debated when the patient has to stay in the ward for a long time. A
patient in the PICU for an extended period has an admission PRISM score
which may not predict his/her ultimate outcome several days later.
Balakrishna et al 22 in their study found a sensitivity of 48% and specificity
of 99%. They elucidated the fact that prediction was most accurate when the
stay was between 1 to 4 days.
The aim of scoring systems has always been to simplify and decrease
the number of parameters needed for assessment while maintaining the
accuracy of prediction of the desired outcome variable. It is interesting to
note that Pollack et al6, 7 the original authors of the Prism score have
compared various PICUs using PRISM score where there has been missing
data. This usually occurred when a particular variable which is part of the
score, is a laboratory parameter which is clinically not required for that
particular patient. Pollack et al have shown that these missing variables
which were clinically not indicated do not affect the ultimate scoring or
prediction. It is common practice to score “Zero” when a parameter is not
Scoring Systems in Indian Intensive Care Units:
The use of scoring systems in ICU’s in India is limited. Eapen et al 23
used the APACHE II 24 score and compared it to the modified organ system
failure (OSF) score.
The APACHE II was applied to a neurology-neurosurgery ICU in a
municipal hospital in Bombay by Parikh 25. The mortality rate was higher
than the west but similar care was much cheaper. Singhal et al 26 from
St.John’s hospital, Delhi, have applied the PRISM score and demonstrated
its usefulness. They studied 100 patients with 18 died and 82 survived.
Among them, 49 children had the score of 1-9 with a mortality of 8.2% and
45 children with the score of 10-19 with a death of 24.4%. There were 3
patients with the score of 20-29 with a considerably higher mortality of
33.3% and 3 patients with the score >30 had the highest mortality of 66.3%.
ROC analysis in their study showed area under the curve of 72%.
With better understanding and newer technology in pediatric
critical care more studies with the use of standard scores are required. These
should aim at:
1. Validating current scoring systems
2. Modifying current scores to our unique demographic and disease pattern
The present study aims at using the PRISM III score in an Indian PICU to
validate its usefulness and study further applications of such a score in a
JUSTIFICATION FOR THE STUDY
Following rapid advances in medical therapy and critical care
technology in recent years, coupled with the spiraling cost of medical care,
outcome analysis including mortality risk prediction is important for the
physicians.
Institute of Child Health and hospital for Children is a tertiary
care centre in the government sector which is the principal referral unit
providing treatment free of cost not only for the children from the state of
Tamilnadu but also from the neighbouring states like Andhra Pradhesh.
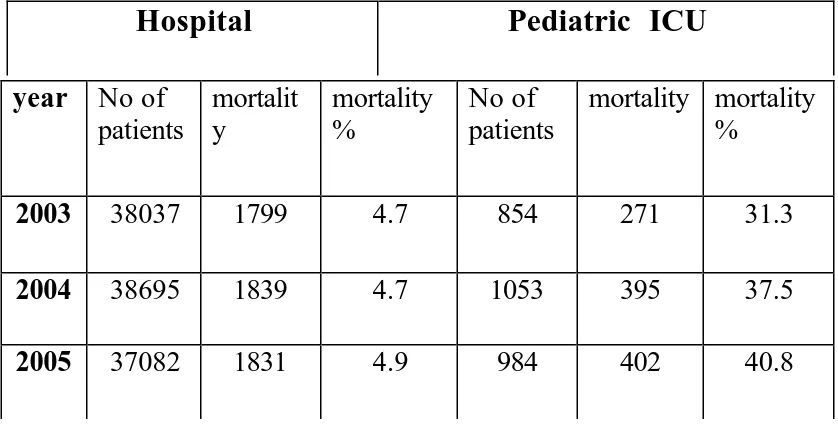
During 2005, There were about 37000 patients admitted to this hospital with
a total death of 1831(4.9). Total number of patients admitted to Pediatric
Intensive Care Unit (PICU) were 984 with a mortality of 402 (40.8%) in the
same year indicating that PICU has nearly 10 times more mortality than
overall mortality of ICH. The admission and mortality rate for the whole
hospital and PICU for the year 2003, 2004 and 2005 are given in the table 3.
So mortality risk prediction will be a useful tool for the intensivists for
counseling of parents as well as for resource allocation. Being the most
hospitals in South Asia, performance of the PICU, ICH can be compared
[image:33.612.92.511.215.429.2]with the other PICUs by using PRISM III score.
TABLE 3: MORTALITY PATTERN IN INSTITUTE OF CHILD HEATH
Hospital
Pediatric ICU
year No of
patients
mortalit y
mortality %
No of patients
mortality mortality %
2003 38037 1799 4.7 854 271 31.3
2004 38695 1839 4.7 1053 395 37.5
OBJECTIVES
Primary:
To validate the usefulness of PRISM III score in predicting mortality in a
Pediatric Intensive Care Unit in Tamilnadu government tertiary care hospital
setting.
Secondary:
. To assess the factors contributing to mortality such as need for
METHODOLOGY
Study Design:
This study is a descriptive study to validate a diagnostic scoring
system namely, PRISM III.
Study Place:
Pediatric Intensive Care Unit (PICU), Institute of Child Heath and
Hospital for Children (ICH & HC), Chennai
Sample Size:
Annually, 900- 1000 children are admitted in PICU, Institute of
Child Health with a mortality rate of 30-40 %. For an expected sensitivity of
85%, for the PRRISM III score to predict mortality, 119 patients need to be
studied. EPIINFO software was used for calculating the sample size.
Duration:
Total duration of the study was 18 months starting from June 2004.
Protocol was prepared for 3 months. Study was conducted for the next one
year followed by, analysis for 3 months.
Inclusion Criteria:
All patients admitted into PICU, Institute of Child Health and Hospital
Exclusion Criteria:
1. Patients in ICU for less than 2 hours (e.g. shifted to ICU for observation)
2. Age less than 1 month
3. Presence of multiple congenital anomalies
4. Patients admitted with continuous CPR who do not achieve stable vital
signs for > 2 hours.
Characteristics of the PICU, Institute of Child Heath
The Pediatric ICU of Institute of Child Heath and Hospital for Children is
a 14 bedded unit. Patients over 1 month of age to 12 years who require intensive
care are admitted, with the exception of patients with trauma and burns.
Admissions are primarily through the Emergency department or from the Pediatric
general wards. One Professor and three Assistant Professors look after the unit.
Four Pediatric post graduate residents are dedicated exclusively to the Pediatric
ICU and are posted in shifts. The PICU has six ventilators. Blood gas analysis and
electrolytes analysis are available at the bedside while hematology and
biochemical investigations are dispatched to a central laboratory which caters to
the rest of the hospital also. The PICU is also equipped with a pediatric
defibrillator.
The following procedures are routinely done in the Pediatric ICU:
a. Mechanical Ventilation
Maneuver:
PRISM III scoring which involves both clinical and laboratory data
was done once at the time of admission or within 24 hours after admission using a
pretested proforma . The clinical condition at arrival to the PICU was
documented and not the condition at arrival to the Emergency department. For
variables1–5 (clinical parameters) the most abnormal reading in the first 24 hours
was recorded. The monitoring of the vital parameters – blood pressure, heart rate,
temperature, pupillary reaction and Glasgow Coma Scale was done by the pediatric
resident. For the other laboratory parameters, the values obtained at the time of
admission were recorded. The patient’s course of PICU stay was monitored and
the duration of stay and outcome were recorded .The PRISM III scoring was
assigned to each record.
System -wise classification was done. The group Infection was
defined as those who with no definite focus of infection and who were not
classified under any particular system. If a child had both clinical and
investigative evidence of a definite focus of infection, he/she was classified under
that system. The child continued to be in that group irrespective of further
complications in the PICU which may have been the immediate cause of death
e.g. a ventilator associated pneumonia in a child with viral encephalitis. For
RESULTS
Children who fulfilled the inclusion and exclusion criteria and
whose parents consented to be included in this study were enrolled. A total
of 120 such children were studied. The results are presented in the following order.
I. PRISM III SCORE
a. PRISM III score
b. PRISM III score and mortality
c. Receiver Operating Curve (ROC)
II.CLINICAL PICTURE
a. age distribution
b. sex distribution
c. clinical diagnosis
d. duration of stay
III. ASSOCIATED FACTORS
a. presence of shock
b. need for ventilatory care
c. Glasgow Coma Scale of less than 8
IV. UNIVARIATE ANALYSIS
PRISM III Score
The minimum PRISM score in this study was 0 and the maximum PRISM
score was 31 with a mean of 7.92. The mode is 8 and the median is 7. The mean
PRISM III score for those who recovered was 6.05 and for those who died was
13.54. The distribution of the PRISM score with the number of patients is shown in
the following histogram. Clustering of cases occurs in the region of 7 and 8.
FIGURE 4: DISTRIBUTION OF PRISM SCORE
0 2 4 6 8 10 12 14 16 18 20
No Of Patients
0 2 4 6 8 10 12 14 16 18 20 22 24 26 28 30
PRISM score
MEAN: 7.9
MEDIAN: 7
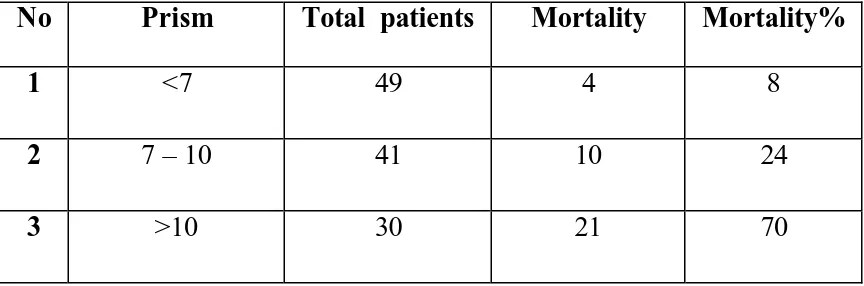
PRISM III score and Mortality
Mortality risk was found to be increasing with increase in the score.
When the score increased by 1, the risk of mortality raised to 1.4 on an
average. When the score was less than 7, the mortality risk was only 8%
while between 7 and 10 ( including those who scored 7 and 10 ) the risk
was 24% which clearly showed that there was a 3 fold increase in the
death risk.. If the score was more than 10, the risk had raised to 70%
with 7 fold increase in the mortality than those who had the score less than
[image:40.612.78.510.504.647.2]7 which is given in the table 4.
TABLE 4 : RANGES OF PRISM SCORE AND MORTALITY
No Prism Total patients Mortality Mortality%
1 <7 49 4 8
2 7 – 10 41 10 24
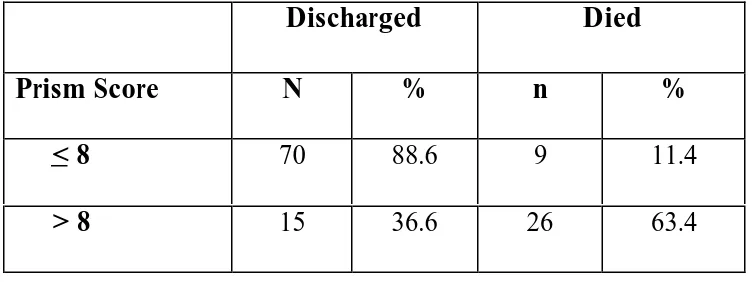
CHILDREN WITH PRISM SCORE <8 AND THOSE WHO HAVE >8:
Based on experience with the previous studies, cutoff for the PRISM
score which delineates the higher mortality risk from the lower mortality risk was
calculated as 8 and analysis was done for those who had score more than 8 and
those who had 8 and below which showed a p value of 0.00 which was statistically
significant as shown in the table 2. Those who have a score of less than 8 had a
[image:41.612.81.458.375.516.2]mortality risk of 11.4 % and those who crossed it had 63.4% mortality risk.
TABLE 5 : PRISM SCORE < 8 AND MORTALITY
Discharged Died
Prism Score N % n %
< 8 70 88.6 9 11.4
> 8 15 36.6 26 63.4
Chi square value: 35.35
Receiver Operating Curve
In this study, the area under the ROC curve is 0.853 and the 95% confidence
interval is 0.78, 0.93. The best cutoff is at 8 with a sensitivity of 74% and
specificity of 82%. The Prism score would be considered to be "good" at
predicting mortality.
FIGURE 2: RECEIVER OPERATING CURVE
1 - Specificity
1.00 .75
.50 .25
0.00
Sensitivity
1.00
.90
.80
.70
.60
.50
.40
.30
.20
.10
Clinical Picture:
Age distribution:
Among them, 39 were infants (those who were less than 1 year
including those who were 1 year old), 63 were children (between 1 and 10 years of
age- excluding 10) and 18 were adolescents i.e. Those who aged 10 years and
above. The average age of children studied was 4.11 years (range: 1 month – 12
years).
FIGURE 3: AGE DISTRIBUTION
Infants 33%
children 52% adolescents
15%
Infants
children
Sex Distribution:
In this study of 120 children, 56 children were females and 64 were
males. 65 children were directly admitted from the Emergency Room (E.R.) and
the rest were transferred in from the general pediatric ward, who became sick and
needed intensive care, during their stay in the general pediatric wards.
FIGURE 4: SEX DISTRIBITION
64
56
20 40 60 80 100
Clinical diagnosis:
Diagnosis of the children enrolled was classified based on the system
involved and the distribution of the diseases is given below. Neurological
diseases were the major cause for admission to the PICU, followed by Respiratory
diseases, Infections, Cardio Vascular diseases, Gastro Intestinal Diseases, Renal
and Hematological diseases.
FIG 5: CLINICAL DIAGNOSIS
32.5
22.5 22.5
8.3 5
2.5 1.7
5
Neurological Respiratory Sepsis
Cardiovascular Gastro intestinal Hematological Renal
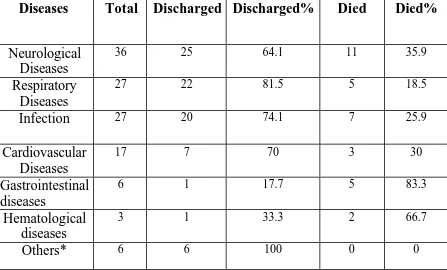
The diagnoses of the children were classified into 7 broad categories and
are given in table. Because of the small sample size, children with snake bite,
scorpion sting and diabetic keto acidosis were included in the others’ list as shown
[image:46.612.72.519.358.628.2]in the following table.
TABLE 5: DIAGNOSIS AND MORTALITY ANALYSIS
Diseases Total Discharged Discharged% Died Died%
Neurological Diseases
36 25 64.1 11 35.9
Respiratory Diseases
27 22 81.5 5 18.5
Infection 27 20 74.1 7 25.9
Cardiovascular Diseases
17 7 70 3 30
Gastrointestinal diseases
6 1 17.7 5 83.3
Hematological diseases
3 1 33.3 2 66.7
Others* 6 6 100 0 0
The following table shows the distribution of the Neurological diseases,
which formed the major clinical diagnosis admitted in PICU and it is given in the
following table.
TABLE 6 : NEUROLOGICAL DISEASES AND MORTALITY
Diagnosis No of
cases
% Mortality %
Neurological diseases 39 32.5 14 35.9
Acute encephalitis 15 8
Pyogenic meningitis 10 3
Seizure disorder/status epilepticus 6 0
Gullaine-Barre syndrome 2 0
TB meningitis 2 0
Cervical cord lesion 2 2
Hydrocephalus with SIADH 1 0
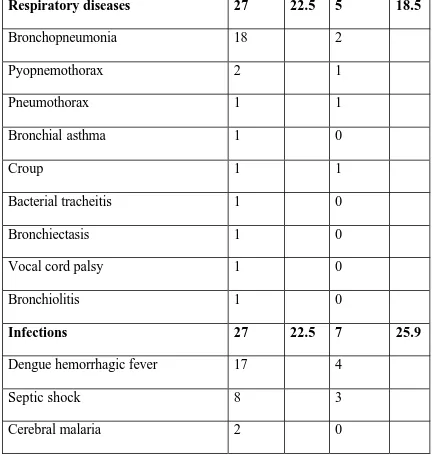
Respiratory diseases and Infections were major disease categories that were
admitted in our PICU. Distribution and mortality pattern is given in the following
[image:48.612.64.503.219.674.2]table.
TABLE 7: RESPIRATORY DISEASES AND INFECTION AND THEIR
MORTALITY
Respiratory diseases 27 22.5 5 18.5
Bronchopneumonia 18 2
Pyopnemothorax 2 1
Pneumothorax 1 1
Bronchial asthma 1 0
Croup 1 1
Bacterial tracheitis 1 0
Bronchiectasis 1 0
Vocal cord palsy 1 0
Bronchiolitis 1 0
Infections 27 22.5 7 25.9
Dengue hemorrhagic fever 17 4
Septic shock 8 3
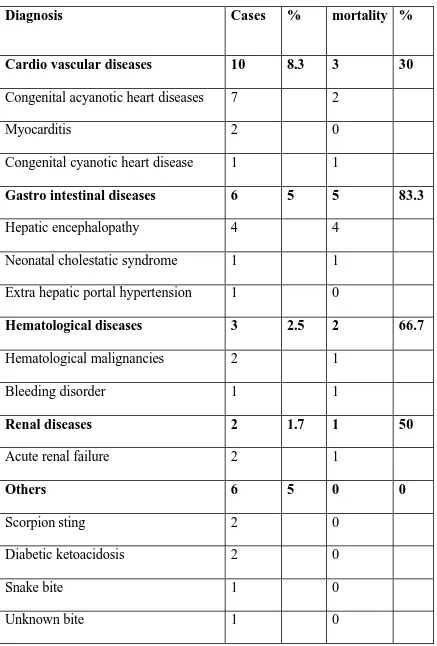
TABLE 8 MINOR CLINICAL DIAGNOSES AND MORTALITY
Diagnosis Cases % mortality %
Cardio vascular diseases 10 8.3 3 30
Congenital acyanotic heart diseases 7 2
Myocarditis 2 0
Congenital cyanotic heart disease 1 1
Gastro intestinal diseases 6 5 5 83.3
Hepatic encephalopathy 4 4
Neonatal cholestatic syndrome 1 1
Extra hepatic portal hypertension 1 0
Hematological diseases 3 2.5 2 66.7
Hematological malignancies 2 1
Bleeding disorder 1 1
Renal diseases 2 1.7 1 50
Acute renal failure 2 1
Others 6 5 0 0
Scorpion sting 2 0
Diabetic ketoacidosis 2 0
Rest of the disease categories like Cardio vascular diseases, Gastro
intestinal diseases, Hematological diseases and others formed only 27 cases out of
120 cases studied (22.5%) which is given in the table 8.Mortality is highest for
Gastro Intestinal diseases followed by Hematological and Renal diseases. Majority
of Gastro intestinal diseases to get admitted in our PICU were children with stages
of hepatic encephalopathy which had a very poor prognosis.
Duration of Stay Analysis:
Average duration of stay in the PICU was 6.4 days (range 8 hours to 58
days). The median for those who died was 3 and those who were discharged was 4.
This is depicted in table 8.
TABLE 9 : DURATION OF STAY AND MORTALITY
Discharged Died
Duration of stay in PICU in days[Median]
Associated Factors Analysis :
Common risk factors for poor outcome like age less than 1 year,
patients with a Glasgow Coma Scale score of less than 8, those who presented
with shock , those who required mechanical ventilation to find out whether there
was any significant association. Sex was also analyzed for poor outcome. Variables
like sex ,age and shock did not show any statistical significance.
TABLE 10: ASSOCIATED FACTORS AND MORTALITY
Alive Dead
N % n %
Odds
Ratio p-value Age
<1 year 28 71.8 11 28.2
> 1 year 57 70.0 24 30.0
0.93 0.83
Sex
Male 43 75.3 21 24.7
Female 42 83.5 14 16.5
1.46 0.83
Shock
Present 44 63.8 25 36.2
Absent 41 80.4 10 19.6
2.65 0.05
Ventilation
Required 39 54.9 32 45.1
Not required 46 93.9 3 6.1
12.58 0.00
GCS score
<8 30 52.6 27 47.4
>8 55 87.3 8 12.7
But variables like assisted ventilation, Glasgow Coma Scale of less than or
equal to8 and PRISMscore of less than or equal to 8 showed statistical significance
with a p value of less than 0.01 as given in the table 10.
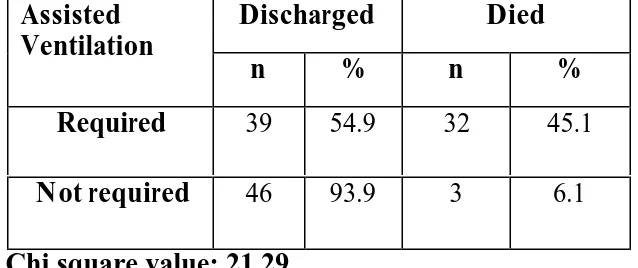
Need for Assisted Ventilation:
In this study, 71 patients required assisted ventilation. As requirement
of assisted ventilation is a risk factor for poor outcome, it was analyzed
statistically. The analysis showed clearly that there was a significant correlation
with a p value of less than 0.05. The average duration of assisted ventilation was
5.3 (range: 8 hours- 29 days). 28 children from emergency room and 3 children
from the general pediatric ward were intubated and started on tube and bag
ventilation even before they were transferred to the PICU. Rest were intubated and
[image:52.612.133.452.535.669.2]put on assisted ventilation in the PICU.
TABLE 10: NEED FOR ASSISTED VENTILATION AND MORTALITY
Discharged Died
Assisted Ventilation
n % n %
Required 39 54.9 32 45.1
Not required 46 93.9 3 6.1
Presence of Shock:
Presence of shock is a common indication for admission to our PICU.
There were 69 out of 120 cases presented with shock. Among them 26 were
admitted through emergency room and 23 were admitted from general pediatric
ward. Patients presented with shock were analysed statistically with those who
did not present with shock but it failed to show any significant association with
mortality.
TABLE 11: PRESENCE OF SHOCK AND MORTALITY
Discharged Died
Shock
N % n %
Present 44 63.8 25 36.2
Absent 41 80.4 10 19.6
Chi square: 3.93
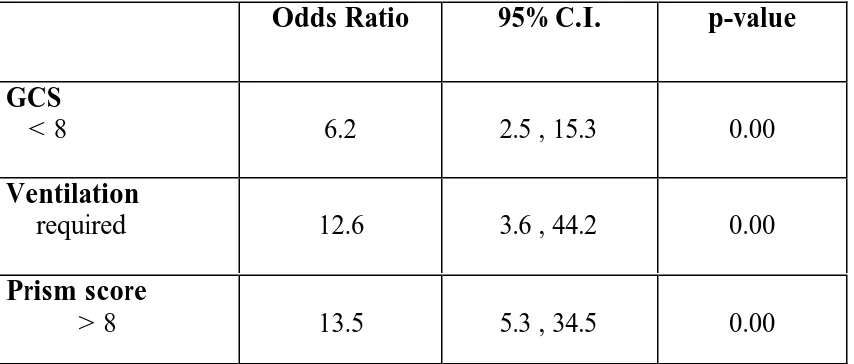
Univariate Analysis:
Univariate analysis for the parameters like Glasgow Coma Scale, Need for
assisted ventilation and PRISM cutoff of 8 were done. All had the p value of
less than 0.01. PRISM score had the highest odds ratio than the other two.
Those who had PRISM of more than 8 had about 14 times higher mortality
risk than those with less than 8. Next to PRISM, patients who needed
assisted ventilation had 13 times higher risk than who did not need it while
Glasgow Coma Scale of less than 8 had a risk 6 times more than those
[image:54.612.69.496.471.653.2]who had more than that.
TABLE 12: UNIVARIATE ANALYSIS
Odds Ratio 95% C.I. p-value
GCS
< 8 6.2 2.5 , 15.3 0.00
Ventilation
required 12.6 3.6 , 44.2 0.00
Prism score
Multivariate Analysis
Risk factors that were deemed to significantly
contribute to mortality like PRISM III score > 8, Glasgow coma scale of less
than 8 and need of assisted ventilation were further analyzed using logistic
regression multivariate model. Glasgow coma scale of less than 8 failed to
show stastically significant association in multivariate analysis but the other
two namely, PRISM score of more than 8 and the need for assisted
ventilation showed statistical significance with the outcome as shown in
[image:55.612.75.502.407.584.2]table 13.
TABLE 13: MULTIVARIATE ANALYSIS
Adjusted O.R. 95% C.I. p-value
GCS
<8 2.1 0.7 , 6.4 0.20
Ventilation
required 10.8 2.7 , 44.1 0.001
Prism score
DISCUSSION:
The use of scoring systems and the audit of intensive care has not been
widely reported in India. There have been few studies addressing the needs of
pediatric critical care. Most scoring systems are designed in the west and need to
be validated in our own country. The performance of the PRISM III score in our
study showed a good performance of prediction of mortality with the ROC curve
analysis having an area under the curve of just 0.853. (85% correct prediction).
Singhal et al 25 found the ROC analysis to be 72% in their study using the PRISM
score. Their conclusion was that the PRISM score was a good predictor of
mortality. Surekha Joshi et all 27in their study in B.Y.L. Nair Hospital, Mumbai,
which was presented in All India Pediatric Conference-2006 (Pedicon’2006) ,
found that PRISMIII score was useful in predicting mortality. Clearly the PRISM
score has performed well in our study and it is comparable to the original
developers who found ROC analysis (Pollock et all 6,7 )of more than 90%.
The concept of lead time has to be discussed. As the PRISM scoring done at
admission to PICU, the physiological instability with which a patient presents to
the emergency room is not accounted for. The various therapies started in the
emergency room to maintain optimal vital parameters present a falsely low score at
admission to the PICU. This is obviously not representative of the true
room. The fact that PRISM score works better if assessed in the emergency room
has been demonstrated indirectly by Zuckerman 19 where PRISM was assessed in
the emergency room for children with submersion injuries.
As the mean PRISM III score is significantly lower in those who were
discharged (6.0) than those who died (13.5), its estimation does throw light on the
severity of disease process. The PRISM III scores were equally valid in the three
main subgroups of sepsis, respiratory and central nervous system disorders. These
subgroups will form the majority of cases in any Indian PICU. This means that the
assessment of the PRISM score in the population will provide:
1. Prediction of mortality
2. Objective measure of severity of disease
3. Ability to compare cohorts of patients with similar scores for audit and
therapeutic interventions.
4. Ability to compare performance of a single PICU over time or different PICUs
When comparing the performance of PRISM III in different organ
systems, the results are not very different. This has also been shown by Fargasonet
all15 where patients with renal failure were assessed with the PRISM score. In that
study as the prediction of outcome was poor, a decision of advising or withholding
of dialysis based on the score was not possible. The number of subjects in this
A number of queries have been raised regarding the validity of a score
done at admission when the duration of stay is prolonged. However our data found
no statistically significant difference in the PRISM III scores even with prolonged
stay. This in no way affected the prediction of mortality.
A limitation of the PRISM III score is its need for many laboratory
investigations. It cannot function as a triage score as it is expensive to do the entire
set of tests required in the PRISM III score. We faced difficulty in doing arterial
blood gases and coagulation profiles as every admission did not require blood gas
analysis or the clotting parameters to be assessed.
Limitations of Current Study and Need for Future Studies:
The original scores were developed with larger numbers of patients and
at many centres. The current study has been done on a relatively small number of
subjects. The validity of a score like the PRISM III will have to be observed by a
multicentric trial which will allow for larger case mix and hence more
representative of an average Indian PICU.
1.The original PRISM III score has no provision for pre ICU interventions which
will have a bearing on the score. The present study has not analysed the number of
such patients who required therapy in the emergency room, much before the
PRISM III scoring was done. The score may provide a better prediction of
1. Specific larger studies looking at particular disease states will be required to
verify system-wise performance of the Prism III score.
2. Simpler scoring systems which do not need many laboratory parameters will
allow for such systems to be used in peripheral hospitals also.
3. No individual patient decisions can be taken based on the PRISM III scoring
alone. This has been a common limitation in all mortality scoring systems.
4. While the outcome variable of mortality may be acceptable in a PICU, the
PRISM III has no measure of morbidity or ultimate outcome in terms of
disability after transfer from the PICU. Newer scores which quantify disability
and long term outcome are required to be developed.
5. One of the aims of any scoring system is the optimal use of resources. Though
the PRISM III score correlates well with chances of mortality this information
alone will not affect utilisation of PICU resources. No child can be denied
admission to the PICU based on a low PRISM III score alone if clinically he /
she warrant close monitoring. The same also holds true for a moribund child
admitted with a very high score. Based on the high score and very high
probability of mortality admission and therapy cannot be with held. Thus use of
PICU resources will continue as required by the individual hospital’s needs and
CONCLUSIONS
• PRISM III score provides an objective assessment of the severity of illness
• PRISM III performed well as a tool to predict mortality in an Indian PICU
• Scoring systems with fewer laboratory parameters will be more useful in our
context
• Larger studies are needed to develop/ validate a mortality prediction score for
REFERENCES
1. Apgar V. A proposal for a new method of evaluation of the newborn
infant. Anesth Analg 1953; 32:260.
2. Teasdale G, Jennett B. Assessment of coma and impaired consciousness. A practical scale. Lancet 1974; 2:81.
3. Ford EG, Andrassy: Pediatric trauma initial assessment and management. Philadelphia,
WB Saunders, 1994; 112-113
4. Yeh TS, Pollack MM, Holbrook PR et al Assessment of pediatric intensive
care-application of the therapeutic intervention scoring system. Crit Care Med. 1975; 3:222.
5. Yeh TS, Pollack MM, Ruttiman UE, et al . Validation of a physiological stability index
for use in critically ill infants and children. Pediat Res .1984; 18:445.
6. Pollack MM, Ruttiman UE, Getson PR .The Pediatric risk of Mortality (PRISM) score.
Crit Care Med 1988; 16: 1110-1116.
7. Pollack MM, Patel KM, Ruttiman UE.PRISM III: An updated Paediatric Risk of Mortality. Crit Care Med 1996; Vol 24, 743-752
8. Gemke RJ, Bonsel GJ, van Vught AJ.Effectiveness and efficiency of a Dutch pediatric
intensive care unit: validity and application of the Pediatric Risk of Mortality score. Crit Care
Med, 1994; 22(9):1477-84.
10.Proulx F, Gautheir M, Nadeau D, Lacroix J, Farrell CA. Timing and predictors of
death in pediatric patients with multiple organ system failure. Crit Care Med 1994; 22:
1025-1031.
11. Tan GH, Tan TH, Goh DY, Yap HK. Risk factors for predicting mortality in a
pediatric intensive care unit. Ann Acad Med Singapore 1998; 27 (6): 813-8.
12. Wells M, Riera-Fanego JF, Luyt DK, Dance M, LipmanJ. Poor discriminatory performance of the Pediatric Risk of Mortality (PRISM) score in a South African intensive care
unit. Crit Care Med 1996; 24(9):1507-13.
13. Goddard JM. Pediatric risk of mortality scoring overestimates severity of illness in
infants. Crit Care Med 1992; 20(12):1662-5.
14.Deerojanawong J, Prapphal N, Udomittipong K. PRISM score and factors predicting
mortality of patients with respiratory failure in the pediatric intensive care unit. J Med Assoc
Thai 2001; 84(1):568-75.
15. Fargason CA, Langman CB. Limitations of the pediatric risk of mortality score in
assessing children with acute renal failure. Pediatr Nephrol 1993; 7:703-707.
16. Monroe KW, King W, Atchison JA. Use of PRISM scores in triage of pediatric patients
with diabetic ketoacidosis. Am J Manag Care. 1997; 3(2): 253-8.
17. Pollock E, Ford-Jones EL, Corey M, Barker G, Mindorff CM, Gold R, Edmonds J,
Bohn D. Use of the Pediatric Risk of Mortality score to predict nosocomial infection in a pediatric intensive care unit; Crit Care Med 1991;19(2):160-5.
18.Orr RA, Venkataraman ST, Cinoman MI, Hogue BL, Singleton CA, McCloskey KA.
Pretransport Pediatric Risk of Mortality (PRISM) score underestimates the requirement for
19. Zuckerman MD, Gregory PM, Suzanne M; Predictors of Death and Neurological
Impairment in Pediatric Submersion Injuries. Arch Pediatr Adolesc Med 998;152: 134-40.
20. Castello FV, Cassano A, Gregory P, Hammond J.The Pediatric Risk of Mortality
(PRISM) Score and Injury Severity Score (ISS) for predicting resource utilization and outcome of intensive care in pediatric trauma. Crit Care Med 1999;27(5):985-8.
21.Leteurtre S,Leclerc F,Martinot A,Cremer R,Fourier C, Sadik A, Grandbastien. Can
generic scores (Pediatric Risk of Mortality and Pediatric Index of Mortality) replace specific
scores in predicting the outcome of presumed meningococcal septic shock in children? Crit Care Med. 2001; 29(6):1239-46.
22. Balakrishna G, Aitchison T , Hallworth D, Morton NS. Prospective evaluation of
Paediatric Risk of Mortality Score.Arch Dis Child 1992; 67(2):196-200.
23. Eapen CE, Thomas K, Cherian AM, Jeyasheelan L, Mathai D, John G. Predictors of mortality in a medical intensive care unit, Christian Medical College, Vellore .Natl Med J Ind.
1997;10(6) 270-2.
24. Knaus WA, Zimmerman JE, Wagner DP, et al. APACHE- acute physiology and chronic
health evaluation: a physiologically based classification system. Crit Care Med 1981; 9:591.
25. Parikh CR, Karnad DR. Quality, Cost, Outcome of intensive care in a public hospital in
Bombay, India. Crit Care Med 1999; 27; 27(9): 1754-9
26. Singhal D,Kumar N, Puliyel JM, Singh SK, Srinivas V. Prediction of mortality by application of PRISM score in Intensive Care Unit . Indian Pediatrics 2001; 38: 714 – 719
ANNEXURE
Proforma
Name age
Hospital number sex
Date of admission in ward:
Number of days in ward:
Date of admission in PICU:
Diagnosis and reason for admission in PICU:
Number of days in PICU:
Date of death / discharge:
PRISM III scoring
1) Systolic BP (mm Hg)
2) Heart rate
3) Temperature (o F)
4) Pupillary Reflexes Normal
One fixed, one reactive Both fixed
5) Mental Status
8)tCO2
9) PaO2
10) Glucose
11) Potassium
12) Creatinine
13) Blood Urea Nitrogen
14) WBC count
15) Platelet count
16) PT / PTT
Other Contributing Investigations:
Blood sodium:
Blood bicarbonate:
Blood NEC:
Blood leptospirosis:
Blood viral studies
Blood QBC:
Blood LFT: bilirubin total
Direct
Indirect
SAP:
Proteins Total
Albumin
Globulin
Blood smear:
Urine albumin
Sugar
Deposit
Urine culture and sensitivity:
Urine ketone bodies:
Cerebro spinal fluid: protein
Sugar
Culture and sensitivity
Cells
Xray chest:
Echocardiography:
Ultrasonagraphy - cranium
Ultrasonography - abdomen:
CT Scan:
Others if any:
Diagnosis: (1 / 2 / 3 / 4 / 5 / 6 / 7 / 8 )
(1-Neurological diseases / 2- Respiratory diseases / 3-Sepsis / 4-Cardio Vascular diseases / 5- Gastro intestinal diseases / 6- Hematological diseases / 7- Renal diseases / 8- Others)
Outcome: (1/2)
(1-discharged / 2- died)