A STUDY ON MICROALBUMINURIA IN SYSTEMIC
HYPERTENSION AS AN INDICATOR OF TARGET ORGAN
DAMAGE
Submitted in partial fulfilment of
Requirements for
M.D. DEGREE BRANCH I GENERAL MEDICINE
Of
THE TAMILNADU DR.M.G.R. MEDICAL UNIVERSITY, CHENNAI.
MADRAS MEDICAL COLLEGE
CHENNAI – 600 003.
CERTIFICATE
This is to certify that this dissertation entitled “A STUDY ON
MICROALBUMINURIA IN SYSTEMIC HYPERTENSION AS
AN INDICATOR OF TARGET ORGAN DAMAGE” submitted by
Dr. HEMANATH. T. R. appearing for Part II M.D. Branch I General
Medicine Degree examination in February 2006 is a bonafide record
of work done by him under my direct audience and supervision in
partial fulfillment of regulations of the Tamil Nadu Dr. M.G.R.
Medical University, Chennai. I forward this to the Tamil Nadu
Dr.M.G.R. Medical University, Chennai, Tamil Nadu, India
Dean,
Madras Medical College, Government General Hospital, Chennai – 600 003.
Director,
I solemnly declare that the dissertation titled “A STUDY ON
MICROALBUMINURIA IN SYSTEMIC HYPERTENSION AS AN
INDICATOR OF TARGET ORGAN DAMAGE” is done by me at
Madras Medical College & Govt. General Hospital, Chennai during
2004-2005 under the guidance and supervision of
Prof. V. Sundaravadivelu, M.D.
The dissertation is submitted to The Tamilnadu Dr. M.G.R.
Medical University towards the partial fulfilment of requirements for
the award of M.D. Degree (Branch I) in General Medicine.
Place: Chennai
Date:
Dr. Hemanath, T. R., M.D. General Medicine Postgraduate Student
ACKNOWLEDGEMENT
I would like to express my sincere gratitude to my beloved
Professor and Director, Institute of Internal Medicine Prof. D. D.
Jayakumar, M.D., for his guidance and encouragement.
With extreme gratitude, I express my indebtedness to my
beloved Chief Prof. V. Sundaravadivelu, M.D., for his motivation,
advice and valuable criticism, which enabled me to complete this
work.
I am extremely grateful to Prof. V. Jagannathan, M.D., D.M.,
Professor of Cardiology, for granting me permission to utilize
Echocardiographic services of Department of Cardiology for the
study.
My sincere thanks to Prof. T. S. Swaminathan, M.D., DMRD,
FICR, Director, Barnard Institute of Radiology, Madras Medical
College for granting me permission to utilize Doppler services of
Muthirulandi, M.D., DM., and Dr. Haridoss Sripriya Vasudevan.,
M.D., for their co-operation and guidance.
I thank Dr. Gnanavel., M.D.,D.M., and Dr. Arul, M.D.,D.M.,
Assistant Professors of Cardiology for their help in Echocardiography.
I thank Dr. Mary Ramola M.D., Assistant Professor, Institute of
Social and Preventive medicine, Madras Medical College for her
immense help in statistical analysis.
I thank all Professors, Assistant Professors, Post-graduates of
Barnard Institute of Radiology and Department of Cardiology for their
valuable suggestions and motivation.
I would always remember with extreme sense of thankfulness
for the co-operation and criticism shown by my Postgraduate
I am immensely grateful to the generosity shown by the patients
who participated in this study. If at all, this study could contribute a
little to relieve them from their suffering I feel that I have repaid a
CONTENTS
Sl. No. Title Page No.
1. Introduction 1
2. Objectives of the study 3
3. Review of Literature 4
4. Materials and Methods 37
5. Statistical analysis 43
6. Observations 44
7. Charts & Graphs
8. Discussion 50
9. Conclusion 53
10. Scope for future studies 54
11. Proforma
12. Master chart
INTRODUCTION
BP level per se has long been acknowledged as an unreliable
indicator of subsequent morbid events in patients with primary
hypertension. Recently, the concept that global cardiovascular risk,
rather than the severity of hypertension, should guide both the
decision to begin treatment and the identification of individual target
pressure levels has been endorsed by international agencies 1, 2.
In fact, results of large epidemiological studies clearly
demonstrated that regardless of the severity of hypertension, the cost
effectiveness of BP reduction by means of drug therapy is greater in
the presence of target organ abnormalities and/or co-morbidities.
In this context, assessment of subclinical organ damage, namely
of left ventricular hypertrophy and peripheral atherosclerosis,
however, very much depends on the diagnostic technique employed.
Routine use of ultrasound technology, for example, leads to higher
sensitivity in detecting cardiac and vascular structure abnormalities
health care systems should be carefully taken into consideration
before recommending routine application of an expensive diagnostic
approach to the stratification of risk.
Thus, the development of low cost, accurate, clinical tools to
identify hypertensive patients at highest risk is of the utmost
OBJECTIVES OF THE STUDY
1. To correlate the presence of microalbuminuria and the
presence of subclinical target organ damage in patients with
essential hypertension
2. To ascertain relationship between amount of albumin
REVIEW OF LITERATURE
SYSTEMIC HYPERTENSION
An elevated arterial pressure is probably the most important
public health problem in developed countries. It is common,
asymptomatic, readily detectable, usually easily treatable, and often
leads to lethal complications if left untreated.
The prevalence of hypertension depends on both the racial
composition of the population studied and the criteria used to define
the condition. In females, the prevalence is closely related to age, with
a substantial increase occurring after an age of 50. This increase
presumably related to the hormonal changes of menopause, although
the mechanism is unclear. The ratio of hypertension frequency in
women versus men increases from 0.6 to 0.7 at an age 30 to 1.1 to 1.2
at age 65. Arterial pressure fluctuates in most persons whether they
Essential Hypertension
Patients with arterial hypertension and no definable cause are
said to have Primary, Essential or Idiopathic hypertension. Many
mechanisms involved in the regulation of the arterial pressure:
peripheral; and/or central adrenergic, renal, hormonal, and vascular.
These systems are integrated in a complex fashion with input from
multiple genes. Several abnormalities have been described in patients
with essential hypertension, often with claim that one or more of them
are primarily responsible for the hypertension.
A number of environmental factors have been implicated in the
development of hypertension, including salt intake, obesity,
occupation, alcohol intake, family size, and overcrowding. These
factors have all been assumed important in the increase in blood
pressure with age in more affluent communities.
Salt intake has received the greatest attention as the
environmental factor. This factor illustrates the heterogenous nature of
calcium intake, a generalised cellular membrane defect, insulin
resistance and “nonmodulation”.
Insulin resistance and/or hyperinsulinemia have been suggested
as being responsible for the increased arterial pressure. This feature is
now widely recognized as part of syndrome X or the metabolic
syndrome.
INSULIN RESISTANCE & HYPERTENSION
Insulin resistance is common in patients in patients with type 2
diabetes mellitus and obesity; both of these conditions are more
common in hypertensives than in normotensive subjects. However,
several studies have found that hyperinsulinemia and insulin
resistance are present even in lean hypertensives without type 2
diabetes, suggesting that this relationship is more than a coincidence.
Hyperinsulinemia can increase arterial pressure by one or more
1) Hyperinsulinemia produces renal sodium retention (at least
acutely) and increases sympathetic activity
2) Vascular smooth muscle hypertrophy secondary to mitogenic
actions of insulin.
3) Insulin modifies cell membrane ion transport, thereby
potentially increasing cytosolic calcium levels of insulin
sensitive vascular or renal tissues
4) Insulin resistance may be a marker for another pathologic
process (nonmodulation).
EFFECTS OF HYPERTENSION
Patients with hypertension die prematurely; the most common
cause of death is heart disease, with stroke and renal failure frequent,
particularly in patients with significant retinopathy. These
complications are due to the target organ damage done by the
Cardiac compensation for the excessive workload imposed by
increased systemic pressure is at first sustained by concentric
hypertrophy and increased LV mass of left ventricle. Ultimately, the
function of this chamber deteriorates, the cavity dilates, and the
symptoms and signs of heart failure appear. Angina pectoris may also
occur because of the combination of accelerated coronary arterial
disease and increased myocardial mass.
Evidence of ischemia or infarction may be observed late in the
disease. More deaths due to hypertension result from myocardial
infarction or congestive heart failure. Recent data suggest that some of
the myocardial damage may be mediated by aldosterone in the
presence of a normal/ high salt intake rather than just the increased
blood pressure or an increase in angiotensin II levels per se. Increased
LV mass is one of the early indicators of subclinical target organ
NEUROLOGIC EFFECTS
The neurologic effects of longstanding hypertension may be
divided into retinal and central nervous system changes. Since retina
is the only tissue in which the arteries and arterioles can be examined
directly, repeated ophthalmoscopic examination provides the
opportunity to observe the progress of the vascular effects of
hypertension. The Keith-Wagener-Barker classification of the retinal
changes in hypertension has provided a simple and excellent means
for serial evaluation of hypertensive patients.
Keith-Wagener-Barker classification
Hypertensive retinopathy – Hypertension
Degree
General narrowing,
AV ratio
Focal
Spasm Hge’s Exudates Papilledema
Normal 3:4 1:1 - - -
Grade I 1:2 1:1 - - -
Grade II 1:3 2:3 - - -
Grade III 1:4 1:3 + + -
Grade IV Fine, fibrous
cords
Obliteration of distal
flow
Degree Arteriolar light reflex AV crossing defects
Normal Fine yellow line, red blood
column None
Grade I Broadened yellow line, red
blood column
Mild depression of
vein
Grade II
Broad yellow line “Copper Wire”, blood column not seen
Depression or humping of vein
Grade III
Broad yellow line “Silver line”, blood column not seen
Right angle deviation, tapering,
disappearance of vein
under the arteriole,
distal dilatation of vein
Grade IV Fibrous cords, blood
column not visible Same as Grade III
Central nervous dysfunction also occurs frequently in patients
with hypertension. Occipital headaches, most often occurring in the
morning, are among the most prominent early symptoms of
hypertension. Light-headedness, tinnitus, vertigo, and dimness of
vision or syncope may be observed, but the most serious
manifestations are due to vascular occlusion, hemorrhage, or
encephalopathy. The pathogeneses of the two former disorders are
Cerebral infarction is secondary to the increased atherosclerosis
observed in hypertensive patients, whereas cerebral hemorrhage is the
result of both the elevated arterial pressure and the development of
cerebral vascular microaneurysms (Charcoat-Bouchard aneurysms).
Only age and arterial pressure are known to influence the development
of microaneurysms. Thus, it is not surprising that arterial pressure
shows a better association with cerebral hemorrhage than with either
cerebral or myocardial infarction.
Hypertensive encephalopathy consists of the following symptom
complex: severe hypertension, disordered consciousness, increased
intracranial pressure, retinopathy with papilloedema, and seizures.
The pathogenesis is uncertain but is probably related to arteriolar
spasm or cerebral edema. Focal neurologic signs are infrequent and, if
present, suggest that infarction, hemorrhage, or transient ischemic
attacks are more likely diagnosis. Although some investigators have
suggested that prompt lowering of arterial pressure in these patients
may adversely affect cerebral blood flow, most studies indicated that
EFFECTS ON THE KIDNEY
Arteriosclerotic lesions of the afferent and efferent arterioles
and the glomerular capillary tufts are the most common renal vascular
lesions in hypertension and result in a decreased glomerular filtration
rate and tubular dysfunction. Proteinuria and microscopic hematuria
occur because of glomerular lesions, and about 10% of the deaths
caused by hypertension result from renal failure.
CLASSIFICATION OF HYPERTENSION
Systemic hypertension in any population is a continuous
variable. Since there is no dividing line between normal and increased
blood pressure, arbitrary levels have been established to define
persons who have an increased risk of developing a morbid
cardiovascular event and/or will benefit from medical therapy. These
should be based on both systolic and diastolic pressure, age, sex, race
The level of systolic pressure is very important in assessing the
influence of arterial hypertension on cardiovascular morbidity. Data
increasingly suggest that it may be more important than diastolic
pressure, especially in those over the age of 50. A reduction in
mortality and morbidity with treatment of systolic hypertension,
specifically in the elderly, has been documented. The beneficial effect
results from a reduction in strokes mainly.
European Society of Hypertension – European society of Cardiology
guidelines for arterial hypertension – Classification2
1) Based on the average of 2 or more readings taken at each of
two or more visits after an initial screening
2) Adults aged 18 years or more
3) Patient should not be taking antihypertensive drugs or in a
acutely ill state
4) Higher category should be selected when systolic and
Category Systolic BP, mmHg Diastolic BP, mmHg
Optimal <120 <80
Normal <130 <85
High Normal 130-139 85-89
Hypertension
Stage 1 (Mild) 140-159 90-99
Stage 2 (Moderate) 160-179 100-179
Stage 3 (Severe) ≥180 ≥110
Isolated Systolic HTN ≥140 <90
Joint National Committee – Seventh report (JNC 7 Classification)1
2003
BP classification SBP in mmHg DBP in mmHg
Normal < 120 and < 80
Prehypertension 120-139 or 80-89
Stage 1 hypertension 140-159 or 90-99
Investigations
The basic tests to be performed in all patients are described
below
1. Always included
a. Urine for protein, blood, and glucose
b. Microscopic analysis
c. Hematocrit
d. Serum potassium
e. Serum creatinine and/or blood urea nitrogen
f. Fasting glucose
g. Total cholesterol
h. Electrocardiogram
2. Usually included, depending upon cost and other factors
a. Thyroid stimulating hormone
b. White blood cell count
c. HDL, LDL, and Triglycerides
d. Serum calcium and phosphate
e. Chest X-ray
Special studies to screen for secondary hypertension:
1. Renovascular disease: ACE inhibitor radionucleotide renal scan,
Renal duplex Doppler studies, and MRI angiography
2. Pheochromocytoma: 24-h urine assay for creatinine,
metanephrines, and catecholamines
3. Cushing’s syndrome: Overnight dexamethasone suppression test
or 24-h urine cortisol test
4. Primary aldosteronism: Plasma aldosterone: renin activity ratio
MICROALBUMINURIA
Microalbuminuria (MAL) is defined as abnormally elevated
excretion or concentration of albumin in urine but without clinical
proteinuria. The term MAL was coined by Guy’s Hospital group in
Studies as early as 1982 by Viberti et al. showed increased
albumin excretion even with normal proteinuria may herald onset of
nephropathy4.
Microalbuminuria is found in 8 to 15% of hypertensive patients
and cannot be detected by routine urine tests 5-8. However, several
sensitive, reliable techniques (radioimmunoassay, enzyme linked
immunosorbent assay, nephelometry) have now become widely
available in clinical practice 9.
The relatively large variability of microalbuminuria reported in
nondiabetic hypertensive patients is likely due to differences in the
techniques used to detect it and in the criteria used for patient’s
selection. Thus, lower values have been reported in patients taking
antihypertensive drugs, especially those that interfere with the
renin-angiotensin system (RAS), or in those with a milder degree of
hypertension. In addition, the modality of urine collection (spot versus
24 hrs) and the number of samples collected for each patient
Screening for MAL in urine can be performed in three ways10
1) Measurement of albumin creatinine ratio in random collection
2) 24 hours collection
3) Timed collection
Definitions of abnormality in albumin excretion
Category
24hrs collection mg / 24 hrs.
Timed collection
µg / min
Spot collection
µg/mg of creatinine
Normal <30 <20 <30
Microalbuminuria 30 – 300 20 – 200 30 – 300
Clinical albuminuria >300 >200 >300
MAL: Normal variants
The urinary albumin excretion rate can vary highly from day to
have smaller variations. Measurement of 24 hr. urine volume has
probably the lowest variability. Hence, more than one urine collection
has been advocated as necessary before convincingly labeling a
patient microalbuminuric.
Transient increase in albumin excretion occurs in acute illness,
stressful situations, exercise, water diuresis, prolonged upright
posture, poor metabolic control in diabetics.
Higher urine albumin excretion was also noted in people of
Asian origin, people with high BMI, daytime urine samples and with
increasing age.
MAL can be found in diabetics and non-diabetic individuals
with hypertension, UTI, cardiac decomposition and non-diabetic renal
disease.
Ratio of urinary albumin to creatinine ratio in a random sample
measurement of UAE by other methods.
Methods of measurement of human albumin in urine
Several methods were employed with varying sensitivity,
measurement time for urine albumin excretion. They were as follows:
Method Time for assay
Single radial immunodiffusion Mancini et al 1 day
Electroimmunossay12 Laurell 1966 4-6 hrs
Immunoturbidometric assay13 Teppo 1982 20-30 min
RIA14 Keen 1963 1-2 days
ELISA15 Fielding 1983 5-6 hrs
Zone immunoelectrophoresis Vesterberg 16-18 hrs
Fluorescent immunoassay15 Charves 1984 4-6 hrs
Micral test17
It is a semiquantitative test for estimation of urine
albumin, which has to be confirmed further, by quantitative tests. In
this test, urine albumin combines with soluble antialbumin
galactosidase conjugate, which moves on substrate pad where
galactosidase reacts with chlorophenon red galactoside changing color
from yellow to red.
Microalbuminuria: Physiological considerations
The glomerular transport of albumin depends upon several
factors, the electric charge and size of the molecule, membrane status
and specific renal hemodynamics18. The fractional excretion of
albumin which is defined as fraction of albumin clearance rate is low
(<0.1%) due to negative charge and large molecular size of albumin.
Onset of microalbuminuria and its determinants
The stage of transition between normoalbuminuria and
behind the defect in filtration barrier is not yet known. Studies in
patients with MAL have show conflicting results regarding
pathophysiological changes in the glomerular and extraglomerular
compartment. The structural and functional abnormalities in diabetic
kidney results due to interplay between varieties of genetic, metabolic,
haemodynamic alterations.
Mechanisms of Nondiabetic Microalbuminuria
The pathogenic mechanism(s) underlying the development of
microalbuminuria are currently poorly known. The severity of BP load
and the increased systemic permeability to albumin, possibly due to
early endothelial dysfunction, seem to play a major role, although
several data suggest interplay with a number of additional factors,
such as lipid abnormalities, prothrombotic factors, increased activity
of RAS, and systemic inflammation. Finally, a functional
haemodynamic abnormality and/ or the presence of structural changes
Irrespective of its exact nature and pathogenesis, the
unfavorable prognostic significance of albuminuria has recently been
confirmed by long-term longitudinal studies19,20. Based on these data,
an increased urinary albumin excretion (UAE) can be regarded as a
specific, cost-effective tool for the identification of patients at highest
risk and searching for microalbuminuria can be recommended as part
of the initial work-up of every hypertensive patient. Screening for
microalbuminuria should be included in initial investigations in the
management of systemic hypertension and also in type 2 diabetes
mellitus.
Pathogenesis of microalbuminuria in hypertension
Many patients with high blood pressure have a renal abnormality.
However, the exact relationship between increased glomerular pressure that
may be derived from increases in systemic blood pressure, or the specific
increases in local intraglomerular pressure without similar changes in
systemic pressure and glomerular malfunction have yet to be determined.
than changes in glomerular permeability should be considered.
These studies have demonstrated that albumin excretion in healthy
controls is associated with comprehensive degradation (>95%) by lysosomes
in renal cells distal to the glomerular basement membrane (GBM)57.
Previously it was assumed that virtually all proteins filtered by the kidney
were excreted intact. In fact <5% of albumin is excreted intact and
detectable by conventional immunochemical assays. The remaining >95% is
degraded and undetectable by routine immunochemical assays.
The lysosomal processing of filtered albumin before its excretion has
been shown to be an extremely rapid and efficient process. It occurs within
minutes and involves lysosomal uptake and exocytosis of peptide products
back to the tubular lumen by renal cells distal to the GBM.57-62. There is
negligible contribution of albumin fragments arising from proteolytic
activity on the luminal surface of the tubular cells63, from extra renal
sources,57 or from contraluminal uptake of albumin with subsequent
Similar rapid lysosomal processing has been demonstrated in vivo
associated with the filtration and excretion of dextran sulfate in which the
dextran sulfate is completely desulfated but not depolymerized. The ratio of
intact to degraded forms of albumin and dextran sulfate has been shown
previously to increase in experimental diabetic nephropathy. The increased
ratio of intact to degraded albumin has also been shown in type 1 diabetic
patients with diabetic nephropathy.58
Furthermore, aminoguanidine (an antiglycation agent) and ramipril
(an ACE inhibitor) have been demonstrated to normalize the protein
fragmentation/desulfation process in rats with streptozotocin - induced
diabetic nephropathy.
These results may be linked to changes in transforming growth
factor-β (TGF-β) expression, which is upregulated in diabetes and other kidney
disease states and may be upregulated in hypertension as a result of
increased stretching forces brought about by the hypertensive state. Recent
studies have shown that lysosomal activity may be affected by increased
correlated with decreased TGF- β levels.
Microalbuminuria and high cardiovascular risk
An increased UAE has been associated with a number of
unfavorable metabolic and nonmetabolic risk factors, such as older
age, longer duration of hypertension, cigarette smoking, increased BP
load and variability (the so-called non-dipping phenomenon), higher
uric acid levels, worse lipid profile, insulin resistance, endothelial
dysfunction, increased activity of the RAS, and BP salt sensitivity21.
Furthermore, microalbuminuria is a concomitant of subclinical
organ damage in nondiabetic hypertensive patients6,22. Tuttle et al23
showed a correlation between increased UAE and severity of coronary
artery disease by coronary angiography. In another study Berton et
al24 showed that the presence of microalbuminuria strongly predicts
mortality in patients with acute myocardial infarction, even after
adjusting for several other confounding factors, such as age, the
UAE has also been related to peripheral atherosclerosis and increased
carotid intima-media thickness (IMT) in some but not in all
studies22,25.
In light of the well-known association between carotid
atherosclerosis and cerebrovascular damage (both asymptomatic
vascular lesions and acute events), it is not unexpected that
microalbuminuria has been shown to be a predictor of ischemic stroke,
even after correcting for the presence of several confounding factors26.
Several retrospective and prospective studies27-30 have
demonstrated that microalbuminuria predicts cardiovascular morbidity
and mortality in addition to being the earliest manifestation of
nephropathy. Thus finding of MAL in diabetic patient is an indication
for screening for possible cardiovascular disease and aggressive
intervention to reduce all cardiovascular risk factors31
The mechanisms that link MAL and death from cardiovascular
disease are poorly understood. Adverse changes in several
diabetic subjects including hypertension, raised triglycerides, LP (a),
fibrinogen, PAI-1. However, even most unfavorable combination of
these factors would seem unlikely to explain the excess cardiovascular
risk.
Moreover, studies by Haffner et al.32 have shown that
nondiabetic subjects with microalbuminuria have higher prevalence of
cardiovascular disease and increased mortality. All these suggest
microalbuminuria is an independent risk factor for the development of
cardiovascular disease.
MAL and Cardiovascular risk in general population
Yudkin et al in 1988 were first to report that even in nondiabetic
subjects, UAE significantly correlated with prevalence of
atherosclerotic heart disease33. Damsgard et al34 also reported
decreased survival rate in microalbuminuric non-diabetic when
In a large population study from New Zealand, the parameters
that correlated positively with UAE were BMI35, smoking, blood
pressure36, ethnicity37. However, the strongest risk factor for
developing MAL was in fact the existence of hyperglycemia.
A recent Finnish study in 1069 non-diabetic subjects also found
that high UAE values correlated with coronary mortality and
morbidity and coexistence of MAL and hyperinsulinemia was even
stronger cardiovascular risk factor38.
The evidence therefore suggests that even normotensive non
diabetic microalbuminuric subjects have more atherogenic profile and
tend to be more insulin resistant than normoalbuminuric subjects.
Measurement of UAE in general population can thus be helpful in
evaluation of cardiovascular risk39.
Microalbuminuria and renal damage
Hypertension has recently been reconsidered (reevaluated) as a
a strong independent risk of developing end-stage renal disease40.
While benign nephrosclerosis occurs less frequently than other
hypertensive complications (such as myocardial infarction and stroke),
the large number of patients with high BP, together with the high
social and financial costs of renal replacement therapy, make the
prevention of this complication a relevant public health problem.
In fact, hypertension together with diabetes is currently a
leading cause of end-stage renal disease in developed countries and
most of the developing countries esp. in India. In the quest for new
clinical tools that enable the identification of patients at highest renal
risk, microalbuminuria has emerged as a strong candidate.
It has been proposed that this subclinical condition may signal
the presence of functional and/or structural renal abnormalities that
precede and predict the onset of GFR deterioration. In a relatively
small retrospective study, microalbuminuria predicted subsequent loss
of renal function, despite similar baseline clinical characteristics and
Interestingly, increased renal vascular resistance, a parameter that has
previously been shown to correlate with the severity of renal
impairment in patients with chronic kidney disease, has been reported
in patients with long-standing primary hypertension and
microalbuminuria42,43. More recently, provocative data from a large
cross-sectional study indicate that high normal albuminuria
(somewhere between 15 to 30 mg/dL) is associated with
hyperfiltration and similarly to diabetes mellitus, it could anticipate a
decline in renal function44.
In conclusion, although large, well-conducted prospective
studies addressing this issue are yet to be carried out, the predictive
value of microalbuminuria for hypertension-induced renal damage is
at present a tempting but speculative hypothesis.
Tubular changes in microalbuminuria
Increased sodium, glucose reabsorbtion from proximal tubule
mediated enhanced of GFR.
Microalbuminuria and endothelial dysfunction
MAL has been reported as a marker of generalized endothelial
damage. This is the basis for ‘Stenohypothesis’45 which states that
transmembrane passage of albumin is facilitated when production of
heparan sulphate is reduced with consequent loss of negative charge.
Poor glycemic control inhibits the enzyme N-deacytylase responsible
for heparan sulphate production.
The endothelial dysfunction associated with MAL is not
confined to renal glomerulus, but also involving other organs. This is
evident from increased prevalence of MAL in hypertensives46 and
patients with diabetic retinopathy.
Patients with MAL have increased levels of VWF, activated
dysfunction when compared to normoalbuminuric47 group invoking
probable generalized endothelial dysfunction in these patients.
Smoking appears to be an important link between MAL and
endothelial damage or dysfunction in diabetics48. Increased VWF is an
index of endothelial injury has been demonstrated in smokers.
MAL and insulin resistance
Insulin resistance has been associated with increased sodium
reabsorbtion. This suggests that hyperinsulinemia may be one of the
causal factors for development of MAL.
In a study of 333 treated hypertensives UAE was found to
correlate with fasting insulin and sum of insulin at times 0, 30, 60, 90,
120 minutes during an oral glucose tolerance test49. In another study
of 25 hypertensives and 20 controls, undergoing OGTT,
microalbuminuric hypertensives had higher insulin area under curve
hyperinsulinemia is obscure. It is possible that either these phenomena
are genetically determined and cosegregate in the same patient or
hyperinsulinemia may cause both microalbuminuria and hypertension
probably by altering membrane permeability51.
Interventions to reduce MAL
1) Glycemic control
The first step to prevent further renal damage after onset of
MAL is control of hyperglycemia, which has been shown conclusively
to slow the progression.
2) Antihypertensive therapy52
Mogensen et al53 emphasized and demonstrated that reduction of
BP slows the progression of diabetic nephropathy. It appears that ACE
Several reports support an antiproteinuric effect of ACE inhibitors
beyond their effect on BP.
ACE inhibitors preferentially dilate the efferent arterioles
resulting in reduction of intraglomerular pressure, decrease in
macromolecular traffic through mesangium, increased bradykinin in
renal circulation, and potassium sparing effect, which is
vasoprotective at the level of endothelium54. It has growth inhibiting
properties over mesangial cells and extra cellular matrix also. Studies
have proven beyond doubt antiproteinuric effects of ACEI, which
should be started even in normotensive diabetic subjects to retard the
progression of diabetic nephropathy.
3) Low protein diet
This reduces degree of decline in GFR and proteinuria. The
mechanism involves decrease in glomerular hyperfiltration by relief
from two effects of nitrogenous waste products namely afferent
There are ongoing intensive studies to find out treatment
strategies to decrease albumin excretion. In one such study aldose
reductase inhibitors found to reduce GFR and AER in type 1 diabetes.
However, in type 2 diabetes these effects remain to be proven.
MAL: THE FUTURE
Changes in albumin excretion and MAL in hypertension is likely
to be more than an epiphenomenon. Data suggest what it is of value as
an index of vascular damage. With increasing information available on
its association with traditional cardiovascular risk factors, MAL may
be a simple, cheap, easy measure of endothelial damage and further
MATERIALS AND METHODS
250 patients, newly diagnosed or recently diagnosed (less
than one year, on treatment), essential hypertensives following
up at the hypertensive clinic, Government General Hospital,
Chennai were enrolled for the study between May 2004 and June
2005. Of them, 192 patients were excluded as per exclusion
criteria. Remaining 58 patients were selected for the study who
satisfied all the exclusion and the inclusion criteria. Written
consent was obtained from all patients participated in the study.
Exclusion criteria:
1. Patients older than 60 years
2. Hypertension duration > 1 year
3. Diabetes mellitus, chronic kidney disease
4. Chronic heart failure
5. Positive history (or) clinical evidence of IHD
6. Patients on diuretics, ACEIs, ARBs
Diagnosis of essential hypertension was made after complete
medical history, physical examination and routine biochemical
evaluation. Hypertension was defined according to the criteria in the
European society of Hypertension – European society of Cardiology
2003 guidelines for hypertension as an average blood pressure ≥
140/90 mmHg an at least two different occasions or by the presence of
antihypertensive treatment.
On the study day, after an overnight fast, height and
weight measured and venous blood was drawn in order to measure
hematological parameters. Blood pressure was measured with patient
in the sitting position after a 5 min rest, with mercury
sphygmomanometer (cuff size 12.5 x 40 cm). The SBP and DBP were
read to the nearest 2 mmHg. Disappearance of Korotkoff’s sounds
(phase V) was the criterion for DBP. Body mass index (BMI) was
calculated by the formula
Standard 12 lead ECG was obtained for each patient. Serum
creatinine, Blood urea, Serum electrolytes, Serum uric acid, Total
cholesterol, Triglycerides, High-density lipoprotein – cholesterol
(HDL-C) and other standard blood chemistry evaluations were
performed according to routine methods. Low density lipoprotein
(LDL) – cholesterol was calculated using Friedewald’ formula
LDL = TC – HDL-c – TGL/5 (IF TGL < 400 mg/dL)
Creatinine clearance was calculated using Cockcroft – Gault’s
formula and expressed in ml/min. These patients were subsequently
investigated at Department of Cardiology, Barnard Institute of
Radiology, Govt. General Hospital and biochemical investigations
were carried out at biochemical lab attached to Institute of
Biochemistry, Govt. General Hospital.
STUDY DESIGN
To evaluate the presence of microalbuminuria as an indicator of
target organ damage in patients with essential hypertension, a single
Measurement of urine albumin excretion was done by collecting
24-hour urine samples from our patients. The method was based on
the measurement of immunoprecipitation of albumin enhanced by
polyethylene glycol at 340 nm. The specific antiserum was added in
excess to buffered samples.
The increased in absorbance caused by immunoprecipitation was
recorded when the reaction reached its end point. Absorbance is
proportional to amount of antigen in solution. The patients were
divided into cases and controls by measurement of urine albumin
(30-300 case, <30 control) respectively.
Echocardiography
All echocardiographic studies were performed in our
Department of Cardiology using ALOKA machine. Echocardiograms
were obtained at rest with patient’s supine in the left lateral position,
monodimensional left ventricular measurements and the bidirectional
(apical four and two chamber views) obtained according to the
recommendations of the American society of Echocardiography55.
All electrocardiograms were done by a single observer blinded
to the clinical characteristics of the patients under observation. LV
mass index derived using the formula described by Devereux and
associates:
LV mass (grams) =
0.80 x 1.04 [(VSTd+LVIDd+PWTd)3-(LVIDd)3] + 0.6
where
VSTd – Ventricular septal thickness in diastole
LVIDd – LV internal dimension at end diastole
PWTd – LV posterior wall thickness at end diastole
LV mass corrected for height and expressed in units of
grams/m2.7
The presence of LV hypertrophy was defined for LVMI > 51 gm/m2.7
The intima-media thickness (IMT) of both carotid arteries was
evaluated by high resolution US scan as described by Weldelhag56.
Carotid arteries were investigated in the longitudinal and the
transverse projections by high-resolution real-time ultrasonography
using a 10 MHz in-line duplex system. The carotid artery was scanned
at the bifurcation and at the common carotid artery.
At each longitudinal projection the far-wall IMT, as defined by
Weldelhag et al.56, was measured at the distal end of CCA, 10 mm
caudally to the point where the near and far walls lose their parallel
configuration. Carotid plaque was defined as IMT > 1.3 mm. IMT was
always measured on the CCA outside the plaque, if was present. Each
STATISTICAL ANALYSIS
Statistical analysis was carried out for 58 subjects 32 persons in
the control group whose albumin excretion is within normal limits, 26
persons in the microalbuminuric group after categorizing each
variable. Patients age, sex, weight, BMI, Serum lipid profile were
matched.
Occurrence of target organ damage by IMT, LV mass index and
Fundal examination were tabulated and analyzed. Microsoft excel
2003 was used for analysis and Z tests were done to assess differences
between percentages and difference between means. Correlation was
evaluated by the software. Statistical significance was taken when
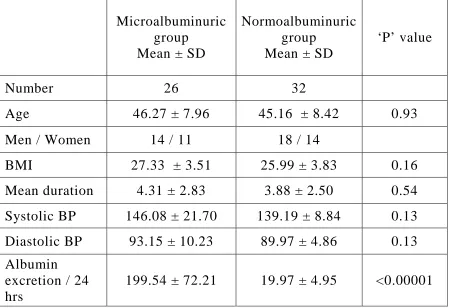
Table No. 1
Matching of cases and controls
Microalbuminuric group
Mean ± SD
Normoalbuminuric group
Mean ± SD
‘P’ value
Number 26 32
Age 46.27 ± 7.96 45.16 ± 8.42 0.93
Men / Women 14 / 11 18 / 14
BMI 27.33 ± 3.51 25.99 ± 3.83 0.16
Mean duration 4.31 ± 2.83 3.88 ± 2.50 0.54
Systolic BP 146.08 ± 21.70 139.19 ± 8.84 0.13
Diastolic BP 93.15 ± 10.23 89.97 ± 4.86 0.13
Albumin excretion / 24 hrs
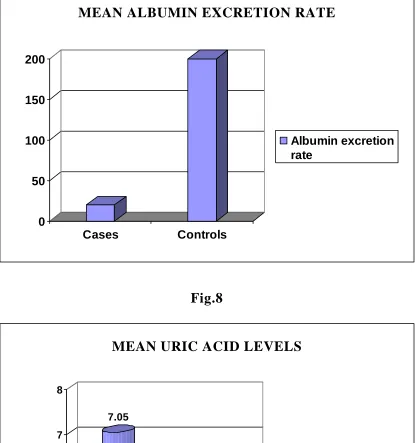
199.54 ± 72.21 19.97 ± 4.95 <0.00001
‘P’ values < 0.05 statistically significant. ‘P’ values are rounded to two decimals
Table No.2
Indicators of target organ damage
Indicator
Microalbuminuric Group
Mean ± SD
Normoalbuminuric group
Mean ± SD
‘P’ value
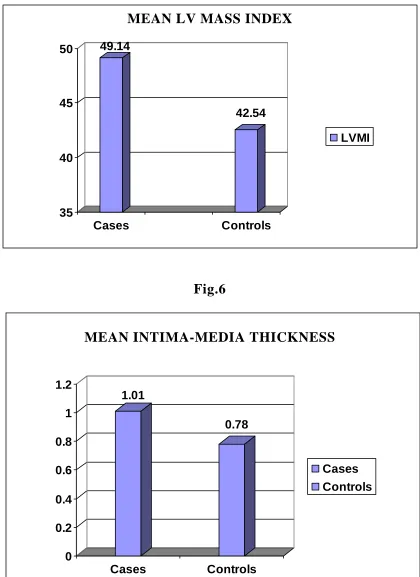
LVMI 49.10 ± 7.36 42.54 ± 4.12 <0.00001
IMT 1.01 ± 0.23 0.78 ± 0.07 <0.00001
Uric acid 7.05 ± 1.33 6.1 ± 1.2 0.0052
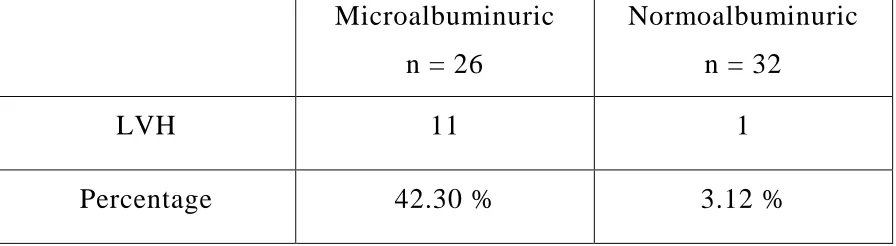
Table No.3
Percentages of Left ventricular hypertrophy
Microalbuminuric
n = 26
Normoalbuminuric
n = 32
LVH 11 1
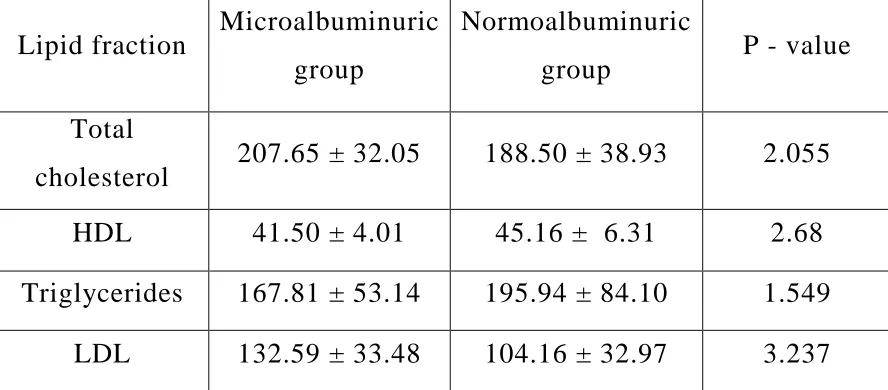
[image:52.612.86.534.540.663.2]Table No. 4
Lipid profile in cases and controls
Lipid fraction Microalbuminuric
group
Normoalbuminuric
group P - value
Total
cholesterol 207.65 ± 32.05 188.50 ± 38.93 2.055
HDL 41.50 ± 4.01 45.16 ± 6.31 2.68
Triglycerides 167.81 ± 53.14 195.94 ± 84.10 1.549
LDL 132.59 ± 33.48 104.16 ± 32.97 3.237
Table No. 5
Levels of correlation with Microalbuminuria with TOD
Factor Correlation coefficient
LVMI 0.81
Fundus 0.29
IMT 0.37
[image:53.612.84.528.188.383.2] [image:53.612.117.496.537.671.2]Data from 58 patients participated in this study is finally
entertained for analysis of which 26 patients are cases (24 hr albumin
excretion 30 – 300 mg) and 32 are designated as controls (24 hr
albumin excretion <30 mg). The cases and controls are matched for
age, sex, mean hypertension duration, systolic and diastolic blood
pressures and body mass index as shown in Table 1.
The cases and controls are age matched with a mean age of
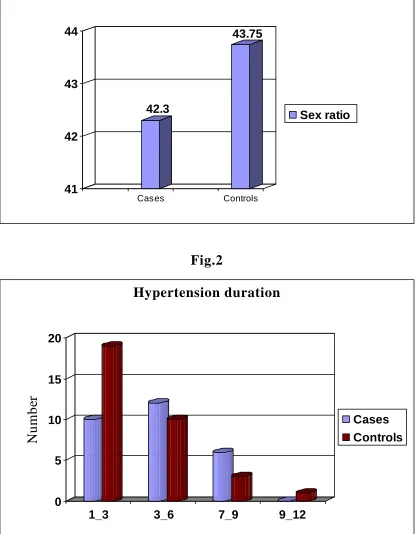
46.27 and 45.16 respectively. The male to female ratio in both cases
and controls is 42.3 and 43.75 respectively. The body mass index
(BMI) in cases and controls is 27.33 and 25.99 respectively. No
statistical difference is found in age, mean hypertension duration and
BMI between microalbuminuric and normoalbuminuric groups as
evidenced by ‘P’ values 0.93, 0.54 and 0.16respectively (all P > 0.05).
But this study found statistically significant difference in
albumin excretion and LV mass index, Intima-media thickness, fundal
changes with ‘P’ values <0.00001, <0.00001 and 0.0052 respectively
hypertension induced target organ damage and matching the rest
between cases and controls, there existed statistically significant
difference between these groups making evident that difference in
prevalence of target organ damage in systemic hypertension is
contributed by difference in albumin excretion hence this study
concludes that MAL is an indicator of target organ damage in
systemic hypertension.
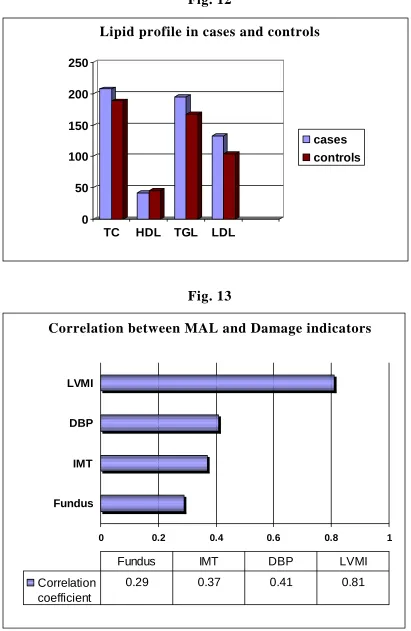
Further data from patients in both these group showed that there
is close correlation between microalbuminuria and lipid abnormalities
such as elevated total cholesterol (‘P’ < 0.05), elevated LDL
(‘P’=0.0013) and reduced HDL (‘P’=0.0164). There is also close
correlation between waist circumference and microalbuminuria
indicating that central obesity is an important risk factor for target
organ damage in systemic hypertension which is more common in
Indian population which when added to the increased incidence of
insulin resistance runs very high risk for adverse cardiovascular and
Not only there is increased incidence of left ventricular
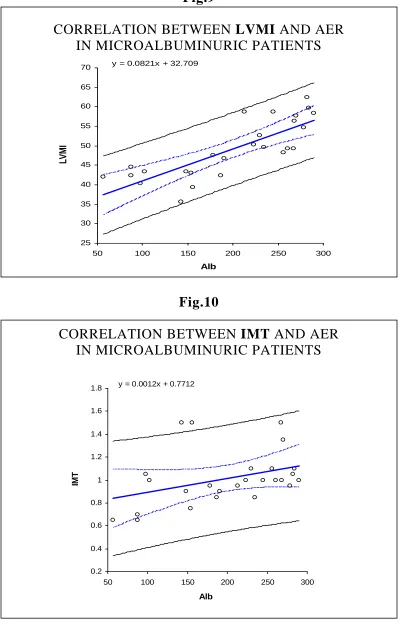
hypertrophy in microalbuminuric group (Table No.3), but also there is
strong linear correlation between LVMI and albumin excretion rate
(correlation coefficient: 0.81 indicating very high correlation). Even
though there is linear correlation between AER with fundal changes
and IMT (correlation coefficients: 0.29 and 0.37 respectively), the
relation is not as strong as with Left ventricular mass index (LVMI).
The relationship of age to the amount of microalbuminuria is not
well made out in our study. In past many researchers have shown that
there is strong relationship between the amount of albumin excreted
with increasing age both in diabetic and non-diabetic population. Our
study did not elicit a good correlation.
Increasing levels of albumin correlate with increasing levels of
serum total cholesterol and decreasing levels of HDL, but the
association was not statistically significant. In contrast to the earlier
publications, that strongly came out with results of good correlation
between atherogenic lipid profile and occurrence of target organ
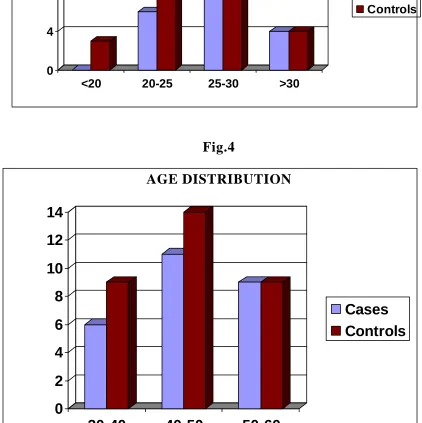
Fig.1
SEX RATIO (Male / Female)
42.3
43.75
41 42 43 44
Cases Controls
Sex ratio
Fig.2
Hypertension duration
0 5 10 15 20
N
u
m
b
er
1_3 3_6 7_9 9_12
[image:57.612.100.515.110.390.2] [image:57.612.99.514.160.694.2]Fig.3
BMI
0 4 8 12 16
<20 20-25 25-30 >30
Cases Controls
Fig.4
AGE DISTRIBUTION
0 2 4 6 8 10 12 14
30-40 40-50 50-60
[image:58.612.99.513.76.357.2] [image:58.612.87.509.244.667.2]MEAN LV MASS INDEX
49.14
42.54
35 40 45 50
Cases Controls
LVMI
Fig.6
MEAN INTIMA-MEDIA THICKNESS
1.01
0.78
0 0.2 0.4 0.6 0.8 1 1.2
Cases Controls
[image:59.612.96.516.94.671.2] [image:59.612.99.514.95.348.2]Fig.7
MEAN ALBUMIN EXCRETION RATE
0 50 100 150 200
Cases Controls
Albumin excretion rate
Fig.8
MEAN URIC ACID LEVELS
7.05
6.1
5 6 7 8
Cases Controls
[image:60.612.99.514.116.559.2] [image:60.612.98.514.282.682.2]CORRELATION BETWEEN LVMI AND AER IN MICROALBUMINURIC PATIENTS
y = 0.0821x + 32.709
25 30 35 40 45 50 55 60 65 70
50 100 150 200 250 300
Alb
LV
M
[image:61.612.107.507.83.708.2]I
Fig.10
CORRELATION BETWEEN IMT AND AER IN MICROALBUMINURIC PATIENTS
y = 0.0012x + 0.7712
0.2 0.4 0.6 0.8 1 1.2 1.4 1.6 1.8
50 100 150 200 250 300
Alb
IM
[image:61.612.109.505.407.701.2]Fig.11
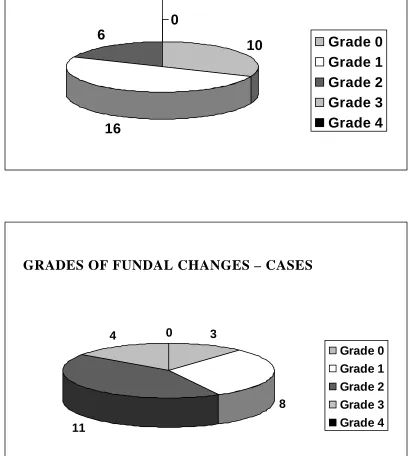
GRADES OF FUNDAL CHANGES - CONTROLS
10
16 6
0
0
Grade 0 Grade 1 Grade 2 Grade 3 Grade 4
GRADES OF FUNDAL CHANGES – CASES
3
8
11
4 0
Lipid profile in cases and controls
0 50 100 150 200 250
TC HDL TGL LDL
[image:63.612.96.507.81.712.2]cases controls
Fig. 13
Correlation between MAL and Damage indicators
0 0.2 0.4 0.6 0.8 1
Fundus IMT DBP LVMI
Correlation coefficient
0.29 0.37 0.41 0.81
[image:63.612.98.506.92.346.2]DISCUSSION
In this study on Indian population involving 58 patients we
evaluated the occurrence of microalbuminuria as an indicator of
subclinical target organ damage in systemic hypertension. This study
shows target organ damage is more common in patients with
microalbuminuria as well as without microalbuminuria.
Many studies have shown that microalbuminuria is a strong
independent risk factor for CAD. This is evident from our study which
also showed increased prevalence of target organ damage in
microalbuminuric population even after matching of other coronary
risk factors (BMI, age, duration of hypertension) and exclusion of
some risk factors (smoking, DM) in both groups.
This study has attempted to show microalbuminuria as an
indicator of subclinical target organ damage in patients with systemic
hypertension without diabetes mellitus. Measurement of MAL in
prevalence of target organ damage in systemic hypertension.
This study also showed the linear correlation between the
amount of albumin excretion and the severity of subclinical organ
damage. It is also true in cases of microalbuminuria in diabetic
individuals in whom the conversion from microalbuminuria to clinical
albuminuria is an indicator of progression of diabetic nephropathy. In
the correlation of AER with subclinical organ damage in various
compartments, best correlation was with LVMI compared IMT or
Fundal changes.
Our study has several limitations. First of all patients enrolled
for the study are from hypertension clinic, the main reason for referral
being poor control of hypertension which we haven’t taken into
account potentially limiting the generalisability of the findings.
Secondly, though we measured traditional risk factors we failed
to address about novel risk factors like small dense LDL, LP (a), and
fibrinolysis like PAI-1, which might have contributed to the
difference. We have not measured albumin creatinine ratio or urine
volume while calculating 24-hour albumin excretion rate, which might
be confounding factors.
Thirdly, we only measured total protein excretion in urine for 24
hours semi-quantitatively, which may be an additional factor in the
CONCLUSION
The following are conclusions from the study
1) Subclinical target organ damage is common in systemic
hypertension, the probability of which is significantly increased
in patients with microalbuminuria.
2) In patients with microalbuminuria, the severity of target organ
damage is directly related to the amount of albumin excretion in
urine
3) Microalbuminuria is an independent risk factor for target organ
SCOPE OF FUTURE STUDIES
This study conducted in Indian population has significant
observations and potential therapeutic implications. Still few
questions remain unanswered. Although microalbuminuria has been
convincingly proved an independent cardiovascular risk factor, the
exact pathophysiological mechanism of increased cardiovascular risk
has to be elucidated by further studies.
The urinary excretion of transferrin protein is elevated in
systemic hypertension. The relation of urinary transferrin excretion to
the occurrence of target organ damage has to be confirmed by further
Proforma
Name: Age:
Sex: If female Menopause attained Y/N HTN OP No:
DM Y/N CKD Y/N
CAD / MI/ DCM Y/N Diuretic use Y/N
Duration of HT Drugs used
Avg. BP in past 3 months CVA Y/N
Angina / MI Y/N
Visual disturbance Y/N Oliguria Y/N
Nocturia Y/N Pedal edema Y/N Abdominal pain Y/N Burning micturition Y/N Co-morbid conditions:
Smoker: Type/ quantity/ duration Alcohol: Type/ quantity/ duration
Family H/o DM/ SHT/ CVA/ CAD/ Renal disease
Examination
Height Weight Waist Hip
Fundus
Arteriolar narrowing Y/N AV changes Y/N
Hemorrhages / cotton wool spots Y/N Papilledema Y/N
CVS
Abdomen: Bruit Y/N Aneurysm Y/N
Neurological exam Focal neurological deficit Y/N
INVESTIGATIONS
Blood glucose (Fasting): Urea: S. Creatinine: Lipid profile:
Urine protein: Sugar: Deposits: ECG (RE score)-
Largest R/S wave in limb lead > 20 mm 3 S wave in V1/V2 or R wave in V5/V6 > 30mm 3
Strain pattern 3
Left atrial enlargement 3
Left axis deviation 2
QRS duration > 0.09 sec 1 Intrinsicoid deflection > 0.05 sec 1 Echocardiogram
Septal thickness
LV posterior wall thickness LV internal diameter (diastole) Fractional shortening
Ejection fraction
Carotid intima-media thickness: R L
Urine albumin
S.
No NAME AGE SEX DURn SBP DBP FUNDUS TC TGL HDL LDL LVMI Alb IMT Uric
acid Wt Ht BMI WAIST HIP RATIO 1 Amutha 45 F 4 112 80 0 190 110 40 128 44.49 87 0.70 7.6 70 163 26.35 115 119 0.97 2 Anbu 43 M 8 148 96 2 207 158 38 137 57.67 270 1.35 8.2 67 162 25.53 123 108 1.14 3 Anjaneyalu 36 M 4 134 94 0 185 112 45 118 39.33 156 1.50 5.2 65 158 26.04 98 90 1.09 4 Balaji 50 M 9 130 90 3 207 158 48 127 52.67 230 1.10 8.2 67 162 25.53 89 92 0.97 5 Devaki 54 F 9 148 88 2 197 175 41 121 56.33 268 1.00 7.2 87 156 35.75 85 100 0.85 6 Duraisamy 43 M 6 120 80 1 232 300 37 135 47.67 178 0.95 6.8 78 171 26.67 99 96 1.03 7 Egambaram 48 M 5 148 90 2 185 112 45 118 49.33 267 1.50 7.2 65 158 26.04 102 92 1.11 8 Elizabeth 54 F 5 152 88 1 181 300 37 84 43.33 148 0.90 5.4 68 171 23.26 103 100 1.03 9 Kannammal 47 F 4 130 92 1 169 165 47 89 42.00 57 0.65 6.9 78 158 31.24 106 119 0.89 10 Kasthuri 55 F 1 178 98 0 220 146 41 150 42.33 187 0.85 4.7 64 164 23.80 98 92 1.07 11 Kothandam 31 M 0 134 94 1 185 112 42 121 35.67 143 1.50 7.2 65 158 26.04 99 90 1.10 12 Lakshmanamurthy 37 M 1 158 118 3 287 167 42 212 40.33 98 1.05 8.5 72 165 26.45 123 94 1.31 13 Mariammal 52 F 8 146 90 1 190 145 37 124 48.33 256 1.10 7.8 60 163 22.58 99 93 1.06 14 Mary 59 F 5 120 84 1 226 123 38 163 49.33 261 1.00 8.2 60 145 28.54 98 96 1.02 15 Mumtaj 52 F 7 144 88 2 256 189 43 175 49.67 234 0.85 8.9 66 150 29.33 105 100 1.05 16 Muniammal 52 F 1 114 90 2 220 146 42 149 58.67 213 0.95 4.7 74 164 27.51 94 87 1.08 17 Natarajan 48 M 4 186 110 2 181 300 37 84 46.67 190 0.90 5.4 72 171 24.62 103 96 1.07 18 Perumal 43 M 5 148 86 3 234 167 42 159 62.33 282 1.05 7.2 88 172 29.75 107 103 1.04 19 Rajkumar 34 M 1 190 120 2 216 176 47 134 43.33 102 1.00 8.2 60 145 28.54 97 94 1.03 20 Saradha 58 F 4 134 90 1 286 172 35 217 58.67 245 1.00 7.2 89 157 36.11 104 106 0.98 21 Sarojiniammal 51 F 6 126 92 1 170 147 46 95 59.67 284 1.10 8.8 66 150 29.33 112 103 1.09 22 Sivasubramaniam 45 M 7 152 94 2 190 156 43 116 54.67 278 0.95 5.9 60 163 22.58 107 98 1.09 23 Sundarambal 48 M 1 162 80 2 189 156 42 116 50.33 223 1.00 8.2 60 145 28.54 97 96 1.01 24 Syed allaudin 50 M 6 178 90 3 207 158 48 127 58.33 290 1.00 8.2 67 162 25.53 96 92 1.04 25 Varadhan 31 M 0 134 94 2 220 148 42 148 43.00 154 0.75 4.7 64 164 23.80 96 90 1.07 26 Venkatesan 37 M 1 172 106 2 169 165 34 102 42.34 87 0.65 6.8 78 158 31.24 95 94 1.01
S.
No NAME AGE SEX DURn SBP DBP FUNDUS TC TGL HDL LDL LVMI Alb IMT Uric
acid Wt Ht BMI WAIST HIP RATIO 1 Anandhi 55 F 3 150 90 0 214 348 42 102 43.33 19 0.70 3.9 75 153 32.04 89 95 0.94 2 Aravindh 38 M 4 150 90 0 155 84 53 85 45.58 26 0.80 6.8 51 173 17.04 73 90 0.81 3 Inbaraj 43 M 7 148 86 0 228 322 38 126 43.15 23 0.80 5.0 73 158 29.24 97 108 0.90 4 Jana 42 M 5 120 90 1 228 322 48 116 47.15 27 0.65 6.0 74 160 28.91 86 98 0.88 5 Jeyadevan 33 M 0 140 95 1 203 220 38 121 41.00 17 0.75 5.8 64 172 21.63 92 97 0.95 6 Kosumbu 60 F 7 144 80 1 160 186 45 78 42.78 10 0.75 7.5 67 156 27.53 99 123 0.80 7 Kumar 37 M 2 148 92 1 160 186 45 78 42.33 12 0.80 7.5 62 156 25.48 100 105 0.95 8 Latha 43 F 6 130 90 1 228 190 47 143 43.15 22 0.85 7.0 62 160 24.22 98 104 0.94 9 Malarvizhi 60 F 1 144 80 1 169 147 42 98 43.33 16 0.75 5.3 60 155 24.97 95 97 0.98 10 Malliga 58 F 5 148 90 1 156 175 42 79 51.02 13 0.90 4.5 82 168 29.05 104 106 0.98 11 Marimuthu 35 M 2 148 92 1 140 110 56 62 45.00 16 0.80 6.0 65 164 24.17 87 93 0.94 12 Mary jasmine 45 F 1 138 90 0 177 168 46 97 47.33 22 0.70 6.9 57 150 25.33 98 107 0.92 13 Mohammal 54 F 3 150 90 0 140 110 56 62 46.67 17 0.65 5.1 65 156 26.71 100 95 1.05 14 Muthu 42 M 6 140 90 1 203 220 38 121 37.33 29 0.75 8.9 59 156 24.24 103 97 1.06 15 Natarajan 35 M 7 136 90 0 217 246 38 130 41.95 24 0.85 7.1 74 175 24.16 73 90 0.81 16 Pachiammal 55 F 3 120 82 0 179 100 46 113 42.33 14 0.75 6.5 58 148 26.48 93 95 0.98 17 Padmavathy 45 F 4 130 94 0 169 165 54 82 42.67 24 0.65 7.0 78 158 31.24 93 119 0.78 18 Palaniyandi 46 M 9 140 90 2 167 268 39 74 43.67 15 0.80 5.3 60 155 24.97 98 95 1.03 19 Penicilliah 44 M 3 136 102 2 321 294 48 214 39.30 27 0.90 5.3 60 155 24.97 103 98 1.05 20 Rajesh
khanna 31 M 2 138 90 0 155 84 53 85 40.67 24 0.80 6.8 64 173 21.38 73 90 0.81 21 Ranganathan 41 M 10 140 90 2 217 246 38 130 39.33 17 0.70 7.1 74 175 24.16 96 103 0.93 22 Ravindran 39 M 5 140 95 1 147 180 47 64 41.02 15 0.85 4.6 82 168 29.05 92 97 0.95 23 Safira 44 F 3 127 92 2 140 110 56 62 41.57 25 0.90 5.6 65 170 22.49 95 98 0.97 24 Santha 60 F 1 144 80 1 214 348 34 110 42.21 18 0.85 3.9 65 153 27.77 97 107 0.91 25 Sasikumar 36 M 2 148 92 1 160 186 45 78 32.78 18 0.70 7.5 63 156 25.89 98 104 0.94 26 Sathaya 41 M 3 125 98 2 179 100 46 113 35.71 24 0.75 6.5 54 148 24.65 103 98 1.05 27 Shankar 38 M 4 140 95 1 214 348 44 100 33.00 21 0.85 3.9 75 153 32.04 92 97 0.95 28 Sundarambal 56 F 6 146 84 1 217 246 38 130 43.67 16 0.85 7.0 74 165 27.18 104 106 0.98 29 Sundari 52 F 6 148 90 1 155 84 53 85 47.67 19 0.75 6.8 62 173 20.72 94 106 0.89 30 Surya 47 F 1 130 90 0 179 100 46 113 49.67 22 0.75 6.5 58 148 26.48 98 105 0.93 31 Syed Ismail 48 M 1 140 90 2 203 220 48 111 44.00 20 0.80 6.0 58 165 21.30 113 105 1.08 32 Vedagiri 42 M 2 128 90 1 238 157 36 171 41.02 27 0.90 5.9 102 168 36.14 123 100 1.23
1. The seventh report of the Joint National Committee on Prevention, Detection,
and treatment of High Blood Pressure: The JNC 7 report. JAMA 289:2560,
2003
2. 2003 European Society of Hypertension – European society of cardiology
guidelines for the management of arterial hypertension. J Hypertens 21:1011,
2003
3. Rogers WJ, Androus TC, Bertocet BD – Asymptomatic cardiac ischemia pilot
study (ACIP). Outcome at 1 year for patients with asymptomatic ischemia.
4. Viberti GC, Hill RD, Jarnet R, 1982, Lancet 1430: 32 Microalbuminuria as a
precursor of clinical nephropathy in diabetes
5. Pontremoli R, Sofia A, Ravera M, Nicolella C, Viazzi F, Tirotta A, Ruello N,
Tomolillo C, Castello C, Grillo G, Sacchi G, Deferrai G: Prevalence and
clinical correlates in microalbuminuria in essential hypertension: The MAGIC
study. Microalbuminuria: A Genoa Investigation on Complication.
Hypertension 30: 1135-1143, 1997
6. Prevalence and clinical correlates of microalbuminuria in stage I hypertension.
Results from the Hypertension and Ambulatory Recording Venetia Study
7. Hoegholm A, Bang LE, Krostensen S, Nielsen JH: Microalbuminuria in 411
untreated individuals with established hypertension and normotension.
Hypertension 24: 101-105, 1994
8. Microalbuminuria in the US population: Third Health and Nutrition
Examination Survey. Am J Kidney Dis 39: 445-459, 2002
9. Torres Rosa T, Palatini P: Clinical value of microalbuminuria in hypertension.
J Hypertens 18: 645-654, 2000
10. Diabetic nephropathy – American Diabetes Association clinical
recommendations: Diabetes care Jan 2001 (Supp) 569-573.
11. Variability of urinary albumin excretion in incipient DN – Feldt Rasmussen B,
Matheson ER. Diabetic nephropathol 1984: 3: 101-103
12. McCormick CP – Enhanced immunoassay for albumin Inv. Clinic Lab Sci
1989: 19: 944-951.
13. Harmononein A, Jokesa H, Turbidometric measurement of microalbuminuria.
Clin Chim Acta 1987, 166: 85-89.
14. Cambiosa CL, Collet – Cassart D, Immunoassay of low concentration of