Open Access
Research article
Bridging the care continuum: patient information needs for
specialist referrals
Carol L Ireson*
1, Svetla Slavova
†2, Carol L Steltenkamp
†3and F
Douglas Scutchfield
†4Address: 1College of Public Health, University of Kentucky, Lexington, Kentucky, USA, 2Office of Institutional Research, University of Kentucky, Lexington, Kentucky, USA, 3College of Medicine, University of Kentucky, Lexington, Kentucky, USA and 4College of Public Health, University of Kentucky, Lexington, Kentucky, USA
Email: Carol L Ireson* - clires0@uky.edu; Svetla Slavova - ssslav2@email.uky.edu; Carol L Steltenkamp - cstel0@email.uky.edu; F Douglas Scutchfield - scutch@uky.edu
* Corresponding author †Equal contributors
Abstract
Background: Information transfer is critical in the primary care to specialist referral process and has been examined extensively in the US and other countries, yet there has been little attention to the patient's perspective of the information transfer process. This cross-sectional study examined the quality of the information received by patients with a chronic condition from the referring and specialist physician in the specialist referral process and the relationship of the quality of information received to trust in the physicians.
Methods: Structured telephone interviews were conducted with a random sample of 250 patients who had experienced a referral to a specialist for the first visit for a chronic condition within the prior six months. The sample was selected from the patients who visited specialist physicians at any of the 500 hospitals from the National Research Corporation client base.
Results: Most patients (85%) received a good explanation about the reason for the specialist visit from the referring physician yet 26% felt unprepared about what to expect. Trust in the referring physician was highly associated with the preparatory information patients received. Specialists gave good explanations about diagnosis and treatment, but 26% of patients got no information about follow-up. Trust in the specialist correlated highly with good explanations of diagnosis, treatment, and self-management.
Conclusion: Preparatory information from referring physicians influences the quality of the referral process, the subsequent coordination of care, and trust in the physician. Changes in the health care system can improve the information transfer process and improve coordination of care for patients.
Background
The experience of being referred to a specialist provider is a significant issue for patients in the United States health
care system. In this age of increasing specialized knowl-edge about chronic diseases, patients receive care from multiple physicians across a variety of settings. According
Published: 15 September 2009
BMC Health Services Research 2009, 9:163 doi:10.1186/1472-6963-9-163
Received: 17 March 2009 Accepted: 15 September 2009
This article is available from: http://www.biomedcentral.com/1472-6963/9/163 © 2009 Ireson et al; licensee BioMed Central Ltd.
to the 2006 National Ambulatory Medical Care Survey, patients made nearly 902 million visits to physician and over 46% (421 million) of those visits were to a specialist provider. Of the specialist provider visits, 137 million (33%) resulted from a referral from another provider [1]. A specialist referral requires coordination and integration of care, and transition and continuity of care- two of the seven dimensions of patient-centered care [2].
Emanuel and others developed a prototype of the rela-tionship that should underpin the tripartite relarela-tionship in a consultation experience, involving the patient, the primary care physician (PCP) and the specialist physician (SP) [3,4]. Williams et al suggested that the referral proc-ess involved three steps requiring coordination: (1) the referring physician communicates the reason for the refer-ral and pertinent patient information to the specialist, (2) the specialist completes the referral and communicates findings to the referring physician, and (3) the referring physician, specialist and patient negotiate continuing care arrangements [5]. Coordination of care has been narrowly defined as the information exchange among care provid-ers to ensure that care is directed to a common goal [6]. Most of the research about specialty referrals to date has focused on information exchange between health care providers. These studies show that primary care to special-ists referrals lack sufficient information exchange [7-9]. Coordination of care also takes places between providers and patients and families [10]. Information exchange between providers and patients also has been found to be lacking. In one study, patients reported receiving conflict-ing advice from different physicians that accordconflict-ing to the investigators was likely because of communication break-down between providers [11]. A survey in 48 Massachu-setts hospitals revealed patient dissatisfaction with continuity and transitions, information and education, and coordination of care [12]. A recent study found that nearly one third of physicians did not notify patients of abnormal diagnostic test results [13].
Studies of specialist referrals reveal that providers failed to discuss a referral with 27% of patients who indicated a definite desire for a referral and 56% of patients commu-nicating a possible desire [14]. In a subsequent interven-tion study, a pre-visit quesinterven-tionnaire increased provider awareness and improved patient satisfaction with the visit [15]. The referring physician plays a critical role in facili-tating the patient's completion of a referring by assisting in the scheduling of the referral [16].
Referring physicians are critical to the provision of prepar-atory information for the specialist visit. Likewise, the information that the specialist subsequently gives the patient about diagnosis, treatment, and follow-up is not
only important immediately to the patient, but also for the coordination of the patient's care with the primary care provider. Getting understandable information increases patient satisfaction, trust in the physician, and ultimately patient adherence [17-20].
While there has been substantial inquiry into the patients information needs in the referral process and methods to address those in other countries, less has occurred in the US [21,22]. Patients are a rich source of information about the health care system and can provide critical data for improving quality [23].
The purpose of this study was to describe the patient's information experience as they managed the transition from their referring physician for the first visit to a special-ist physician for a particular condition. The research was part of a larger study of information needs of patients and providers for a quality referral. From prior qualitative work, we hypothesized that there would be a relationship between the quality of the preparatory information that patients received about a first visit to a specialist and their trust in both the referring and specialist physicians. In this study we examined the information that patients received at each point in the referral process, their trust in the refer-ring and specialist physicians, and the role of information in that trust.
Methods
We used a cross-sectional design to examine the specialist referral experience of individuals diagnosed with a chronic medical condition that resulted in a referral to a specialist. We examined the information that patients received at each point in the referral process, their trust in the referring and specialist physicians, and the impact of the information they received on their trust in the refer-ring and specialist physicians. The study received approval from the University of Kentucky Institutional Review Board for protection of participants.
Sample
their regular family doctor refers them to another doctor for a specific illness or condition. The interview included additional screening to ensure that the individual had a condition that resulted in a referral to a specialist. They were included if they reported they were (1) being treated by a doctor for an ongoing illness or condition, (2) had been seen within the last six months, and (3) were referred by their regular doctor or another doctor. Chil-dren and those adults who referred themselves to a spe-cialist were excluded. After accounting for eligibility, the survey process resulted in 250 complete interviews, 7 par-tial interviews, and 1,275 refusals.
Survey
The survey used in the research was grounded in the expe-riences of patients referred by a primary care physician to a specialist. To learn patients' perspective of the referral experience, we first performed a qualitative study of patients with one of five chronic diseases, (congestive heart failure, diabetes, COPD, colon cancer, and breast cancer) that required referral to a specialist provider. Four doctoral-prepared nurses conducted semi-structured interviews with a convenience sample of 50 patients about their experience of being referred for a specialist consultation. The items for the interviews were developed by the principal investigator from review of the literature on patient's evaluation of their health care experience and in collaboration with experts in health care quality. The survey was refined during the interviews by the nurse interviewers and the principal investigator. Respondents were asked to relate the information they were given by their referring physician before their first visit to the spe-cialist, the information they received from the specialist at the visit, their understanding of the information, and what else they would have wanted. Patients expressed a need for preparatory information about their diagnosis, the reason for visit, logistics of getting to specialist, and what to expect at the visit. They also wanted written infor-mation and inforinfor-mation that was non technical.
The major themes from the interviews were validated in a focus group of patients who had participated in the qual-itative study. The themes that emerged were then used to generate items measuring the quality of the information exchange in the referral process. The initial version of the instrument contained 37 items; 16 structured items and two open ended questions concerning information received from the referring physician and 17 structured items and two open ended items about the information that the specialist gave the patient. The questions about information from the primary care provider and the spe-cialist also contained items about the patient's perception of the communication between the referring physician and the specialist. The structured items used a 5 point Lik-ert-type scale (5 = Excellent and 1 = Poor). Feedback from
the patient focus groups and the expert evaluations pro-vided support that the domains of the specialist and refer-ring physician's communication quality were well sampled. The item content validity as well as the whole set of items fit the concept and the construct being measured. For the initial psychometric evaluation, we administered the 37-item survey instrument to a random sample of 231 patients referred to a specialist at an academic health center during a six month period. The response categories were designed to capture the respondent's ratings of qual-ity of the information they received, i.e., excellent, good, fair, poor. The patients often did not receive any informa-tion, resulting in many missing values in the data set. The lack of information was as informative as the rated quality of the existing information, thus we added a response cat-egory to capture that. Following statistical analysis and use of psychometric criteria for item analysis and reduc-tion [24], the final scale contained a refined set of 21 items, scored on a qualitative scale (5 = Excellent, 4 = Very Good, 3 = Good, 2 = Fair, 1 = Poor, 0 = None/No Infor-mation provided).
To assure generalizability to a broader population, the survey instrument was tested with a sample of 250 patients referred to a specialist by a doctor, supplied by the National Research Center http://www.nationalre search.com. The sample size (n = 250) and number of items (21 items) were adequate to obtain satisfactory level of reliability (at least 10 subjects per item) [25].
Statistical Analyses
coordinate care for the particular condition while control-ling for age, race group, income, education, and gender. Similar analysis was conducted on the self-reported trust in the specialist. A logistic regression model was fit to assess the association between the trust in the specialist and the quality of the information transfer (PCPI, PCISP, PCISM), while controlling for age, gender, race, income, and education level. The dependent variable "Trust in the specialist" was created by dichotomizing the responses to the question Please, rate how well you trust the specialist you saw. The response categories Excellent/Very Good/Good were recoded as "Trusted him/her"; the remaining response categories were recoded as "Didn't really trust him/her".
Psychometric evaluation
The psychometric properties of the instrument were assessed by evaluating construct validity, reliability or internal consistency, temporal stability and predictive validity. The data were subjected to Exploratory Factor Analysis using a Principal Axis Factoring method to extract the initial factors (dimensions) of the measured construct. Using the Kaiser-Guttman rule for eigenvalues greater than 1.0, the initial factor analysis resulted in three factors with eigenvalues of 8.7, 2.7 and 1.5 that together explained 54.9% of the total variance. In order to provide a meaningful interpretation we performed factor rotation. The dimensions of the scale were expected to be correlated and the Oblique rotation was conceptually the most appropriate.
The internal consistency of the items comprising each fac-tor was measured by Cronbach's coefficient alpha. Test-retest reliability was measured before some of the final changes in the wording of the items. Therefore the test-retest reliability was measured for a version of the instru-ment that underwent slight final changes. However, the non-refined version of the instrument gave very good results for temporary stability. Fifty one patients were interviewed twice within a two month period.
Predictive validity is measured by the size of the correla-tion score between the scale predictor and a criterion var-iable [25]. Whether the patients would continue seeing the same specialist and the same referring physician for medical care was hypothesized as an important criterion for the patient's satisfaction with the patient centered information from the two physicians.
Results
Sample Demographics
The mean age of the sample was 53 years, 68% were women, 79% were white, and 68% were married. Over half (55%) had some college education and over
two-thirds had a total family income before taxes under $40,000. Nearly all participants had some form of insur-ance and only 6% were uninsured. More than half of the patients rated their general health as at least good (Table 1). The most common conditions were heart disease 8%, back pain 8%, cancer 5%, and lung disease 3%. One half of the patients cited numerous different conditions and 21% did not provide the condition.
Factor analysis
[image:4.612.313.553.289.713.2]Analysis of the data revealed that each item was signifi-cantly correlated (r ≥ .30) with at least three of the other items, indicating shared common variance. The strength of the relationships ranged from weak (r < 0.29) to strong (0.70 < r < 0.80). All correlations were positive, indicating
Table 1: Demographic characteristics of the sample (N = 250)
Characteristics
Gender
Female 68%
Male 32%
Education
Never attended school 3%
Grade 1 through 8 4%
Grade 9 through 11 5%
Grade 12 or GED 33%
College 1 to 3 years 38%
College 4 years or more 17% Ethnicity
Black/AA 8%
White 79%
Hispanic 4%
Native American 4%
Asian/Pacific Islander 2%
Multiracial 1%
Other 2%
Health Insurance
Your employer 23%
Someone else's employer 19% A plan that you or someone else buys on your or their own 5%
Medicare 25%
Medicaid or Medicaid assistance 13% The military, Champus, Tricare or the VA 5%
Some other source 4%
No insurance coverage 6%
Total family income before taxes
Less than $10,000 12%
Between $10,000 up to $20,000 14% Between $20,000 up to $30,000 20% Between $30,000 up to $40,000 16% Between $40,000 up to $50,000 6% Between $50,000 up to $60,000 5% Between $60,000 up to $70,000 5% Between $70,000 up to $80,000 1% Between $80,000 up to $90,000 1% Between $90,000 up to $100,000 1%
$100,000 and more 2%
direct relationships among the items on the scale. The proportion of variance that two items shared ranged from R2 = 0.02 to R2 = 0.54. No inter-item correlation exceeded
r = 0.73, indicating no multicollinearity problems. The Barlett's test of sphericity, testing the null hypothesis that there was no linear association among the items, was sig-nificant (p-value < .001, χ2
df = 210 = 3081.7). The
Kaiser-Meyer-Olkin (KMO) test measuring sampling adequacy produced a KMO measure of 0.92, indicating a high degree of common variance among the 21 items and that if a factor analysis was conducted, the extracted factors would account for a substantial amount of variance. Indi-vidual measures of sampling adequacy (MSA) produced very good results, (from 0.86 to 0.95).
Evaluation of the loadings in the factor structure matrix found no items with weak loadings. Two items had strong loadings with two factors. Those items were placed with the factors that were conceptually more closely related. The distinct pattern of item-to-factor correlations and the researchers' hypothesis about the structure of the meas-ured construct led to the decision to keep three distinct factors (Table 2):
• Factor 1: patient centered information from the spe-cialist physician (PCISP);
• Factor 2: patient centered preparatory information (PCPI) from the referring physician;
• Factor 3: patient centered information given to the patient about self-management (PCISM).
The first two factors, patient centered information from the specialist and preparatory information from the refer-ring were expected from the qualitative stage of the instru-ment developinstru-ment, but the third factor, information about self-management emerged as a result of the factor analysis and provided new insight and direction for future research.
The common factor analysis produced a rotated factor structure, close to that expected at the development phase of the instrument supporting the construct validity of the instrument. The factor scores were calculated as averages of the scores on all items loading on the corresponding factor. The Alpha coefficient for the factor PCPI was 0.85; for factor PCISP - 0.92; and for factor PCSM - 0.81. The alpha coefficient for the total scale was 0.92. The test-retest correlation for the whole scale was 0.83 indicating good reliability. Although the final version did not undergo test-retest, the changes to the instruments likely would produce the same or better results than the initial version because of the improvements.
One hundred and eighty one patients were still seeing the same specialist while 11 patients had switched to another specialist for this medical problem. The correlation between continuing to see the specialist and PCISP (Patient Centered Information from the SP) was signifi-cant (Spearman's rho = .30, p-values < .001) indicating the importance of PCISP in the patient-specialist relation-ship. A total of 197 patients were seeing the same referring physician while 22 patients were seeing another primary care provider. Patient's perception of the PCPI (prepara-tory information from the PCP) was significantly corre-lated with their intent to remain with that physician (Spearman's rho = .26, p-values < .001).
Patients who perceived the information from their refer-ring physicians as more patient centered had greater trust in them (r = .68, p-value < .001). Likewise, patients receiv-ing information from the specialist that was more patient centered were more likely to trust them (r = .77, p-value < .001). There also was a direct relationship between patient's satisfaction with the information received for self-management (PCSM) and the trust in the referring doctor (r = .56, p-value < .001).
Psychometric evaluation of the instrument indicated that the Patient Centered Referral Information Measure (PCRIM) provides a valid and reliable measure of the three components of the quality of patient centered infor-mation in the referral process: patient centered informa-tion from the referring physician, from the specialist physician, and information about self-management of coordination of care.
Preparation for the specialist visit
While 85% of patients rated the information the referring physician gave about the referral good to excellent, 8% received no information. Most (90%) thought the refer-ring physician gave a good-to-excellent explanation about the reason for the referral (Table 3). Fewer (80%) expressed satisfaction with the oral explanations about their diagnosis and prognosis. However, over one-fourth of patients received no written information from the refer-ring physician about their diagnosis (26%) or treatment (29%). Of those receiving written information, 16% found the quality of information about their diagnosis and treatment lacking. In contrast, more judged the writ-ten instruction about the time and location of the appointment as adequate, yet 15% got nothing in writing. Overall patients thought the amount of preparatory mation they received was adequate, but the specific infor-mation they needed was lacking.
Table 2: Descriptive Statistics for the Scale Items and Factor Structure Matrix
Items Descriptive Statistics* (n = 250) Factor Structure Matrix (Oblique Rotation Promax)
Factors
Mean StDev 1 2 3
1. How would you rate the explanation your referring doctor gave you about the reason for seeing a specialist?
4.1 1.2 .60
2. How would you rate the way your referring doctor explained your condition and prognosis?
3.8 1.4 .64
3. How would you rate the explanation your referring doctor gave you about the follow-up after the specialist visit?
3.1 1.8 .64
4. How would you rate the written information your referring doctor gave you about your diagnosis?
2.8 2.0 .80
5. How would you rate the written information your referring doctor gave you about your treatment?
2.7 2.0 .79
6. How would you rate the way your referring doctor involved you in making the decision to see a specialist?
3.9 1.5 .79
7. How would you rate the information your referring doctor gave you about what to expect at the specialist visit, that is, one physician or more, additional tests, etc?
3.2 1.7 .60
8. How would you rate the way that you referring doctor listened to what you had to say?
3.9 1.4 .79
9. How would you rate the amount of information you received from your referring doctor?
3.6 1.4 .79
10. How would you rate the quality of the written information about the appointment, i.e., appointment care, map and directions to the specialist office?
3.4 1.8 .55
11. How would you rate how well your referring doctor prepared you to know what to tell or ask the specialist?
3.1 1.8 .63
12. How would you rate the information the specialist had about you when you arrived?
3.8 1.5 .55
13. How would you rate the information the specialist gave you about your diagnosis and your prognosis at your visit?
3.9 1.3 .73
14. How would you rate the way that the specialist listened to what you had to say?
4.1 1.2 .82
15. How would you rate the way the specialist involved you in the decisions about treatment?
3.9 1.3 .77
16. How would you rate the compassion shown by the specialist?
3.9 1.3 .82
17. How would you rate the information the specialist gave you about follow up care with your primary care provider and or referring doctor?
3.3 1.7 .63
18. How would you rate the information the specialist gave you about what to do if your problems or symptoms got worse?
3.9 1.4 .76
19. How would you rate the written information (except prescriptions) you got from the specialist about your diagnosis and treatment.
3.5 1.6 .64
20. How would you rate the amount of time the specialist spent with you?
3.8 1.3 .82
21. How would you rate the amount of information the specialist gave you about your condition and treatment.
4.0 1.1 .89
happen at the specialist visit and one-fourth reported feel-ing unprepared about what to ask or tell the specialist. The referring physician sent information to the specialist for about 50% of patients, but nearly one-fourth of them had to take some or all of the information with them (23%). More than one fourth (27%) reported that their referring physician didn't send anything to the specialist office, didn't give them anything to take, or didn't tell them to get anything for the specialist visit. These patients were signif-icantly less satisfied with how the referring physician pre-pared them for the specialist visit, their experience with the specialist, and their self-management information when compared with the patients who reported that their physician either sent information to the specialist office or told them to bring the information themselves (KWT p < 0.05). Patients who received all the information needed from the referring doctor (that is test reports, notes, x-rays) to take to the specialist had significantly higher sat-isfaction with the quality of the information for self-man-agement compared to patients who received no
information from the referring doctor for the specialist (KWT p < 0.05).
Most patients continued to see their referring physician after the specialist visit, but 9% found another, and 12% were managed solely by the specialist. Patient's satisfac-tion with the preparatory informasatisfac-tion from the referring physician (PCPI) was significantly related to their deci-sion to continue seeing the referring physician versus see-ing another primary care physician (logistic regression, p-value < 0.05).
Patient's experiences at the specialist visit
[image:7.612.57.559.104.461.2]Most patients felt that specialists were prepared for their visit, though 7% of patients said the specialists had no information about them when they arrived. This is con-trary to the 27% that reporting that the referring physician did not send information or ask the patient to take infor-mation to the specialist and may be because the referring physician failed to inform the patient that information
Table 3: Patient's ratings of the quality of information received from the referring physician
Question Ratings of patients who received information* Patients who didn't receive any information
Excellent Very good Good Fair Poor
N (%) N (%) N (%) N (%) N (%) N
How would you rate the explanation your referring doctor gave you about the reason for seeing a specialist?
140(57) 49(20) 37(15) 9(4) 9(4) 6
How would you rate the way your referring doctor explained your condition and prognosis?
114(48) 57(24) 44(19) 12(5) 9(4) 14
How would you rate the explanation your referring doctor gave you about the follow-up after the specialist visit?
84(41) 36(17) 59(29) 12(6) 15(7) 44
How would you rate the written information your referring doctor gave you about your diagnosis?
43(80) 37(20) 38(21) 11(6) 18(10) 66
How would you rate the written information your referring doctor gave you about your treatment?
77(43) 32(18) 46(26) 9(5) 14(8) 72
How would you rate the way your referring doctor involved you in making the decision to see a specialist?
127(54) 43(18) 45(19) 10(4) 10(4) 15(a)
How would you rate the information your referring doctor gave you about what to expect at the specialist visit?
79(37) 49(23) 57(26) 18(8) 13(6) 34
How would you rate the way that you referring doctor listened to what you had to say?
120(50) 51(21) 39(16) 18(7) 15(6) 7 (b)
How would you rate the amount of information you received from your referring doctor?
94(39) 55(23) 56(24) 17(7) 16(7) 12
How would you rate the quality of the written information about the appointment, i.e., appointment care, map and directions to the specialist office?
108(50) 33(16) 50(23) 10(5) 13(6) 36
How would you rate how well your referring doctor prepared you to know what to tell or ask the specialist?
78(37) 48(23) 44(21) 14(7) 26(12) 40 (c)
Overall, how would you rate the information your referring doctor gave you about the referral?
98(43) 51(22) 46(20) 21(9) 14(6) 20
Please rate how well you trust your referring doctor to coordinate your care about this particular condition
141(60) 38(16) 24(10) 17(7) 16(7) 14 (d)
would be sent. (Table 4 summarizes the results for the specialist). Overall, patients were satisfied with the amount of time the specialist spent with them, although nearly one in five (17%) disagreed. Most patients felt the specialist listened to them, involved them in decision making about their care, and treated them with compas-sion.
Patients gave good ratings to the oral explanations of their diagnosis and prognosis. About 90% got some written materials about their diagnosis and treatment from the specialist, however, not all thought the quality of the writ-ten information was good. Most patients (91%) rated the information about what to do if problems or symptoms got worse as good or excellent and only 6% were not told what to do. Thirty percent of patients reported that they had tests repeated that the referring physician had already done. Nearly one in five patients (18%) got information from the specialist that conflicted with what the referring doctor had given.
Care Coordination
The referring physician and specialist managed the care jointly of 76% of the patients, 12% were solely managed by their referring physician, and 12% were managed
solely by a specialist. The majority of patients (80%) trusted the referring doctor to coordinate their care with the specialist. Satisfaction with the coordination of care was highly associated with the quality of information from the referring doctor. Specifically, satisfaction with the way the referring doctor and specialist coordinated the patient's care was significantly associated with their satis-faction with the patient centered preparatory information from the referring physician (PCPI) (Rho = 0.6, p < 0.05), with patient centered information from the specialist phy-sician (PCISP) (Rho = 0.6, p < 0.05), and with patient cen-tered information given to the patient about self-management (PCISM) (Rho = 0.5, p < 0.05).
[image:8.612.58.561.105.408.2]Over one-fourth (26%) of patients received no informa-tion from the specialist about follow-up with their refer-ring doctor and 12% of those who were told about follow-up found the information insufficient. Patients found the coordination of their care by the specialist to be lacking and this perception did not differ based on the patient's gender or age. However, patients with higher education tended to be less satisfied with the information received from the referring physician (PCPI) (KWT p < 0.05) and specialist (PCISP) (KWT p < 0.05), and about self-man-agement (PCISM) (KWT p < 0.05).
Table 4: Patient rating of quality of information about the referral received from the specialist physician
Question. Received Information*
Excellent N (%)
Very Good N (%)
Good N (%)
Fair N (%)
Poor N (%)
Didn't Receive Information N
How would you rate....
The information the specialist had about you when you arrived?
119(51) 50(21) 43(19) 11(5) 10(4) 17
The information the specialist gave you about your diagnosis and your prognosis at your visit?
120(50) 56(23) 40(16) 14(6) 12(5) 8
The way that the specialist listened to what you had to say?
132(53) 51(21) 40(16) 12(5) 12(5) 3 (b)
The way the specialist involved you in the decisions about treatment?
119(49) 59(24) 38(16) 12(5) 14(6) 8 (e)
The compassion shown by the specialist? 118(48) 58(23) 38(15) 17(7) 16(7) 3 The information the specialist gave you about follow up
care with your primary care provider and or referring doctor?
92(43) 46(21) 50(23) 13(6) 14(6) 35
The information the specialist gave you about what to do if your problems or symptoms got worse?
125(53) 57(24) 32(14) 12(5) 10(4) 14
The written information (except prescriptions) you got from the specialist about your diagnosis and treatment?
98(43) 52(23) 51(23) 10(4) 15(7) 24
The amount of time the specialist spent with you? 115(46) 47(19) 45(18) 17(7) 26(10) NA The amount of information the specialist gave you about
your condition and treatment?
115(46) 67(27) 44(18) 11(4) 11(4) 2
Overall, the way the referring doctor and the specialist coordinated your care?
110(49) 49(22) 39(17) 10(4) 17(8) 25 (f)
How well you trust the specialist you saw? 144(58) 46(19) 29(12) 12(5) 15(6) 4 (d)
Patient satisfaction was greater with the coordination of their care by the specialist when the specialist sent infor-mation back to their referring physician. Those feeling that the specialist coordinated their care well were more likely to have been informed by the specialist about follow-up care with their referring doctor or primary care pro-vider (Rho = 0.5, p < 0.05). The perception that the spe-cialist coordinated their care well also was highly correlated with how well the referring physician explained the follow-up after the specialist visit, prepared them for what to expect at the specialist visit and what to ask or tell the specialist (Rho = 0.5, p < 0.05).(Table 5)
Physician Trust
Nearly two-thirds of patients (72%) expressed high levels of trust in the referring physician to manage their care, but nearly 20% did not. Those who trusted their referring phy-sician to coordinate their care rated the information from the referring physician higher (Rho = 0.6, p < 0.05), con-sidered themselves more involved in decision making (Rho = 0.6, p < 0.05), and felt the referring physician lis-tened to them (Rho = 0.6, p < 0.05). Trust in the referring
physician to coordinate their care was highly associated with their satisfaction with preparatory information from that physician (Rho = 0.7, p < 0.05). The higher the satis-faction with the preparatory information (PCPI) from the referring physician, the greater the trust in him or her (Rho = 0.7, p-value < 0.05). There also was a direct associ-ation between patient's satisfaction with the preparatory information for self-management (PCISM) and trust in the referring doctor (Rho = 0.5, p-value < 0.05). The higher the patient's satisfaction with the self-management information, the greater the trust placed in the referring physician.
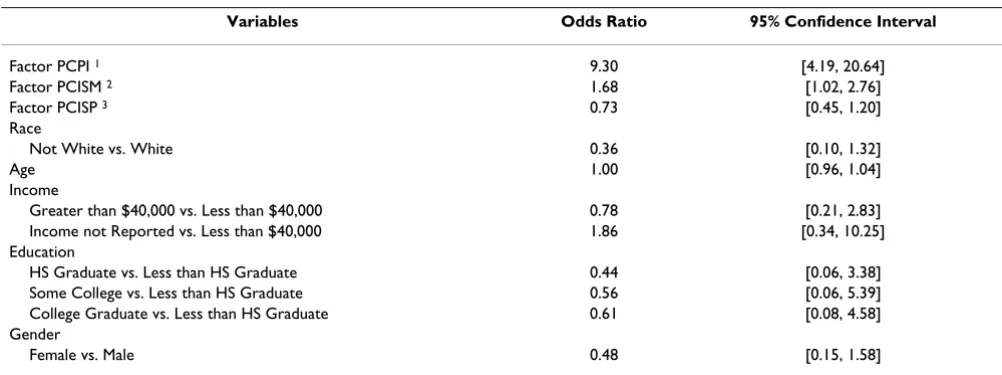
[image:9.612.58.552.368.741.2]A logistic regression model testing that preparatory infor-mation from the referring physician influenced the patient trust in the referring physician to coordinate their care was significant (Wald p < 0.001). The variable income had a high percentage of (17%) missing values that were recoded into a separate category. Two-way inter-actions were included and a stepwise method for variable selection was used. Interactions were not significant and were dropped from the model. Only two variables in the
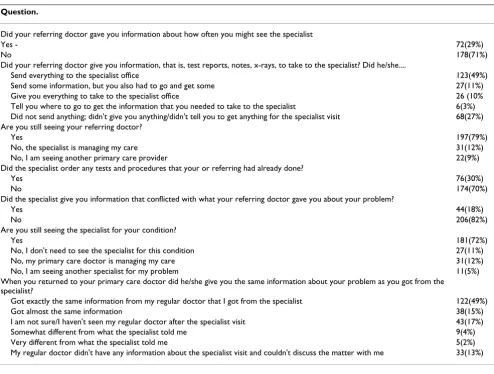
Table 5: Care coordination and other information related to the referral
Question.
Did your referring doctor gave you information about how often you might see the specialist
Yes - 72(29%)
No 178(71%)
Did your referring doctor give you information, that is, test reports, notes, x-rays, to take to the specialist? Did he/she....
Send everything to the specialist office 123(49%)
Send some information, but you also had to go and get some 27(11%) Give you everything to take to the specialist office 26 (10% Tell you where to go to get the information that you needed to take to the specialist 6(3%) Did not send anything; didn't give you anything/didn't tell you to get anything for the specialist visit 68(27%) Are you still seeing your referring doctor?
Yes 197(79%)
No, the specialist is managing my care 31(12%)
No, I am seeing another primary care provider 22(9%)
Did the specialist order any tests and procedures that your or referring had already done?
Yes 76(30%)
No 174(70%)
Did the specialist give you information that conflicted with what your referring doctor gave you about your problem?
Yes 44(18%)
No 206(82%)
Are you still seeing the specialist for your condition?
Yes 181(72%)
No, I don't need to see the specialist for this condition 27(11%)
No, my primary care doctor is managing my care 31(12%)
No, I am seeing another specialist for my problem 11(5%)
When you returned to your primary care doctor did he/she give you the same information about your problem as you got from the specialist?
Got exactly the same information from my regular doctor that I got from the specialist 122(49%)
Got almost the same information 38(15%)
I am not sure/I haven't seen my regular doctor after the specialist visit 43(17%) Somewhat different from what the specialist told me 9(4%)
Very different from what the specialist told me 5(2%)
full model (see Table 6) had a significant main effect -PCPI (Wald Chi-square p < 0.0001) and PCISM (Wald Chi-square p = 0.04). Therefore patient centered prepara-tory information from the referring physician and patient centered information given to the patient about self-man-agement are strongly associated with the trust in the refer-ring physician to coordinate the care for the particular condition.
Patients also expressed a high level of trust in the special-ist. Level of trust was strongly associated with receiving good information overall, the specialist understanding of why they were referred, information provided by the spe-cialist about their diagnosis and prognosis, and informa-tion about how to care for themselves at home (p-values for the Spearman correlation tests were less than 0.0001). Trust in the specialist was also strongly linked to the patient centeredness of the specialist, being listened to, involved in decision making, and treated with compas-sion (Spearman correlation test p-values < .0001). The logistic regression model testing the association of the quality of the referral information produced a significant p-value for the full model. Only one independent varia-ble, patient centered information from the SP (PCISP), had a significant main affect (Wald Chi-square p < 0.0001). Thus trust in the specialist was strongly associ-ated with the patient centeredness of the specialist. (Table 7)
Discussion
Our findings illuminate the critical role played by prepar-atory information in the coordination of care between the primary care provider, the patient, and the specialist
pro-vider. Patients were more satisfied if they were well informed. Most patients received good information about the reason for the referral to a specialist, but were not pre-pared for what to expect at the specialist visit. Most expla-nations were oral and the written information that patients received was less than adequate. That patients received different information about their condition from the specialist is to be expected because the specialist has more in-depth knowledge about the problem.
The number of repeated tests (30%) reported by patients is higher than prior studies and raises concern about the increased costs in the system resulting from insufficient information exchange between providers [26]. Although some redundant testing is warranted the estimated annual savings resulting from electronic information exchange is over one billion US dollars [27]
This study did not address the perspectives of the referring or specialist physicians, consequently the method of information exchange between the providers is not known. An earlier study by the investigators of 231 regional referrals found that the primary care providers most often used facsimile transmission with only one using email.
The quality of the preparatory and self-management infor-mation given to patients by their primary care providers influenced their trust in the ability of the primary care pro-vider to coordinate their care and also influenced their trust in the specialists. Hence the quality of preparatory information given to patients is very important. Knowing the ratings on the items in these scales that predict trust can assist the referring and specialist physicians in
identi-Table 6: Logistic regression model with dependent variable "Trust in referring physician"
Variables Odds Ratio 95% Confidence Interval
Factor PCPI 1 9.30 [4.19, 20.64]
Factor PCISM 2 1.68 [1.02, 2.76]
Factor PCISP 3 0.73 [0.45, 1.20]
Race
Not White vs. White 0.36 [0.10, 1.32]
Age 1.00 [0.96, 1.04]
Income
Greater than $40,000 vs. Less than $40,000 0.78 [0.21, 2.83] Income not Reported vs. Less than $40,000 1.86 [0.34, 10.25] Education
HS Graduate vs. Less than HS Graduate 0.44 [0.06, 3.38] Some College vs. Less than HS Graduate 0.56 [0.06, 5.39] College Graduate vs. Less than HS Graduate 0.61 [0.08, 4.58] Gender
Female vs. Male 0.48 [0.15, 1.58]
1PCPI = Preparatory Information from the RP
[image:10.612.54.555.514.701.2]fying weaknesses and plan interventions to improve the process and subsequently increase the trust that patients have in them. Each of these processes could be tractable to improvement; and it should be possible to develop tools to assist the primary physicians in providing good prepar-atory information.
There are limitations to this study including the use of a random sample of patients selected from the National Research Corporation's (NRC) current hospital clients. The sample is not a random sample of all US patients, only those served by the 500 client hospitals of NRC and the findings can only be generalized to the population of NRC hospitals. That only 1 in 7 agreed to the respond to the survey is also a limitation. Some authors suggest that there is an increasing trend toward refusals particularly in telephone surveys that can be attributed to time con-straints ("too busy"), lessened sense of civic responsibility or sense of reciprocity, too many survey requests, and con-cerns about safety, fraud, and misrepresentation. Low response rates create the possibility for nonresponse bias. It is not known if those who responded to the survey differ from those who did not. We are assuming that the results from the survey are generalizable, but further research will show whether this assumption was correct. The use of a single- item to measure trust in the referring physician to manage the referral process and trust in the specialist also may be considered a limitation. Although single item measures have been reported in other studies of care tran-sitions, and are appropriate for some purposes, multi-item measures are useful for identifying specific areas for improvement [28-30].
Conclusion
Referrals are very common - in 2006 about 33% of the 421 million specialist's visits resulted from a referral - and constitute an important transition in care from the
pri-mary physician to a specialist and then back again. Ideally all or nearly all patients should feel that they got good information about the referral.
It is likely that primary physicians do not get good feed-back from patients or specialists about the adequacy of the information they have provided. Primary care physicians are key to improving coordination of care by managing referrals [31]. If physicians are to improve their informa-tion exchange with patients, certain changes in the health system could help support the process. The current move-ment in the US towards use of electronic health records with electronic health information exchange between pro-viders would increase provider to provider communica-tion and allow for patient access to their pertinent information. Perhaps more importantly, the designation of a medical home (primary care provider) for all patients would improve coordination of care. Patients would know who was responsible for their care and the primary care provider would be responsible for coordinating infor-mation exchange with other providers in the system.
Competing interests
The authors declare that they have no competing interests.
Authors' contributions
CLI participated in the study design, survey development, provided oversight for the survey, participated in data analysis, and drafted the manuscript. CLS participated in the design of the survey instrument and manuscript review. FDS participated in the design of the study and drafting of the manuscript. SS conducted all of the statis-tical analyses and assisted in drafting the manuscript.
Authors' Information
[image:11.612.55.552.99.286.2]CLI has over 40 years in health care with an emphasis on quality measurement, served on a NCQA expert panel on
Table 7: Logistic regression model with dependent variable "Trust in specialist"
Variables Odds Ratio 95% Confidence Interval
Factor PCISP 8.44 [4.12, 17.27]
Factor PCISM 0.84 [0.47, 1.52
Factor PCPI 1.06 [0.55, 2.05]
Race
Not White vs. White 3.71 [0.51, 27.09]
Age 0.97 [0.92, 1.03]
Income
Greater than $40,000 vs Less than $40,000 1.23 [0.25, 6.10] Income not Reported vs. Less than $40,000 0.52 [0.11, 2.53] Education
HS Graduate vs. Less than HS Graduate 0.42 [0.04, 4.15] Some College vs. Less than HS Graduate 1.99 [0.12, 32.67] College Graduate vs. Less than HS Graduate 0.32 [0.03, 2.89] Gender
quality metrics in the care transition, and serves on the board of a national QIO.
SS is the Assistant Director for Research and Analysis in the Office of Institutional Research at the University of Kentucky and has published in US and international jour-nals.
CLS is the Chief Medical Information Officer at an aca-demic health center and developed a web based portal for referring physicians.
FDS has been involved in health services education and research for over forty years, has published extensively, served in editorial positions for eight health related publi-cations, and on numerous national organizations.
Acknowledgements
We would like to acknowledge the Commonwealth Fund for their funding and support of this research.
References
1. Cherry DK, Woodwell DA: National Ambulatory Medical Care Survey: 2006 Summary. Natl Health Stat Report 2008, 3:1-39. 2. Cleary PD, Edgman-Levitan S, Roberts M, Moloney TW, McMullen W,
Walker JD, Delbanco TL: Patients evaluate their hospital care: a national survey. Health Aff (Millwood) 1991, 10(4):254-267. 3. Piterman L, Koritsas S: Part I. General practitioner and
special-ist relationship. Intern Med Journ 2005, 35:430-434.
4. Emanuel LL: The consultant and the patient-physician rela-tionship. Arch Intern Med 1994, 154:1785-1970.
5. Williams TF, White KL, Fleming WL, Greenberg BG: The referral process in medical care and the university clinic's role. J Med Educ 1961, 36:899-907.
6. Forrest CB, Glade GB, Baker AE, Bocian A, von Schrader S, Starfield B: Coordination of specialty referrals and physician satisfac-tion with referral care. Arch Pediatr Adolesc Med 2000,
154:499-506.
7. Gandhi TK, Sittig DF, Franklin M, Sussman AJ, Fairchild DG: Com-munication breakdown in the outpatient referral process. J Gen Intern Med 2000, 15:626-631.
8. Blankenship JC, Manapace FJ, Fox LS, Frey CM: Telephone report-ing of the results of cardiac procedures: feasibility and pri-mary care physician preferences. A J Med 1999, 106:521-526. 9. Barnes EA, Hanson J, Neumann CM, Nekolaichuk CL, Bruera E:
Communications between primary care physicians and radi-ation oncologists regarding patients with cancer treated with palliative radiotherapy. J Clin Oncol 2000,
18(15):2902-2907.
10. Bodenheimer T: Coordinating care: a major (unreimbursed) task of primary care. Ann Intern Med 2007, 147(10):730-731. 11. Gandhi TK, Sittig DF, Franklin M, Sussman AJ, Fairchild DG:
Com-munication breakdown in the outpatient referral process. J Gen Intern Med 2000, 15:626-631.
12. Gandhi TK: Fumbled handoffs: one dropped ball after another.
Ann Intern Med 2005, 142(5):352-350.
13. Casalino LP, Dunham D, Chin MH, Bielang R, Kistner EO, Karrison TG, Ong MK, Sarkar U, McLaughlin MA, Meltzer DO: Frequency of Failure to Inform Patients of Clinically Significant Outpa-tient Test Results. Arch Intern Med 2009, 169(12):1123-1129. 14. Albertson GA, Lin CT, Kutner J, Schilling LM, Anderson SN,
Ander-son RJ: Recognition of patient referral desires in an academic managed care plan frequency, determinants, and outcomes.
J Gen Intern Med 2000, 15(4):242-247.
15. Albertson G, Lin C, Schilling L, Cyran E, Anderson S, Anderson RJ:
Impact of a simple intervention to increase primary care provider recognition of patient referral concerns. Am J Manag Care 2002, 8(4):375-381.
16. Forrest CB, Shadmi E, Nutting PA, Starfield B: Specialty referral completion among primary care patients: results from the ASPN Referral Study. Ann Fam Med 2007, 5(4):361-367. 17. Keating NL, Green DC, Kao AC, Gazmararian JA, Wu VY, Cleary PD:
How are patients' specific ambulatory care experiences related to trust, satisfaction, and considering changing phy-sicians? J Gen Intern Med 2002, 17(1):29-39.
18. Keating NL, Gandhi T, Orav EJ, Bates DW, Ayanian JZ: Patient characteristics and experiences associated with trust in spe-cialist physicians. Arch Intern Med 2004, 164(9):1015-1020. 19. Fiscella K, Meldrum S, Franks P, Shields CG, Duberstein P, McDaniel
SH, Epstein RM: Patient trust-is it related to patient-centered behavior of primary care physicians? Med Care 2004,
42(11):1049-1054.
20. Vermeire E, Hearnshaw H, Van Royen P, Denekens J: Patient adherence to treatment: three decades of research. A com-prehensive review. J Clin Pharm Ther 2001, 26(5):331-342. 21. White P, Singleton A, Jones R: Copying referral letters to
patients: the views of patients, patient representatives and doctors. Patient Educ Couns 2004, 55(1):94-98.
22. Eaden JA, Ward B, Smith H, Mayberry JF: Are we telling patients enough? A pilot study to assess patient information needs in a gastroenterology outpatient department. Eur J Gastroenterol Hepatol 1998, 10(1):63-67.
23. Crossing the Quality Chasm: A New Health System for the 21st Century
National Academy Press; 2001.
24. Pett MA, Lackey NR, Sullivan JJ: Making Sense of Factor Analysis: The Use of Factor Analysis for Instrument Development in Health Care Research
SAGE Publications; 2003.
25. Nunnally JC, Bernstein IH: Psychometric Theory New York: McGraw-Hill; 1994.
26. Frisse ME, Holmes RL: Estimated financial savings associated with health information exchange and ambulatory care referral. J Biomed Inform 2007, 40:S27-S32.
27. Hillestad R, Vigelow J, Bower A, Girosi F, Meili R, Scoville R, Taylor R: Can electronic medical record systems transform health care? Potential health benefits, savings, and costs. Health Aff (Millwood) 2005, 24(5):1103-1117.
28. Keating NL, Green DC, Kao AC, Gazmararian JA, Wu VY, Cleary PD:
How are patients' specific ambulatory care experiences related to trust, satisfaction, and considering changing phy-sicians? J Gen Intern Med 2002, 17(1):29-39.
29. Keating NL, Gandhi T, Orav EJ, Bates DW, Ayanian JZ: Patient characteristics and experiences associated with trust in spe-cialist physicians. Arch Intern Med 2004, 164(9):1015-1020. 30. Thom DH, Hall MA, Pawlson LG: Measuring patients' trust in
physicians when assessing quality of care. Health Aff (Millwood)
2004, 23(4):124-132.
31. Schoen C, Osborn R, Huynh PT, Doty M, Peugh J, Zapert K: On the front lines of care: primary care doctors' office systems, experiences, and views in seven countries. Health Aff (Millwood)
2006, 25(6):555-571.
Pre-publication history
The pre-publication history for this paper can be accessed here: