R E S E A R C H A R T I C L E
Open Access
Catastrophic health care spending and
impoverishment in Kenya
Jane Chuma
1,2*and Thomas Maina
3Abstract
Background:Many health systems in Africa are funded primarily through out-of-pocket payments. Out-of-pocket payments prevent people from seeking care, can result to catastrophic health spending and lead to
impoverishment. This paper estimates the burden of out-of-pocket payments in Kenya; the incidence and intensity of catastrophic health care expenditure and the effect of health spending on national poverty estimates.
Methods:Data were drawn from a nationally representative health expenditure and utilization survey (n = 8414) conducted in 2007. The survey provided detailed information on out-of-pocket payments and consumption expenditure. Standard data analytical techniques were applied to estimate the incidence and intensity of catastrophic health expenditure. Various thresholds were applied to demonstrate the sensitivity of catastrophic measures.
Results:Each year, Kenyan households spend over a tenth of their budget on health care payments. The burden of out-of-pocket payments is highest among the poor. The poorest households spent a third of their resources on health care payments each year compared to only 8% spent by the richest households. About 1.48 million Kenyans are pushed below the national poverty line due to health care payments.
Conclusions:Kenyans are becoming poorer due to health care payments. The need to protect individuals from health care related impoverishment calls for urgent reforms in the Kenyan health system. An important policy question remains what health system reforms are needed in Kenya to ensure that financial risk protection for all is achieved.
Background
Protecting households from catastrophic health care costs is a desirable objective of health systems worldwide. The World Health Organization (WHO) call for univer-sal health coverage emphasized the need to protect households from catastrophic medical expenses and im-poverishment arising from seeking health care [1]. The call also urged health systems to ensure that health care costs do not prevent people from receiving needed health services [2]. Globally it estimated that 150 million people suffer financial catastrophe each year due to health care payments and about 100 million are pushed into poverty because of out-of-pocket (OOP) payments [3].
Catastrophic health care payments occur in both rich and poor countries, but over 90% of the people affected reside in low-income countries [4]. Catastrophic health expenditure can occur regardless of the amount of money paid to health care services. Rich households might pay large medical bills without experiencing nega-tive implications, while low levels of spending among poor households can have severe financial implications for livelihoods [4,5]. There is no single accepted defin-ition of catastrophic spending. Some studies assess pay-ments in relation to the budget share [6-8]; while others argue that catastrophic spending should be measured in relation to capacity to pay (i.e. household expenditure net of food spending) [4,9,10]. Nonetheless, all measures suggest that when households spend a large proportion of their budget on health care, they often forego other goods and services, which can have negative implications for living standards [11].
* Correspondence:jchuma@kilifi.kemri-wellcome.org
1
Kenya Medical Research Institute (KEMRI)-Wellcome Trust Research Programme, Nairobi, Kenya
2
Centre for Tropical Medicine, Nuffield Department of Clinical Medicine, University of Oxford, Oxford, United Kingdom
Full list of author information is available at the end of the article
Health systems in Africa and other low-income coun-tries are predominantly funded through OOP payments. Out-of-pocket payments do not offer any financial risk protection; many households incur high health expend-iture, while others are impoverished due to health care costs [4]. A significant number of households do not seek care because they cannot afford to pay [12]. House-holds often adopt coping strategies to meet the costs associated with seeking care [13]. These strategies, al-though useful in the short-term, lead to impoverishment or deepen poverty among households who are already poor [5,6,14]. Such households are hardly captured in national poverty estimates, since high health costs raise their expenditure above the poverty threshold and are therefore considered to be non-poor [15].
Various studies assess the impact of catastrophic spending on household poverty. These studies, mainly conducted in Asia and Latin America, show that health care costs are major causes of impoverishment. In their study on health expenditures in 11 Asian countries, van Doorslaer et al. reported that poverty estimates were 14% higher when OOP payments are accounted for and that about 78 million people are pushed into poverty due to heath care costs [15]. Elsewhere, a survey of 89 countries found that catastrophic expenditure was reported by 3%, 1.8% and 0.6% of households in low, middle and high income countries respectively [3]. Few studies have documented the levels of catastrophic health expenditures in Africa. In Burkina Faso, about 15% of households reporting illness incurred costs greater than 40% of their non-food consumption ex-penditure [16], while in Uganda, 2.9% of households in-curred catastrophic expenditure in 2003 [10]. In Nigeria, 40.2% of households incurred costs greater than 10% of their consumption expenditure; this proportion reduced to 14.8% when the threshold was set at 40% [17]. The poorest households were more likely to incur cata-strophic expenditures compared to households.
A limitation of the few studies conducted in Africa is that they do not assess the implications of health care costs on national poverty estimates [10,16-18]. Assessing the role of health care payments on poverty is important for informing policy on the need to incorporate health financing designs in poverty reduction programmes and for highlighting the urgent need to ensure that health fi-nancing systems offer financial risk protection. This paper contributes to the literature by assessing the ex-tent of catastrophic health spending and impoverish-ment in Kenya. Using different thresholds, which have been widely applied in the literature, the paper estimates the incidence and intensity of catastrophic health care expenditure for both outpatient and inpatient care and shows the proportion of individuals pushed into poverty due to OOP payments. Also estimated is the amount by
which households resources would fall short of poverty thresholds.
Methods
Study setting
Kenya’s Gross Domestic Product (GDP) per capita was
739 US Dollars in 2009. The proportion of Kenyans living below the poverty line was 45.9% in 2005 [19], although recent statistics suggests that these levels could have increased to over 50% [20]. A description of the Kenyan health financing and delivery system is published elsewhere [21]. Briefly, all public health facilities charge user fees at the point of care. In 2004, user fees at dis-pensaries and health centres were replaced with a flat consultation fee of Kenya shillings 10 (US$0.13) and 20 (US$0.26) respectively. There exists a significant private sector that owns about 49% of all health facilities in the country. The Kenyan health system relies heavily on OOP payments, accounting for 51.1% of total health ex-penditure in 2001; 39.3% in 2005 and 36.7% in 2009 [22,23].
Data sources
Data are from a nationally representative cross-sectional household survey conducted by the Ministry of Health in 2007. Detailed data were collected on socio-demographic characteristics, self reported illnesses, health care utilization patterns, OOP payments, sources of funds and consumption expenditure for both food and non-food items. Out-of-pocket spending were col-lected for various items including registration, drugs, consultation, diagnostic tests, surgery, daily bed rates among others. Data were collected for both outpatient and inpatient illnesses using a four week and one year recall period respectively.
Data analysis
Measuring incidence and intensity of catastrophic spending
Standard approaches to assess the incidence and intensity of catastrophic expenditure and the implications for poverty estimates are described in detail by O’Donnell et al. (2008). These analytical approaches are briefly described here but interested readers are encouraged to refer to O’Donnell et al. (2008) for additional information.
40% of non-food income (referred to as capacity to pay). Alternative catastrophic thresholds are presented in this study to demonstrate sensitivity of different measures. Analysis is done purely on out-of-pocket payments (i.e. payments made directly to providers), although it is recognized that indirect costs affect households signifi-cantly [5]. Where costs were fully covered through health insurance, the same were excluded in the analysis unless payments were made, in which case the co-payment was considered as OOP co-payments. Households were classified into socioeconomic quintiles using per capita consumption expenditure.
The incidence of catastrophic payments is defined as payments in excess of a threshold budget share. The catastrophic head count (HC) refers to the percentage of households incurring catastrophic payments and is esti-mated as follows [11]:
HC¼N1XN
i¼1
E ð1Þ
Where N is the sample size: E is an indicator equal to
1 if OOP payments of a household ias a proportion of
its consumption expenditure (total or non-food) is greater than the threshold and zero otherwise. The HC estimates the proportion of households that have OOP payments above the threshold but does not measure the amount by which these payments exceed the chosen threshold. The catastrophic payment overshoot is esti-mated to give an indication of how much OOP pay-ments exceed the threshold. The overshoot (O) is estimated as follows [11]:
Oi¼EiðTi=XizÞ ð2Þ
Where Ti is the OOP payments of household i, Xi is the household consumption expenditure (food or non-food) and z is the threshold budget share. Following this estimation, the average over shoot is [11]:
O¼N1XNi¼1O ð3Þ
The intensity of catastrophic expenditure is measured by the payment in excess of the threshold, averaged over all households exceeding that threshold. This measure, referred to as the mean positive overshoot (MPO) is equal to:
MPO¼HCO ð4Þ
Adjusting catastrophic spending estimates for socio-economic status
A limitation of the head count and overshoot discussed in the previous section is that they do not differentiate between poor and rich households [11]. The headcount (HC) for example counts all households whose levels of OOP payments exceed a certain threshold equally. The
overshoot (O) counts the payments in excess of the
threshold equally, irrespective of whether these pay-ments are made by poor or rich households [11]. High levels of OOP payments among rich households can be met through reducing spending on non-basic items like entertainment, while for poor households, even low levels of spending might require foregoing basic needs like food and education. Clearly, the opportunity costs of
catastrophic health care payments will differ between
rich and poor households.
To account for differences in the distribution of cata-strophic payments between rich and poor households, results are presented for weighted and un-weighted head counts and overshoot. The distribution of catastrophic payments in relation to household welfare is measured by the concentration indices forEi(CE) andOi(Co). The concentration index ranges from−1 to +1. It is negative (positive) if the variable of interest is concentrated among the poor (rich) [24]. For example, a positive value of CE indicates a greater tendency for the richer house-holds to exceed the payment threshold, while a negative value indicates that the poor are more likely to exceed the threshold. The distribution of the head count and overshoot can be adjusted for socio-economic differ-ences by putting into consideration the concentration indicesCEand CO[25]. The weighted head count (HCw) and overshoot (Ow) measures are computed as:
HCw¼HC 1C
E
ð Þ;OwOð1COÞ:
Where normative interpretation of catastrophic pay-ments are necessary, it is considered appropriate to give more weight to excess payments made by poorer
house-holds [26]. The weighted head count (HCw) gives a
weight of two to the lowest consumption expenditure (income) and the weight declines linearly with the rank in socio-economic measure such that the richest house-holds receive a weight of zero [11].
Health care spending and impoverishment
are presented: (1) Poverty head count, which refers to the proportion of households living below the poverty line; (2) Poverty gap, referring to the aggregate of all shortfalls from the poverty line (i.e. the poverty head count multiplied by the average deficit of the poor from the poverty line); (3) Normalised poverty gap, which is obtained by dividing the poverty gap by the poverty line. The normalized poverty gap is useful for international comparisons across countries with different poverty lines and currency units [11]. These measurements require setting a poverty line and assessing the extent to which health care payments push households below the pov-erty line. The national povpov-erty line of Kenya shillings (KES) 1257 per person per month was used to estimate poverty levels before and after health care payments. This poverty line has been criticized as being too low to meet the high costs of living [20], but remains the offi-cial rate used by the Kenyan government to estimate poverty levels and thus provides a good basis for comparisons.
Data were analyzed using STATA (Version 11.2) and ADEPT (version 4.1). Ethical clearance was sought from the Kenya Medical Research Institute (protocol number 1609).
Results
Out-of-pocket payments on outpatient and inpatient services
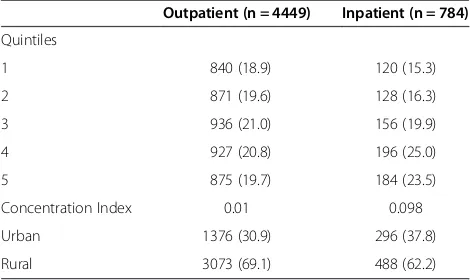
A total of 8,414 households took part in the cross-sectional survey. Illnesses in the four weeks preceding the survey were reported by 52.9% of households (Table 1). Hospital admissions were reported by 9.3% of households. About 3% of illnesses reported in the four weeks preceding the survey were not treated and 125 individuals (11.5%) requiring hospital admission were not admitted due to cash shortages. The concentration indices (CI) show that the richest households were more likely to report illnesses (CI = 0.01 for outpatient ill-nesses; 0.098 for inpatient), however these differences were only significant for inpatient care (p < 0.001).
Differences between rural and urban areas were also only significant for hospital admissions (p < 0.001).
Mean annual spending for all households regardless of whether they reported illness was KES 3526.7 for out-patient services and KES 8195.5 for hospital admissions (Table 2). Rich households spent significantly more money on health care than the poor (P < 0.001). For ex-ample, the poorest households spent a mean of KES 2217 on outpatient services, while the richest house-holds spent KES 5345.9 (P < 0.001). Mean spending on outpatient services was significantly higher in urban than in rural areas (Table 1).
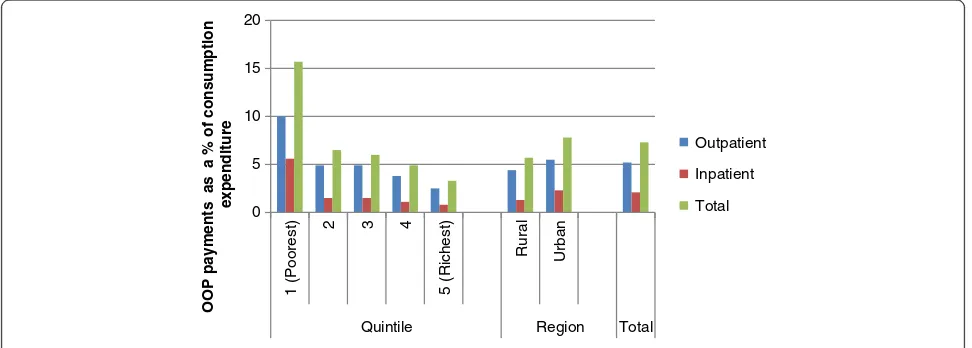
Figure 1 shows the household budget share of OOP payments among households reporting illness. Overall households spent 5.2% of their annual budget on out-patient services and 2.0% on inout-patient services. Mean
total OOP payments amounted to 7.3% of households’
annual budget. The poorest households spent the largest share of their budget on health care (15.3%) compared to the richest households (3.3%). For outpatient services, the poorest quintile spent 10.0% of their budget on out-patient care, while the richest spent 2.5%. Hospital admissions consumed a lower share of household budget compared to outpatient care, with the poorest quintile spending about 5.6% of their budget on inpatient care, while the richest quintile spent 0.8%. Rural households spent a larger proportion of their annual budgets on health care compared to urban households (7.8% and 5.7% respectively).
Catastrophic health expenditure and impoverishment The incidence and intensity of catastrophic health pay-ments are shown on Table 3. Results show an inverse re-lationship between catastrophic headcount and the various thresholds. For example, 15.5% of households reported total OOP payments exceeding 10% of total household expenditure. Increasing the threshold to 40% reduces the catastrophic head count to 4.6%. The inci-dence of catastrophic health expenditure increases when catastrophic payments are defined in respect to non-food budget. For instance, the proportion of household’s incurring total OOP payments greater than 25% increases from 6.9% to 16.0% when estimates are based on total and non-food expenditure respectively. The results also show that a larger proportion of households reporting illness in the four weeks preceding the survey (outpatient) incurred catastrophic expenditure compared to inpatient. For example, 4.4% of households reporting outpatient illnesses incurred costs above 25% of their total expenditure compared to 2.0% of households who reported a hospitalization.
[image:4.595.56.291.593.733.2]The weighted head count is higher than the un-weighted meaning that those who exceed the payment threshold tend to be poorer (Table 3). For example, the
Table 1 Proportion of survey households reporting illness
Outpatient (n = 4449) Inpatient (n = 784)
Quintiles
1 840 (18.9) 120 (15.3)
2 871 (19.6) 128 (16.3)
3 936 (21.0) 156 (19.9)
4 927 (20.8) 196 (25.0)
5 875 (19.7) 184 (23.5)
Concentration Index 0.01 0.098
Urban 1376 (30.9) 296 (37.8)
proportion of households with total OOP payments above 10% of their total expenditure is 15.5%. This pro-portion increases to 17.6% after applying weights to dif-ferent socio-economic groups. Similarly, the proportion of households reporting total OOP payments above 40% of non-food spending is 11.4%. Accounting for differ-ences in socio-economic status through the weighted head count increases this proportion to 14.8%. The weighted overshoot level presents a similar pattern for all threshold levels (i.e. they are higher than the un-weighted). The higher concentration of catastrophic pay-ments among the poorest households is also confirmed by the negative values of concentration indices for the incidence of catastrophic payment (C_E). The C_E increases with the threshold, suggesting greater inequal-ities in catastrophic spending between the poorest and richest households for higher thresholds. The mean positive overshoot (i.e. the extent to which household health payments exceed various thresholds) show that on average, health expenditure for all households is 8.7%
higher than 40% of total budget share. The correspond-ing value for non-food budget share is 25.4%.
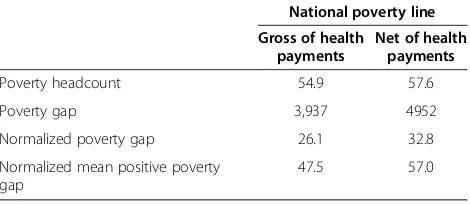
The poverty head count before and after accounting for OOP payments is shown in Table 4. The results reveal that 54.9% of individuals were already living below the na-tional poverty line before making any health care pay-ments. After accounting for OOP payments, the poverty head count increased by 2.7 percentage points. This represents a substantial rise in the poverty estimates, amounting to 5% of the population or 1.98 million indivi-duals. The average deficit to reach the poverty line in the population (i.e. the poverty gap) was KES 3938 before accounting for OOP payments. After accounting for OOP payments, the average deficit increased to KES 4952.
Discussion
[image:5.595.57.545.100.276.2]The results presented in this paper show great disparities in levels of self-reported illness and health care payment between the poor and the rich. The richest households were more likely to report both outpatient and inpatient
Table 2 Mean annual spending in Kenya shillings
Outpatient Inpatient Total
All households
Household reporting illness in last 4 weeks
All households
Household reporting hospitalization
All households
Household reporting illness
Quintile
1 2217.0 3587.6 991.8 8388.8 5354.9 7005.3
2 2298.4 3961.6 879.6 10470.2 3566.6 6364.2
3 3802.8 5863.4 947.4 6962.4 5556.3 7902.8
4 3971.1 5863.2 1528.4 11630.1 7296.0 10403.6
5 5345.9 11226.8 1981.3 15798.9 19209.1 30603.1
Concentration Index 0.179 0.229 0.171 0.13 0.316 0.329
Urban 5290.3 9625.9 1520.6 12326.5 16113.2 27414.8
Rural 2959.4 5483.9 1183.6 11211.4 5648.6 9355.8
All 3526.7 6506.0 1265.6 11516.0 8195.5 13813.0
0 5 10 15 20
1 (Poorest)
2 3 4
5 (Richest)
Rural Urban
Quintile Region Total
OOP payments as a % of consumption
expenditure
Outpatient
Inpatient
Total
[image:5.595.56.542.545.719.2]Table 3 Incidence and intensity of catastrophic health expenditure
% of total expenditure
Outpatient Inpatient Total OOP payments
10% 25% 40% 10% 25% 40% 10% 25% 40%
Head count (HC)
1 (Poorest) 18.1 8.2 6.1 6.9 4.4 3.6 23.0 11.3 8.7
2 10.8 4.3 2.4 4.2 2.2 2.1 15.6 7.1 4.5
3 10.7 4.6 2.7 2.6 1.2 0.6 12.9 6.3 4.0
4 9.2 2.5 1.4 4.3 1.3 0.8 14.2 4.7 3.1
5 (Richest) 7.5 2.4 0.9 3.1 0.7 0.4 11.9 4.9 2.9
Total 11.2 4.4 2.7 4.2 2.0 1.5 15.5 6.9 4.6
Weighted total head count 13.3 5.6 3.7 4.9 2.7 2.2 17.6 8.3 5.8
Overshoot
1 (Poorest) 20.0 18.4 17.5 3.5 2.9 2.5 34.5 32.3 31.0
2 3.0 1.9 1.5 1.8 1.4 1.0 6.2 4.6 3.8
3 2.9 1.9 1.4 0.6 0.3 0.2 4.7 3.3 2.6
4 1.5 0.8 0.5 0.7 0.4 0.2 3.9 2.6 2.0
5 (Richest) 1.2 0.5 0.3 0.4 0.1 0.0 6.2 5.0 4.5
Total 5.7 4.7 4.2 1.4 1.0 0.7 11.0 9.5 8.7
Weighted overshoot (Ow) 9.5 8.2 7.6 2.06 1.59 1.35 15.0 13.3 12.4
Concentration Index, C_E −0.184 −0.273 −0.382 −0.156 −0.385 −0.482 −0.137 −0.205 −0.257
Concentration Index, C_O −0.663 −0.765 −0.817 −0.467 −0.580 −0.642 −0.489 −0.543 −0.574
% of non food expenditure
Outpatient Inpatient Total OOP payments
10% 25% 40% 10% 25% 40% 10% 25% 40%
Head count
1 (Poorest) 35.6 22.3 17.0 10.9 9.7 9.3 39.7 26.6 21.1
2 23.0 13.9 9.4 7.6 5.6 4.1 28.3 18.1 12.8
3 22.1 11.5 8.5 4.5 3.3 2.5 24.8 14.2 10.7
4 16.7 7.9 4.9 7.2 3.5 1.9 22.6 12.6 7.7
5 (Richest) 12.0 4.8 2.5 4.8 2.4 0.9 17.9 8.4 4.8
Total 21.9 12.1 8.5 7.0 4.9 3.8 26.7 16.0 11.4
Weighted total head count 26.6 15.7 11.5 8.2 6.4 5.4 31.0 19.7 14.8
Overshoot
1 (Poorest) 37.6 33.8 31.4 12.9 12.0 12.0 89.9 85.5 82.4
2 11.8 9.3 7.7 7.1 7.1 6.3 21.6 18.4 16.2
3 13.8 11.5 10.1 2.3 2.3 1.8 20.7 18.0 16.2
4 5.8 4.2 1.3 2.3 2.3 1.6 10.7 8.2 6.8
5 (Richest) 2.8 1.7 1.2 0.9 0.9 0.5 10.4 8.6 7.6
Total 14.2 11.9 10.6 5.0 5.0 4.4 30.1 27.2 25.4
Weighted overshoot (Ow) 21.1 18.3 16.5 7.5 7.2 6.2 42.0 38.6 36.3
Concentration index, C_E −0.214 −0.300 −0.352 −0.163 −0.311 −0.451 −0.162 −0.233 −0.293
illnesses, although wider inequalities were reported for hospital admissions, reflecting the expensive nature of these services. Higher levels of self reported illnesses among the richest population confirm findings reported elsewhere that the poor are more likely to ‘ignore’ ill-nesses because they cannot afford to seek treatment or to take time off work [27].
Kenyans bear a large burden of OOP payments. Each year, Kenyan households spend close to a tenth of their budget on health care payments. The high levels of OOP payments reflect the health financing system in Kenya, which relies heavily on user fees at the point of service delivery. This financing mechanism does not allow for prepayment, risk pooling and cross-subsidisation. In ab-solute terms, the richest households spend significantly higher amounts of money on treatment compared to the poorest households. When OOP payments are expressed as a percentage of consumption expenditure, findings re-veal a regressive pattern for both outpatient and in-patient illnesses. The poorest households spent five times more of their budget on health care payments compared to the richest population. Poor-rich differ-ences were larger for inpatient compared to outpatient care, indicating that inpatient care is unaffordable to most poor households. High levels of spending among the poor highlight the lack of exemption mechanisms to protect the poor in the Kenyan health sector. The budget share of OOP payments is significantly higher in the urban than in the rural areas, reflecting both differ-ences in socio-economic status and treatment seeking patters. Urban areas have more private providers and larger public health facilities, whose charges are signifi-cantly higher than those locate in rural areas. These findings confirm that OOP payments in low-income countries are very regressive as documented in other set-tings [4,28,29], and highlight the urgent need to protect the poor from high costs of illness.
About 16% and 5% of households incurred health ex-penditure that exceeded 10% and 40% of total household budget respectively. A larger proportion of households incurred catastrophic payments due to outpatient ser-vices compared to inpatient care. About 11% of
households spent over 10% of their budget on outpatient treatment, compared to 4.2% for inpatient care. The in-cidence of catastrophic expenditure at corresponding thresholds is much higher when OOP payments are expressed as a proportion of non-food budget. This in-crease reflects the greater share of resources spent of food items in Kenya, which is typical of spending pat-terns in low-income countries. For total OOP payments, 5.6% of households reported payments greater than 40% of total expenditure; this proportion doubled, when the threshold was set relative to share of non-food expend-iture. Xu et al. estimated catastrophic spending among Kenyan households using data from a similar survey conducted in 2003 [30]. They found that overall 4.1 per cent of households faced catastrophic health expend-iture. About 5.8% and 6.1% of households incurred health care costs over 40% of non-food budget for out-patient and inout-patient services respectively. While it is not always possible to directly compare findings due to methodological differences, results presented in this paper suggest that the burden of OOP payments for in-patient care might be decreasing, while that of out-patient care is on the increase. This downward trend in the proportion of households facing catastrophic costs due to inpatient care should be interpreted with caution. It is known that inpatient care is much more expensive than outpatient and it is possible that households might have failed to seek admission due to affordability barriers (particularly the poor). Also, there is a tendency to over-estimate annual spending on OOP payments when health costs are scaled to annual estimates. The timing of household surveys also has important implications for levels of self reported illness, treatment seeking patterns and cost burdens [5,27].
Kenya has a mandatory national hospital insurance fund (NHIF) for those working in the formal sector. In-formal sector workers can join the NHIF on a voluntary basis. NHIF only caters for costs associated with in-patient care and members have to pay for outin-patient ser-vices through OOP payments. These findings show that that outpatient care can be expensive and highlight the need to include outpatient benefit packages in the NHIF and other existing prepayment arrangements like com-munity based health insurance. Importantly they high-light the urgent need for Kenya to move towards progressive financing mechanisms that offer financial risk protection for the poor.
[image:7.595.57.292.112.214.2]The poverty head count accounting for OOP payments was 54.9%. These findings compare closely with those by the World Bank and the Kenya National Bureau of statis-tics [19,31]. About half 1.48 million Kenyans are pushed below the national poverty line due to OOP payments. The increase in the poverty gap following the change in the poverty line was not only due to individuals falling
Table 4 Poverty head count before and after OOP payments
National poverty line
Gross of health payments
Net of health payments
Poverty headcount 54.9 57.6
Poverty gap 3,937 4952
Normalized poverty gap 26.1 32.8
Normalized mean positive poverty gap
below the poverty line, but also due to poor individuals falling further below the poverty line once health care payments were subtracted from total consumption ex-penditure. This shows that OOP payments are a major barrier of development since push non-poor households and trap those who are already poor in it. The role of OOP payments in household poverty has been recog-nized by many authors [4,15,32]. In Asia, for example, the poverty head count increased by 14% after account-ing for health care payments. An additional 2.7% of the population had income that was less than the inter-national poverty line of US$ 1 per day after they paid for health care [26]. Increases were highest in countries that rely heavily on OOP payments as the source of health care funding. These levels are relatively high compared to those reported in this study since the majority of study households were already living in poverty before incur-ring health care payments. Caution should be taken when interpreting these results for policy. For example, provid-ing financial risk protection for all Kenyans would con-tribute towards poverty reduction. However, it is unlikely that the impact of these policies will be proportionate to the proportion of individuals impoverished by health care costs as estimated in this paper.
Limitations
The findings of this study should be interpreted in the context of some limitations. First, data presented are from a cross-sectional household survey. Longitudinal approaches are most suited to capture impacts OOP payments on household living standards. It is however difficult to study a large number of households longitu-dinally and national representative data that are available are only from cross-sectional surveys. Secondly, the ap-proach assumes that costs are spread evenly over a year. Households might experience peak costs in one month which might have significant implications on their bud-gets [14]. Thirdly, it has been shown that lost earnings are sometimes more catastrophic than actual payment [6]. Fourthly, estimates of catastrophic health expend-iture do not capture individuals who do not seek care due to various barriers. Failing to capture the poorest of the poor could lead to underestimation of the incidence and intensity of catastrophic payments and impoverish-ment. Finally, poverty levels in Kenya differ between rural and urban areas. It is possible that the majority of households pushed and trapped into poverty due to OOP payments are mainly from rural areas. Regardless of these limitations, important policy lessons can be drawn from the findings presented in this paper.
Conclusions
It is very clear that the burden of OOP payments is high, Kenyans are becoming poor and many more are being
trapped into poverty due to health care payments. The Kenyan government should urgently consider alternative health financing mechanisms that offer financial risk protection to the population. Such approaches, as clearly stated in the WHO 2010 report should encourage risk pooling and income cross-subsidization [33]. Discus-sions on how best to offer financial risk protection to Kenyans have ongoing for close to a decade now. The results presented in this paper show the urgent need for Kenya to move beyond discussions and implement reforms that will protect the population from health care related impoverishment.
Competing interests
The authors declare that they have no competing interests.
Authors’contribution
JC was responsible for the overall design of the study. JC and TM were involved in data analysis and writing. Both authors read and approved the manuscript.
Acknowledgements
JC is supported by the Wellcome Trust, United Kingdom as a Research Training Fellow (# 084516). This paper is published with the permission of the director KEMRI.
Author details
1Kenya Medical Research Institute (KEMRI)-Wellcome Trust Research Programme, Nairobi, Kenya.2Centre for Tropical Medicine, Nuffield Department of Clinical Medicine, University of Oxford, Oxford, United Kingdom.3Ministry of Medical Services, Nairobi, Kenya.
Received: 27 September 2011 Accepted: 16 November 2012 Published: 21 November 2012
References
1. World Health Organisation:Sustainable health financing, universal coverage and social health insurance. Geneva: World Health Organisation; 2005. In EB115R13.
2. World Health Organisation:Sustainable health financing, universal coverage and social health insurance In 58th World Health Assembly. Geneva: World Health Organisation; 2005.
3. Xu K, Evans DB, Carrin G, Aguilar-Rivera AM, Musgrove P, Evans T:
Protecting households from catastrophic health spending.Health Aff (Millwood)2007,26:972–983.
4. Xu K, Evans DB, Kawabata K, Zeramdini R, Klavus J, Murray CJ:Household catastrophic health expenditure: a multicountry analysis.Lancet2003,
362:111–117.
5. Chuma J, Gilson L, Molyneux C:Treatment-seeking behaviour, cost burdens and coping strategies among rural and urban households in Coastal Kenya: an equity analysis.Trop Med Int Health2007,12:673–686. 6. Russell S:The economic burden of illness for households in developing countries: a review of studies focusing on malaria, tuberculosis, and human immunodeficiency virus/acquired immunodeficiency syndrome.
AmJTrop Med Hyg2004,71:147–155.
7. Wagstaff A, van Doorslaer E:Catastrophe and impoverishment in paying for health care: with applications to Vietnam 1993–1998.Health Econ
2003,12:921–934.
8. Pradhan M, Prescott N:Social risk management options for medical care in Indonesia.Health Econ2002,11:431–446.
9. Berki SE:A look at catastrophic medical expenses and the poor.Health Aff (Millwood)1986,5:138–145.
10. Xu K, Evans DB, Kadama P, Nabyonga J, Ogwal PO, Nabukhonzo P, Aguilar AM:Understanding the impact of eliminating user fees: utilization and catastrophic health expenditures in Uganda.Soc Sci Med2006,
11. O’Donnell O, van Doorslaer E, Wagstaff A, Lindelow M:Analyzing health equity using household survey data: A guide to techniques and their implementation. Washington, D.C: The World Bank; 2008.
12. Preker A, Langenbrunner J, Jakab M:Rich-poor differences in health care financing. InSocial Re-insurance-A new approach to sustainable community health care financing. Edited by Dro D, Preker A. Washington: World Bank; 2002.
13. Russell S:Ability to pay for health care: concepts and evidence.Health Policy Plan1996,11:219–237.
14. Chuma JM, Thiede M, Molyneux CS:Rethinking the economic costs of malaria at the household level: evidence from applying a new analytical framework in rural Kenya.Malar J2006,5:76.
15. van Doorslaer E, O’Donnell O, Rannan-Eliya RP, Somanathan A, Adhikari SR, Garg CC, Harbianto D, Herrin AN, Huq MN, Ibragimova S,et al:Effect of payments for health care on poverty estimates in 11 countries in Asia: an analysis of household survey data.Lancet2006,368:1357–1364. 16. Su TT, Kouyate B, Flessa S:Catastrophic household expenditure for health
care in a low-income society: a study from Nouna District.Burkina Faso Bull World Health Organ2006,84:21–27.
17. Onoka CA, Onwujekwe OE, Hanson K, Uzochukwu BS:Examining catastrophic health expenditures at variable thresholds using household consumption expenditure diaries.Trop Med Int Health2011,14:1334–1341. 18. Onwujekwe O, Hanson K, Uzochukwu B, Ichoku H, Ike E, Onwughalu B:Are
malaria treatment expenditures catastrophic to different socio-economic and geographic groups and how do they cope with payment? A study in southeast Nigeria.Trop Med Int Health2010,15:18–25.
19. International Monetary Fund:Poverty reduction strategy paper-progress report. Kenya: International Monetary Fund; 2012.
20. Mukui J:Poverty analysis in Kenya: Ten years on. Sweden: Central Bureau of Statistics, Society for International Development,Swedish International Development Agency; 2005.
21. Chuma J, Okungu V:Viewing the Kenyan health system through an equity lens: implications for universal coverage.Int J Equity Health2011,
10:22.
22. Government of Kenya, Health Systems 2020 Project:Kenya national health accounts 2005/2006. Bethesda, MD: Health Systems 20/20 project, Abt Associates Inc; 2009.
23. Ministry of Medical services, Ministry of public Health:Kenya national health accounts 2009/10. Government of Kenya, Nairobi: Health Systems 2020; 2012. 24. Kakwani C, Wagstaff A, van Doorslaer E:Socioeconomic inequalities in
health: measurement, computation and statistical inference.J Econ1997,
77:87–104.
25. Wagstaff A, Van Doorslaer E:Catastrophe and impoverishment in paying for health care: with applications to Vietnam 1993–98.Heal Econ2003,
12:921–934.
26. van Doorslaer E, O'Donnell O, Rannan-Eliya RP, Somanathan A, Adhikari SR, Garg CC, Harbianto D, Herrin AN, Huq MN, Ibragimova S,et al:Catastrophic payments for health care in Asia.Health Econ2007,16:1159–1184. 27. Sauerborn R, Nougtara A, Hien M, Diesfeld HJ:Seasonal variations of
household costs of illness in Burkina Faso.Soc Sci Med1996,43:281–290. 28. McIntyre D, Thiede M, Dahlgren G, Whitehead M:What are the economic consequences for households of illness and of paying for health care in low- and middle-income country contexts?Soc Sci Med2006,62:858–865. 29. Meessen B, Van Damme W, Tashobya CK, Tibouti A:Poverty and user fees
for public health care in low-income countries: lessons from Uganda and Cambodia.Lancet2006,368:2253–2257.
30. Xu H, James C, Carrin G, Muchiri S:An empirical model of access to health care, health care expenditure and impoverishment in Kenya: learning from past reforms and lessons for the future. Geneva: World Health Organization; 2005. 31. Development MfPaN:Kenya intergrated household budget survey 2005/06.
Basi report. Kenya: Ministry for Planning and National Development; 2008. 32. Whitehead M, Dahlgren G, Evans T:Equity and health sector reforms: can
low-income countries escape the medical poverty trap?Lancet2001,
358:833–836.
33. World Health Organisation:The world health report: health systems financing: the path to universal coverage. Geneva: World Health Organisation; 2010.
doi:10.1186/1472-6963-12-413
Cite this article as:Chuma and Maina:Catastrophic health care spending and impoverishment in Kenya.BMC Health Services Research 201212:413.
Submit your next manuscript to BioMed Central and take full advantage of:
• Convenient online submission
• Thorough peer review
• No space constraints or color figure charges
• Immediate publication on acceptance
• Inclusion in PubMed, CAS, Scopus and Google Scholar
• Research which is freely available for redistribution