Theses Thesis/Dissertation Collections
9-1-2011
Kansei Engineering and cultural differences in
mobile phone design
Loni Watson
Follow this and additional works at:http://scholarworks.rit.edu/theses
This Thesis is brought to you for free and open access by the Thesis/Dissertation Collections at RIT Scholar Works. It has been accepted for inclusion in Theses by an authorized administrator of RIT Scholar Works. For more information, please [email protected].
Recommended Citation
Rochester Institute of Technology
College of Liberal Arts
Department of Psychology
KANSEI ENGINEERING AND CULTURAL DIFFERENCES IN MOBILE PHONE DESIGN
By
Loni M. Watson
A Thesis in
Applied Experimental and Engineering Psychology
Submitted in partial fulfillment of the requirements for the degree of
Master of Science
ii
We approve the thesis of Loni M. Watson:
___________________________________________ _____________________
Esa M. Rantanen, Ph.D. Date
Associate Professor, Dept. of Psychology, RIT
Faculty Adviser and Chair of the Thesis Committee
___________________________________________ _____________________
Matthew Marshall, Ph.D. Date
Associate Professor, Dept. of Industrial Engineering, RIT
Reader
___________________________________________ _____________________
Stanley H. Caplan, CHFP Date
Human Factors Principal and President, Usability Associates LLC
iii
Acknowledgments
Words cannot begin to describe how grateful I am for my parents, Basil and Alene
Watson. They have always believed in me and supported me on this quest to take product
development to the next level, and for that, I am forever indebted to them. Love you, guys! To
the rest of my family whose encouragement and unbounded support (and care packages) helped
me through graduate school, thank you. I am heartily thankful for my advisor, Dr. Esa M.
Rantanen, whose motivation and supervision took this research from a simple idea to a
full-fledged study. My committee members, Dr. Matthew Marshall and Mr. Stanley H. Caplan, also
assisted me in the process of developing an understanding in the field of Kansei Engineering, and
iv
Abstract
Kansei Engineering, a Japanese design method used to translate feelings into product
parameters, was used to look at the mobile phone design features of the Motorola Charm,
Samsung t249, and HTC HD7 in the United States. Preferences of four design features (shape,
material, LCD screen size, and navigation tools) were explored in a sample population of
twenty-five university students in a private Northeastern university. Six kanseis/feelings elicited by
phones were determined to be important to this group: (1) Attractive, (2) Cool, (3) Durable, (4)
Ergonomic, (5) Modern, and (6) User-friendly. A (generic) phone with a rectangular shape,
comprised mostly of metal-like and glass material, with a large LCD screen and navigation via a
touchpad was determined to be the most ideal and strongly perceived to elicit many of these
kanseis. After exploring the cultural sub-groups of this sample, it was determined that there are
significant cultural group differences between Chinese participants and both American and
Indian participants, mainly when considering the durability (p=.008) and coolness (p=.034) of
v
Table of Contents
Acknowledgments... iii
Table of Contents ... v
List of Figures ... vii
List of Tables ... viii
Introduction ... 1
Design Criterion: Affect ... 2
Kansei Engineering ... 5
KE Type II Engineering Process... 6
Cultural Differences ... 9
Purpose of the Research and Thesis... 15
Hypothesis... 16
Method ... 16
Participants ... 16
Materials ... 16
Demographic and background questionnaire... 17
Individual Cultural Value Scale (CVSCALE). ... 17
Semantic space and product element space questionnaire. ... 18
Demographic questionnaire #2. ... 19
Semantic differential (SD) scale questionnaire. ... 19
Phones ... 19
Experimental Design ... 19
vi
Analyses ... 23
Results ... 24
Attractive... 27
Cool ... 27
Durable ... 28
User-friendly ... 31
Likeability ... 32
Discussion ... 34
Limitations ... 35
Conclusion ... 38
References ... 39
Appendix A: Informed Consent Form ... 42
Appendix B: Demographic and Mobile Device Questionnaire ... 47
Appendix C: Individual Cultural Values Scale (CVSCALE) ... 48
Appendix D: Phone Feature and Descriptive Word Selection... 50
Appendix E: Demographic Questionnaire #2 & Semantic Differential (SD) Scale ... 51
Appendix F: Moderator Guide ... 58
Appendix G: Debriefing Form ... 59
Appendix H: Email Used To Solicit Participants ... 60
Appendix I: Semantic Space ... 61
Appendix J: Product Element Space ... 62
Appendix K: R-code Used in Data Analysis ... 63
vii
List of Figures
Figure 1 ... 8
Figure 2.. ... 22
Figure 3. ... 27
Figure 4. ... 28
Figure 5. ... 29
Figure 6. ... 30
Figure 7. ... 30
Figure 8. ... 31
Figure 9. ... 32
viii
List of Tables
Table 1 ... 12
Table 2 ... 22
Table 3 ... 24
Table 4 ... 25
Table 5 ... 65
Table 6 ... 66
Table 7 ... 67
Table 8 ... 68
Table 9 ... 69
Table 10 ... 70
Table 11 ... 71
Table 12 ... 72
Table 13 ... 73
Introduction
User analysis is an integral and critical part of the product development lifecycle. The
product development lifecycle refers to the process that a concept goes through to get developed
into a tangible product and introduced to a particular market. There are numerous design models
which specify a sequence of steps for analysis, design, and production of a product. Product
design models are all relatively similar in that they include stages reflecting: (1) front-end
analysis activities (characterizing functions of interest and the level of interactivity required by
users, determining the value-add of the functions and drivers of the value-add, and examine the
drivers to determine if functions are appropriately positioned for the intended users), (2) design
of the product, (3) production, and (4) user testing and evaluation (Rouse, 1991). During this
process it is important to have an early focus on the user and tasks, obtain feedback through
empirical measurement, go through iterative designs using prototypes, and involve users in the
design process (Rouse, 1991).
One such model is the Usability Engineering Lifecycle which is a unique and highly
effective structured methodology for achieving good usability during the development of
products across a variety of platforms (e.g., software applications, websites, hardware, etc.).
There are three phases in development that are reflected in the Usability Engineering Lifecycle
(Mayhew, 1999): (1) Requirements Analysis, (2) Design/Testing/Development, and (3)
Installation. In phase one, there are five areas that need to be defined in order to move forward in
the lifecycle: (1) user profile, (2) contextual task analysis, (3) usability goal setting, (4) platform
capabilities/constraints, and (5) usability goals. Phase two is split into three levels. Level one
deals with high-level design issues, level two deals with setting standards, and the third level
points to gathering user feedback after the product has been produced and made available to
users. Feedback at this stage is used to enhance the product‘s existing design or later releases and
aid in the design of new, related products.
The main goal in product development is to successfully implement a user-centered
design which enhances human abilities, overcomes their limitations, and builds user acceptance
by taking into account the variations found in target users. In order to achieve such a design, the
user‘s needs, wants/preferences, and biases all need to be considered at each stage in the design
process.
Design Criterion: Affect
Many researchers have supported the argument that affect is an important design
criterion, after functionality and usability have been satisfied. Koehler & Harvey (2004) made a
case for affect in decision-making processes; their idea was that emotional processing occurs
very quickly when interacting with products. Products that are meaningful, interesting, or
important to the decision-maker aid in more efficient and thorough processing when choosing a
product. Consumers are able to better able to make better product-choice decisions and are less
confused by complexity, if the conditions are conducive of positive affect. Lee‘s (2007)
argument that affect plays a critical role in cognition and in human interaction with technology
stems from the idea that basic emotions occur in all cultures and there are many different
emotions which contribute to behavior. These emotional reactions serve as reflective cues that
are related to some past experience and can, in-turn, affect how one views a product.
Jordan (2000) pointedly argued that, similar to Maslow‘s hierarchy of needs, there is a
pyramid of consumer needs (in a product), which consists of three levels. Functionality, at the
desire is that the product fulfills its purpose and performs at the desired level. Without
functionality, the other design criteria do not matter. Usability, the second level, refers to the
ease-of-use and learnability of the product. Once consumers have acquired the appropriate
functionality in a product, they then want products that allow for simple and intuitive interaction.
The peak of the pyramid, pleasure, is defined as the consciousness or sensation induced by the
enjoyment or anticipation of what is felt or viewed as good or desirable (Jordan, 2000). Here,
consumers want something extra; not only the functional benefits of a product, but also
emotional ones. As soon as they are able to achieve the needs at the base of the hierarchy, the
desire to fulfill those higher up becomes of interest as obtaining all three needs give off a sense
of fulfillment and satisfaction with the product.
Norman (1990) noted that a well-designed product is one with a good conceptual model.
A good conceptual model allows us to better understand objects and predict the effects of our
actions. He stated that in order for users to form a good conceptual model about a device, it must
have: (1) good visibility, (2) object affordances, (3) constraints that help to guide appropriate
actions, (4) proper mapping, and (5) feedback for actions completed. All of these speak to the
functionality and usability of the product. Norman has also argued that designers now need to
consider the emotional appeal of objects through design as functionality, the most important
feature, is no longer the only requirement for products (Norman, 2004). In the early days of a
product‘s introduction to society, when users may experience some difficulty learning and
getting adjusted to the product, then functionality is a key component. However, once a product
has long been established, consumers tend to take functionality for granted (as it is expected to
function appropriately) and instead turn to emotional appeal when selecting between similar
Norman (2004) proposed that three design methods, (1) visceral, (2) behavioral, and (3)
reflective must collaborate to ensure an overall good design. Visceral design, used to forge a link
between the consumer and the product, relates to the appearance of the product and it influences
the consumer‘s initial reaction. Behavioral design deals with performance and effectiveness of
use. There are four components to good behavioral design: (1) function (―What purpose does this
product serve?‖), (2) understandability (―How does the product work?‖), (3) usability (―Can I
use this product effectively?‖), and (4) physical feel (―How does this product impact my sensory
system?‖) (Norman, 2004). Reflective design is concerned with the meaning of the product,
memories, self-image, and personal satisfaction. This type of design is often a part of people's
long-term relationship with a product and can be enhanced by cultural conditioning.
Norman (2004) also suggested that attractive things work better because aesthetics
influence emotions, which influence the way human mind solves problems. In the
decision-making process, positive emotions broaden thought processes and are critical to learning,
curiosity, and creativity while negative emotions cause anxiousness and narrow thought
processes. When people experience negative emotions, they tend to concentrate on things
directly related to the problem and focus on the details by going deeper into the issue until it is
resolved. While this tactic may prove to be helpful in situations where survival is related to the
issue or when one needs to transform ideas into tangible deliverables through concentration and
focus, it tends to frustrate users in other situations when interacting with products in a casual
environment. When users experience positive emotions, they tend to focus on the ―big picture‖
(as opposed to the details) and the brain is more receptive to distractions that can facilitate new
ideas or approaches. Also, someone who is happy is more likely to overlook or cope with minor
For optimal success in product development, functional and emotional considerations
should collaborate to ensure an overall good design (Jordan, 2000; Norman, 2004). This requires
the implementation of a suitable tool, which can identify subjective feelings about a product and
translate them into concrete design parameters, within a company‘s product development
process. An existing method, Kansei Engineering, has been used in this manner to evaluate the
emotional appeal of products during the development stage.
Kansei Engineering
Kansei Engineering (KE) was originated at Hiroshima University by Mitsuo Nagamachi
in the 1970‘s. Nagamachi (1995) defined this concept as a Japanese word that means customer's
feeling and includes the customer's feeling about the product design, size, color, and other
distinguishing attributes. As a follow up, KE was defined as an efficient method for rendering
the customer feelings into the product design elements (Matsubara & Nagamachi, 1997). As a
sub-design method in Affective Engineering, by which the developer translates feeling and
emotions into product dimensions, it provides a way to give measurable values to features of
different products. Also, it takes the focus away from the developer‘s intentions of the product,
and gives suggestions from the potential user‘s psychological feelings which help to develop a
good user experience. The development of this design method came from a need to appeal to the
emotional influences that a customer might experience when selecting an already functional
product; that is, finding out which design elements arouse particular feelings in the user, and
then, incorporating those features into the product to achieve a specific response.
There are three styles of KE: (1) Type I, Category Classification, (2) Type II, KE
Computer System, and (3) Type III, KE Modeling. Category Classification is a method in which
1995). In Category Classification, a zero-level concept (which is the propositional value of the
product) is defined. To determine the design specification details, this higher-level concept is
broken down into meaningful, related sub-concepts. Physical traits of the product and kansei
words are developed and translated into tangible designs. KE Type II is a computer-assisted
system. Kansei Engineering System (KES) is a computerized system with the expert system to
transfer the consumer's feeling and image to the design details. The KES architecture has four
databases: (1) kansei database contains all of the words related to consumer feelings which are
representative of the product, (2) image database contains the contributory items in the design
details to a specific kansei word, (3) knowledge-base contains the rules needed to decide the
highly correlated items of the design details with the kansei words, and (4) design and color
database contains the design details with color separated (Nagamachi, 1995). These four
databases are populated with information that comes from the kansei process, which is described
below. With KE Modeling, a mathematical model is constructed, without the concern of the rules
that were established to determine relatedness of the kansei word and design element, to obtain
the ergonomic outcome (Nagamachi, 1995).
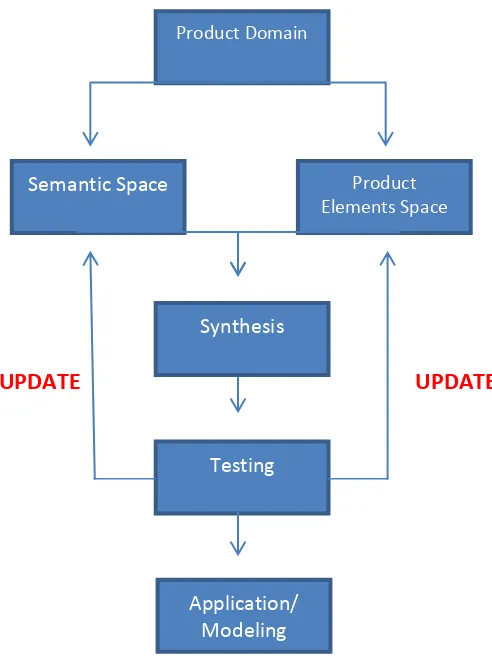
KE Type II Engineering Process
The first step in the process is to define the Product Domain, which is the assembly of
products to be researched. This includes defining the target group/population of interest, and the
product in question. Nagamachi (2002) utilized ―young drivers‖ in a study on the Mazda Miata
sports car and ―ladies aged in the 20‘s and 30‘s at hair salons‖ for a study on Milbon hair-care
products because these particular populations are the ones who use the product currently or will
In order to determine the semantic space, the next step in the KE process, the adjectives
used to describe the product are collected through research on the product. This can be done by
getting feedback from the target group by asking them to use words to describe specific elements
associated with the product. During this process, related words are eliminated so that the number
of words used is controlled. Similar adjectives are clustered into higher level groups using either
a manual or statistical method and kansei words are then formed. These higher level groups are
used to form word pairs with opposite words. Words like ―sporty vs. non-sporty‖, ―clean-looking
vs. cluttered‖ and ―luxurious vs. non-luxurious‖ may be determined as kansei words for a car
speedometer (Jindo & Hirasago, 1997).
Properties that are most important to the users are defined in the product elements space.
Products that are represented in the particular domain are collected and key components are
identified. To select which components of the product are important, a Pareto-diagram is used to
highlight these features, as expressed by the users. For a car speedometer, these key components
can be the meter layout, meter types (speedometer, tachometer, fuel level gauge, water level
gauge, etc.), panel color and material (plastic, wood, leather), meter shape (round, semicircular,
quarter, oval), inside vs. outside scale, needle starting point, scale type, number orientation
(horizontal, centrifugal), lettering and indicator shape (Jindo & Hirasago, 1997).
In the synthesis stage, a semantic differential (SD) scale is used to determine the level of
relatedness between a particular adjective (semantic space) and product component (product
elements space). The relationship between the semantic and the product elements spaces is
established by using statistical tool(s). Jindo & Hirasago (1997) found that when considering the
(meter shape), 3-points (scale type), and yellow (indicator color) scored the highest in their
relevant categories.
Based on the results of this research, a model is then proposed and tested for validation. If
successful, then the kansei model can be applied to the product domain. For a particular kansei
word, the model should be able to identify the properties that are important and the design
element parameters associated with that word. If the model is found to be unsuccessful, the
semantic and product elements spaces should be updated until the model is able to yield reliable
[image:17.612.163.409.318.646.2]results (Figure 1).
Figure 1. A framework for the Kansei Engineering process (Ying & Yan, 2006) Product Domain
Semantic Space Product
Elements Space
Synthesis
Testing
UPDATE UPDATE
There are two applications of the KES: (1) consumer-supporting KES, and (2)
designer-supporting KES. Both function similarly in that each application provides the user with design
feature results. With the consumer-supporting KES, it is a personal-use product with which
consumers can directly interact. Kansei words are entered into the system by the user, which are
indicative of the feeling the consumer wants from a product. The system is designed to
understand what the user wants in a product and outputs the final designs which match these
desires. With the designer-supporting KES, the system behaves similarly and it is typically used
to aid a designer when creating a new product. The difference, here, is that outputs can be
changed in shape design and color if the displayed images are different from the designer‘s
image.
So far, KE has been introduced to multiple industries including automotive, construction
machinery, electric home appliance, office machinery, house construction, costume, and
cosmetic (Nagamachi, 2002). Application to mobile and entertainment devices have also been
more recently explored (Lai, Lin, Yeh, & Wei, 2006; Chen, Chiu, & Lin, 2007; Roy, Goatman,
& Khangura, 2009). These studies sought to find the emotional elements that are important to
consumers. Moreover, they were able to determine which factors influence consumer‘s
impressions and which emotional tags were associated with each design elements.
Cultural Differences
Culture is often underestimated when it comes to interface design. KE has been studied
extensively in Japan and used in the design of products for the Japanese market. While the
method has been demonstrated successfully within the very homogenous Japanese culture, there
are cultural issues that arise when the method is applied in other countries, for example, in the
affect the user‘s product-purchase decisions and also, in an effort to reduce costs, some
companies will opt to use a standard design (with minor design adjustments) to be used in all
markets in different countries. This issue highlights the need for gaining a deeper understanding
of target cultures and defining different methods which can be used to promote
culturally-oriented product innovation.
Hofstede (1980) described culture as multi-defined construct whose definition relies
explicitly on the context in which it is being held. He considered the national differences of
employees in the organizational setting in the different parts of the world, in an attempt to find
aspects of culture that might influence business behavior. Culture was also described as a
collectable programming of the mind which distinguishes the members of one human group from
another (Hofstede, 1980). For the purposes of this study, we will define culture as that which
encompasses the collective characteristics found in groups and which distinguishes one set of
people from other sets when making product-selection decisions. The concern of this study is not
to finalize a definition for culture, but to ensure that it was understood that there are differences
that can be determined in how different groups make decisions.
Hofstede (1980) accounted culture to a combination of five bi-polar dimensions: (1)
power distance, (2) individualism-collectivism, (3) masculinity-femininity, (4) uncertainty
avoidance, and (5) long-term-short-term orientation. Power distance (PD) describes the degree to
which a culture believes how institutional and organizational power should be distributed
(whether equally or unequally) and how those decisions should be viewed (whether accepted or
challenged). People in high distance cultures are more comfortable with a larger status
differential than those who belong to a low distance culture. Individualism vs. collectivism
However, it is important to note that individualism and collectivism are not ―give-and-take‖
constructs. A culture can be high in both or low in both. Also, a strong negative correlation was
found between a culture‘s scores on power distance and individualism-collectivism. High power
distance cultures tend to be more collectivistic, while low power distance cultures tend to be
more individualistic. Masculinity-femininity (MAS) refers to the degree which a culture values
such behaviors as assertiveness, achievement, acquisition of wealth (masculine) or caring for
others, social supports and the quality of life (feminine).Uncertainty avoidance (UA) relates to
the extent which a culture feels threatened by ambiguous, uncertain situations and tries to avoid
them by establishing more structure. Cultures with low uncertainty avoidance believe in
accepting dissenting views among cultural members and taking risks and trying new things
unlike their high uncertainty avoidance counterparts. Lastly, long-term orientation (LTO) relates
to adopting virtues that are focused on future rewards, while short-term orientation is concerned
with the virtues related to the past and present. These elements are thought to be universal
constructs that make up the framework that aids in understanding how cultural values will
influence decision-making.
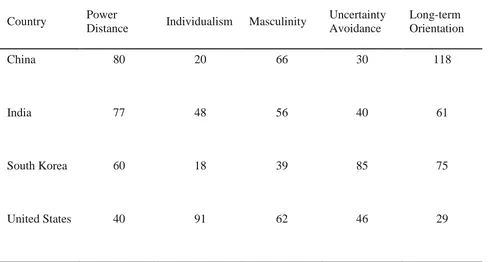
Hofstede‘s model has been used to explain variations in the concepts of self, outlook and
how people identity themselves—all of which explain the differences seen in consumer behavior.
The model shows that China (IDV= 20), India (IDV = 48), and Korea (IDV=18) are low on
individualism, while the United States ranks high (IDV= 91). With power distance (PDI), China,
India, Korea and the United States are rated 80, 77, 60, and 40, relatively. China (MAS= 66),
India (MAS= 56), and the United States (MAS= 62) fall in the middle of the masculinity scale,
while Koreans tend to be on the lower end (MAS=39). On the uncertainty avoidance (UAI),
With long-term orientation (LTO), China scored 118, India scored 61, Korea scored 75 and the
United States scored 29. China is strongest in long-term orientation, India in power distance,
Korea in uncertainty avoidance, and individualism for the U.S. These scores indicate that there
[image:21.612.65.553.272.534.2]are differences in the four aforementioned countries‘ cultural values (Table 1).
Table 1
Country Scores on Hofstede’s Cultural Dimensions Model
Country Power
Distance Individualism Masculinity
Uncertainty Avoidance
Long-term Orientation
China 80 20 66 30 118
India 77 48 56 40 61
South Korea 60 18 39 85 75
United States 40 91 62 46 29
Lodge (2007) highlighted how these five dimensions are relatable to user interface and
web design. Power distance can be represented in how users access information, user mental
models, and value given to authoritative/official symbols. The individualism dimension can be
influenced by interfaces that reflect personal achievement, sense of morality, and change.
Masculinity can be represented in design elements that speak to gender, family or age traditional
societies, performance and achievement are important and achievement must be demonstrated,
so status brands or expensive products are important to show one‘s success (De Mooij &
Hofstede, 2010). More feminine cultures tend to mask this distinction from the product interface.
Clear metaphors and components, use of color and typography to emphasize information all
speak to uncertainty avoidance. Also, some design components will use relationships (LTO) and
design features that focus on truthful content and rules (short-term orientation) as a basis for
information and to establish credibility and practical value (Lodge, 2007).
Desmet & Hekkert (2007) showed that in earlier studies, security, challenge, personal
life values and emotional responses elicited by automotive designs were found to be related.
They argued that there is an existing relationship between the user‘s product experience and their
values in the context of cultural studies, because implicit and explicit values are often seen as
key determinants of culture (Desmet & Hekkert, 2007). ―Culturability‖ was used by Barber &
Badre (1998) to define the importance of the relationship between culture and usability. They
noted that sound, architecture, geography, flags, mode of dress, signs, customs, language, and
currency contribute to the one‘s awareness of being in an unfamiliar place. Similarly, colors,
spatial organization, fonts, shapes, icons and metaphors, geography, language, sounds, and
motion contribute to the design and content of a web page, which directly affects the way that a
user interacts with the site. Misunderstanding of these components can lead to frustration when
users need to accomplish tasks easily and efficiently.
Mobile Devices
The mobile computing and communication industry is a domain that is experiencing
explosive growth that will continue into the near future. Mobile device technology has evolved
are likely to be five billion mobile device subscriptions in 2010 (Cnet, 2010). The features found
in mobile devices are being rapidly developed and refined to meet the ever-increasing demands
of users. From video cameras to full web browsing capabilities, slim and convenient designs to
different interaction methods, these features are coming to better suit the needs and preferences
of different users.
A recent survey reported that 43% of Indian consumers consider the brand when making
a decision to purchase a mobile phone (iPhoneMagazine, 2010). These consumers consider brand
as the main influential factor. For the Chinese consumer, the 2010 Chinese Consumer Report
noted that personal style and fashion are important. More and more Chinese consumers are
placing emphasis on keeping up with the trends and about 50% of them consider a product's style
to be more important than its function. According to the study, more than a quarter of consumers
across all cities purchase new phones simply because they feel that their current phone is no
longer in style (Roland Berger Strategy Consultants, 2010).
A Nokia report (Ketala & Röykkee, n.d.), related that the technical components that make
up the mobile device can be divided into two categories: the user interface and external interface.
The external interface is the interface that helps to use the device but is not physically part of it.
It is formed from user support elements, accessories, PC connectivity and add-on software. The
user interface category includes input/output devices and techniques, industrial and mechanical
design and application factors (Ketala & Röykkee, n.d.). This study focused on the external user
interface. The input tool is usually a keypad/keyboard (hard or touchscreen), and sometimes,
camera and voice recognition. Also, navigation tools such as the back, home, and end call
buttons are also used for input. Output tools include speakers and visual display screen. The
Purpose of the Research and Thesis
The goals of this study were to (1) implement the KE process and examine how it
influences mobile phone designs, and (2) explore the role that cultural differences play in the
perception of the relationship between mobile phone design mobile phone design features and
the desired kansei.
The premises for this research may be summarized as follows:
(P1) User analysis is an integral and critical part of the product development lifecycle (Rouse,
1991; Mayhew, 1999).
(P2) Affect is an important design criterion, after functionality and usability have been
satisfied (Jordan, 2000; Koehler & Harvey, 2004; Norman, 2004; Lee, 2007).
(P3) KE is a formal method/technique used to capture affect and translate emotions and
impressions into product parameters (Nagamachi, 1995; Jindo & Hirasago, 1997;
Matsubara & Nagamachi, 1997; Nagamachi, 2002).
(P4) KE has predominantly been used in culturally homogenous environments (e.g., Japan).
(P5) There are large cultural differences in affect and emotions towards and in impressions of
products (Hofstede, 1980; Barber & Badre, 1998; Desmet & Hekkert, 2007; Lodge, 2007;
De Mooij & Hofstede, 2010).
(P6) Mobile computing and communication devices (e.g., so-called smart phones) is a domain
that will experience explosive growth in the near future (Cnet, 2010).
Therefore, it is important to investigate how sensitive the KE method is to cultural differences,
particularly in the domain of mobile phones, and whether the results of the KE process
Hypothesis. The primary hypothesis tested may be stated as follows:
(H0) There will be no differences between cultural groups when evaluating mobile phone
design features with kansei words.
(H1) There will be significant differences between cultural groups when evaluating mobile
phone design features with kansei words.
Method
Participants
Research participants included a convenience sample of 25 college students (10 males, 15
females), who interacted with mobile devices regularly and attended Rochester Institute of
Technology in Rochester, New York. Participant ages ranged from 18 to 30. As the cultural
backgrounds of RIT students are diverse, American, Chinese, Indian and Korean students were
recruited from various student organizations related to ethnic-identification (i.e., Asian Culture
Club, Baha‘i Student Association, Chinese Student Scholar Association, Organization for the
Alliance of Students from the Indian Subcontinent, etc.). However, the majority of participants
were recruited via a school-wide distribution email list. The range of years in the U.S. for
American, Chinese, Indian, and Koreans participants were 18 to 26, 0.5 to 18, 0.5 to 8, and 1.5 to
11, respectively.
Materials
Two survey instruments were used in this study. The first survey was used to capture data
on demographics (demographic and background questionnaire), cultural identity (Individual
Cultural Value Scale), descriptive words for mobile phones, and mobile phone feature
used to capture data on extended demographics (demographic questionnaire #2) and kansei level
for various phone features (semantic differential scale questionnaire). These surveys allowed for
the collection of information used to go through the KE process.
Demographic and background questionnaire. The first part of the first instrument
asked questions related to the participant‘s personal experiences with purchasing mobile devices,
such as ―When deciding to purchase a phone, what do you consider?‖ and contained
demographic questions concerning the gender, age, and self-identified cultural-affiliation of the
participant (Appendix B).
Individual Cultural Value Scale (CVSCALE). Hofstede‘s metric has been used to study behavior in a variety of fields. Since then, it has been scrutinized for trying to assess
culture on a micro-, or individual level when Hofstede (1980) intended the dimensions to relate
to a macro-, or nationalistic level (Bakir, Blodgett, Vitell, & Rose, 2000; Yoo, Donthu, &
Lenartowicz, 2010). Since culture is defined at this higher level, individual-cultural consistency
needs to be taken into consideration. As such, researchers have strived to design different scales
that were used to explore cultural value at the individual level- consumer perception on
antismoking websites, ethical norms, market segmentation, negotiation behavior, personality and
transformational leadership, consumer moral ideologies, package design, and consumer
ethnocentrism (Yoo, Donthu, & Lenartowicz, 2010).
The Individual Cultural Values Scale (CVSCALE) (Yoo et al., 2010) was designed to
measure Hofstede‘s (1980) five dimensions of culture (Power Distance, Individualism,
Masculinity, Uncertainty Avoidance, and Long-Term Orientation) at the individual level.
Modified items were chosen from HERMES (Hofstede‘s original survey), the Values Survey
from Hofstede, the Chinese Culture Connection, and non-Hofstede efforts (Yoo et al., 2010). On
the scale, there are twenty-six items in which the participant must rate how closely related their
attitudes are to the choices given for particular questions on a 5-point Likert scale. Selecting ―1‖
represents attitudes that are not likely of the person and selecting a choice from the higher end of
the rating scale represents attitudes that are very likely of the person. Higher scores indicate a
higher level of adherence to the particular cultural value. The sub-scales that measure the
collectivism, uncertainty avoidance, masculinity, power distance, and long-term orientation
values, yield Cronbach alpha reliabilities of 83, .88, .86, .86, and .82, respectively (Yoo et al.,
2010).
Those possessing cultural values of the Chinese culture are expected to obtain high scores
on the Power Distance and Long-term Orientation scales, and lower scores on the Individualism
and Uncertainty Avoidance scales. Participants who self-identify as Indians are expected to
achieve high scores on Power Distance and low scores on Uncertainty Avoidance. American
self-identifiers are expected to achieve high scores on the Individualism scale and low scores on
Power Distance and Long-term Orientation. Lastly, Koreans are expected to achieve high scores
on Uncertainty Avoidance and Long-term Orientation, and low scores on Individualism and
Masculinity (Appendix C).
Semantic space and product element space questionnaire. The last section of the first
instrument asked participants to list three descriptive words that can be used to describe the ideal
industrial design/physical hardware of the mobile devices, as well as to rank the three most
important features from a pre-determined list of components. Participants whose native language
is that other than English are also asked to include the translation of the three selected descriptive
Demographic questionnaire #2. The first section of the second instrument asked
participants to self-identify with an extended list of cultural options which took into account any
partial American affiliation. Participants were also asked to note their age, and the amount of
years that they have lived in the Unites States (Appendix E).
Semantic differential (SD) scale questionnaire. This section contained a list of six
Kansei words and their respective antonyms on a 6-point SD scale. Also included was an
additional ‗likeability‘ question also using a 6-point Likert scale. Participants were asked to rate
four design features of three phones, going through one phone at a time. This instrument
contained basic information on the design features for each phone (similar to information that
would be found on packaging in a store when a consumer is making a purchasing decision), as
well as a basic definition of the design feature. For example, the design feature ‗LCD Screen
Size‘ was accompanied by the definition ―the diagonal length of the LCD screen primarily used
to view the user interface‖ and the descriptive text for one particular phone was 4.3‖ (Appendix
E).
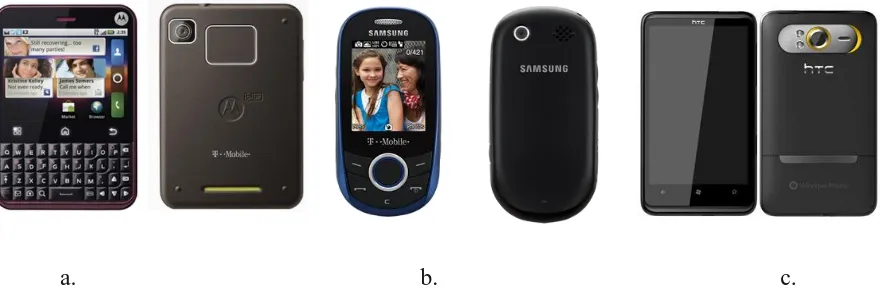
Phones. The phones that rated during the study where: (1) ―Phone 1‖, Motorola
CHARM, (2) ―Phone 2‖, Samsung t249, and (3) ―Phone 3‖, HTC HD7 (Figure 2). Tangible
phone samples (i.e., real phones) were used as opposed to images to allow the participants to
have tactile feedback when exploring the features of the phone and provide more
accurate/realistic ratings.
Experimental Design
This study was a mixed factorial design. The kansei words (semantic space) and mobile
phone design features of interest (product elements space) were developed from the first part of
groups depending on their responses to the CVSCALE so that the four groups were
culturally-distinct and all participants participated in the KE process of ranking the pre-determined mobile
phone design features on the SD scale. The cultural group was a between-subjects variable. The
data were analyzed to determine if there was a significant difference in responses between the
four culture groups, and to also determine how the kansei words were linked with the different
design features.
Procedure
Over 17,000 students received an email distributed to all members of the student body at
the Rochester Institute of Technology. The email noted that the study‘s purpose was to determine
the role that cultural differences play in mobile phone design preferences, and as such, only
American, Chinese, Indian, and Korean students were asked to participate. They were also
informed that the study involved two separate parts and that completion of both parts was
required in order to be entered to win one of two 50-dollar VISA gift cards (Appendix G).
The first part of the test was conducted using an online survey system developed at RIT,
called ―Clipboard‖, and took approximately 10 to 20 minutes to complete. Participants were
instructed to answer the questions within all three sections of the instrument package. Once
logged into Clipboard with their RIT Student ID and password, these students were given a
three-part instrument, consisting of demographic and background mobile device questions, the
CVSCALE, and the semantic space and product element space questionnaire.
A total of 401responses were received (296 Americans, 36 Chinese, 36 Indians, 16
Koreans, and 17 Other Responses). A total of 45 participants self-identified as a member of a
particular culture, and had results on the CVSCALE that positively correlated with the cultural
extended set of participants were later asked to participate to expand the data set which brought
the total up to 98 participants who were asked to participate in the second round of data
collection. Due to some level of uncertainty with the accuracy in the CVSCALE used,
self-identification was ultimately used to assign participants to cultural groups. Data were ultimately
collected from 25 participants in total (7 Americans, 6 Chinese, 10 Indians and 2 Koreans).
A total of 103 words were acquired from the selected group of participants. These words
were then grouped into six higher level categories of kansei words and antonyms of these words
were established to develop the semantic space (Appendix I). The top three ranked phone design
features were determined and the results were used to develop the product elements space
(Appendix J). The top four design features were determined to be ―Shape of Phone‖, ―Phone
Material‖, ―Color‖, and ―LCD Screen Size‖; however, ―Color‖ was removed as there are many
cultural associations with color that are beyond the scope of this study. Also, with the
introduction of personalizable phone shells (commonly referred to as ―skins‖) in the mobile
phone market, phone color can be changed at will by the consumer to fit their design preference.
The next ranked design feature, ―Navigation Tools‖, was selected to replace ―Color‖.
Following this, a sample of current mobile phones known in the United States was
determined. From this sample, three phones which provided variability in the design features
Table 2
Design Features and Styles of Selected Phones
[image:31.612.78.520.502.649.2]a. b. c.
Figure 2. Front and Back Images of the Phones, a. Motorola CHARM (Phone #1), b. Samsung
t249 (Phone # 2), and c. HTC HD7 (Phone #3).
Design Feature Phone Style of Design Feature
Shape of Phone
Motorola CHARM Samsung t249 HTC HD7
Squared Egg
Rectangular
Phone Material
Motorola CHARM Glass, Chrome-plated plastic
Samsung t249 Painted plastic, rubber
HTC HD7 Glass, Metal
LCD Screen Size
Motorola CHARM 2.8‖- medium
Samsung t249 1.8‖-small
HTC HD7 4.3‖- large
Navigation Tools
Motorola CHARM Hard Buttons
Samsung t249 5-way controller
All three phones were de-branded with the use of masking tape. For the second part of
the study, a two-part instrument was utilized to determine the level of relatedness between a
particular adjective/kansei word and a particular design element. Those students who agreed to
participate in the second part of the study were instructed to meet the researcher at the Wallace
Library on RIT‘s campus. The researcher followed a guide to ensure that the same directions
were given to all participants (Appendix F). Participants were given a consent form to sign, and
at the completion of the study, participants were debriefed. After the data collection phase was
completed, a random drawing of two participant names occurred and they were both given 50
dollars.
Analyses
The data from the first instrument were analyzed using descriptive statistics, manual
cluster analysis to determine the Semantic Space, and manual ranking analysis to determine the
Product Elements Space. Data from the second instrument were analyzed using descriptive
Results
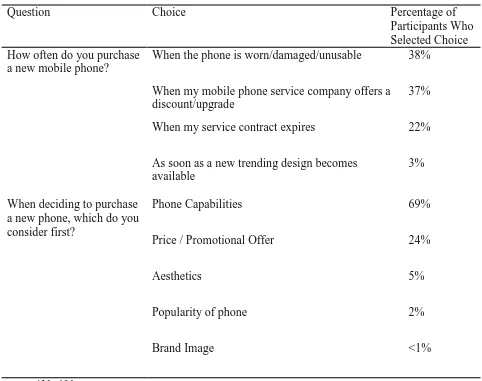
Descriptive statistics were used to explore the results of the demographic and background
questionnaire. Frequencies were determined for each questioned asked. The data revealed that,
initially, 187 males and 212 females responded to the survey. Note that two responses are
missing from this set. Participants were also asked about frequency and drivers of new phone
purchase (Table 3). Most participants responded that they purchase a new mobile phone when
[image:33.612.65.547.316.697.2]it‘s worn/damaged/unusable and the main driver for purchasing a new phone is its capabilities.
Table 3
Percentage of User Responses on the Demographic and Mobile Device Questionnaire
Question Choice Percentage of
Participants Who Selected Choice How often do you purchase
a new mobile phone?
When the phone is worn/damaged/unusable 38%
When my mobile phone service company offers a discount/upgrade
37%
When my service contract expires 22%
As soon as a new trending design becomes available
3%
When deciding to purchase a new phone, which do you consider first?
Phone Capabilities 69%
Price / Promotional Offer 24%
Aesthetics 5%
Popularity of phone 2%
Brand Image <1%
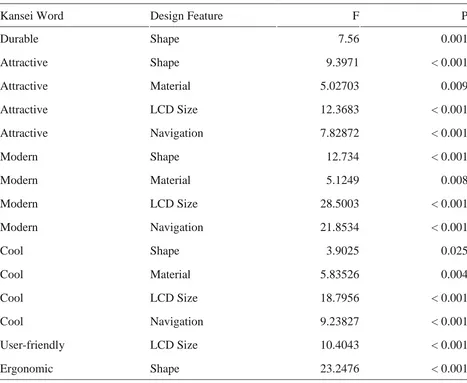
Twenty-four single factor ANOVAs were conducted to see if there were any significant
differences in the kansei ratings of mobile phone design features between three phone styles. Of
the 24, 15 pairs yielded significant differences: (1) Durable-Shape, (2) Attractive-Shape, (3)
Attractive-Material, (4) Attractive-LCD Size, (5) Attractive-Navigation, (6) Modern-Shape, (7)
Modern-Material, (8) Modern-LCD Size, (9) Modern-Navigation, (10) Shape, (11)
Cool-Material, (12) Cool-LCD Size, (13) Cool-Navigation, (14) User-friendly-LCD Size and (15)
[image:34.612.72.539.317.700.2]Ergonomic-Shape. The details of this result are further explained in the Discussion section.
Table 4
ANOVA Results for Statistically Significant Kansei Words and Design Features
Kansei Word Design Feature F P
Durable Shape 7.56 0.001
Attractive Shape 9.3971 < 0.001
Attractive Material 5.02703 0.009
Attractive LCD Size 12.3683 < 0.001
Attractive Navigation 7.82872 < 0.001
Modern Shape 12.734 < 0.001
Modern Material 5.1249 0.008
Modern LCD Size 28.5003 < 0.001
Modern Navigation 21.8534 < 0.001
Cool Shape 3.9025 0.025
Cool Material 5.83526 0.004
Cool LCD Size 18.7956 < 0.001
Cool Navigation 9.23827 < 0.001
User-friendly LCD Size 10.4043 < 0.001
Seven factorial ANOVAs were also conducted to determine if the model produced any
significant effects when considering the number of participants, gender, design features, phones,
and cultural groups. Note that Koreans were removed from this model as the group was too small
with N = 2. For the ―Durable‖ kansei word, the results indicated that cultural groups, F (2, 250)
= 4.86, p =.008, phone styles, F (2, 250) = 6.68, p = .001, and the cultural group-phone
interaction, F (4, 250) = 2.52, p =.042, had significant effects on the kansei ratings. For the
―Attractive‖ kansei word, the phone, F (2, 248) = 18.29, p < .001, and phone-design feature
interaction, F (6, 248) = 2.92, p =.009, were determined to have an effect on the ratings. For the
―Modern‖ kansei word, the significant effect came from the phone main effect, F (2, 247) =
47.21, p < .001, and phone-design feature interaction, F (6, 247) = 3.29, p =.004. ―Cool‖ kansei
ratings were determined to be affected by cultural groups, F (2, 249) = 3.42, p=.034, phone, F (2,
249) = 22.38, p < .001 and phone-design feature interaction, F (6, 249) = 2.16, p =.048. For
―User-friendly‖, the results indicated that gender, F (1, 250) = 5.44, p =.020, and phone-design
feature interaction, F (6, 250) =2.81, p =.012, had significant effects on the kansei rating scores.
Phone, F (2, 250) = 5.61, p =.004, and the phone-design feature interaction, F (6, 250) = 6.54, p
< .001, were determined to have significant impact on the ―Ergonomic‖‘ kansei rating scores.
Considering the likeability of the phone design features on the given kansei rating scales, phone,
F (2, 250) = 5.55, p =.004, and phone-design feature interaction, F (6, 250) = 4.70, p < .001, both
played a significant role in the scores obtained from participants. Tukey‘s Honestly Significant
Difference (HSD) was used to run pair-wise comparisons on significant main effects and
determine which groups differed from each other without the inflation of Type I error rate. These
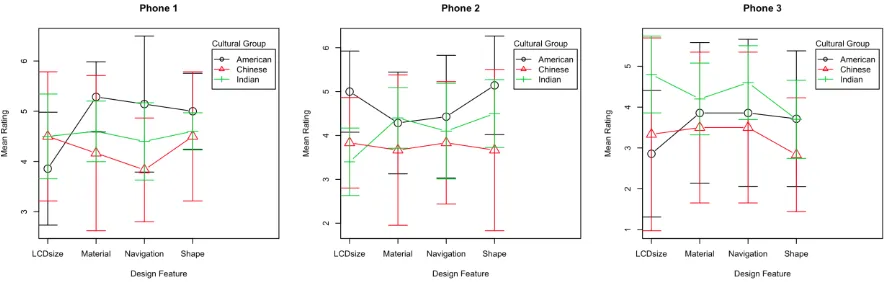
Attractive
The phone-design features interaction was found to be a significant effect (Table 5, in
Appendix L). Considering all participants, Phone 3 received the highest ratings for all four
design features. Phone 1‘s squared body was rated the lowest for shape but had higher, similar
scores for Phones 2 (egg-shaped) and 3 (rectangular shape). For the material used, Phone 1‘s
painted plastic and glass and Phone 2‘s painted plastic and rubber were rated similarly, but
Phone 3‘s metal and glass combination received the highest ratings. For the LCD Screen size,
Phone 2 (1.8‖) received the lowest ratings, while Phone 3 (4.3‖) had the highest ratings.
Navigation was rated similarly for Phones 1 (hard buttons) and 2 (5-way controller), but very
[image:36.612.78.517.353.495.2]high for Phone 3 (touchpad) (Figure 3).
Figure 3. Ratings for the ―Attractive‖ kansei word on the three experimental phones by design
feature (on the x-axis) and cultural groups (separate lines).
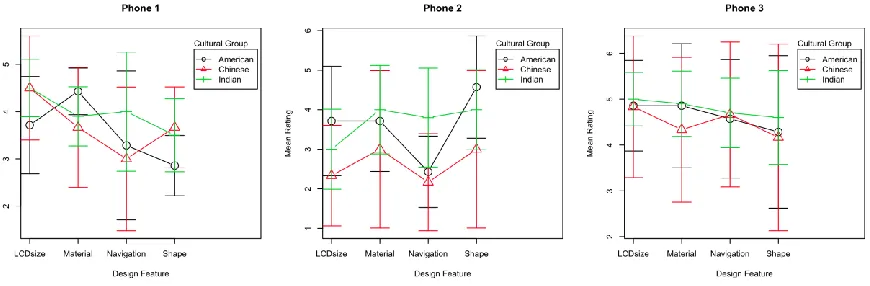
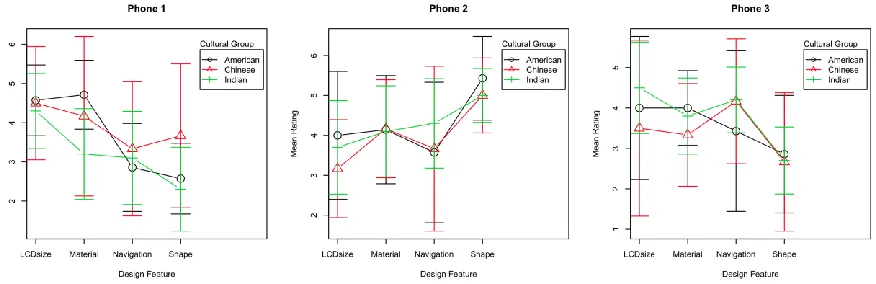
Cool
The phone-design feature interaction effect was found to be a significant contributor,
along with cultural groups (Table 6, in Appendix L). Again, Phone 3 yielded the highest scores
across all four design features. Significant differences were determined for Phone 1 and Phone 3
were similarly rated, and Phone 3 obtained the highest ratings of the group. Considering the LCD
Screen, large differences were found between Phones 1 and 2 LCD screen sizes and Phone 3‘s
and Phone 2‘s LCD screen sizes- a larger screen was deemed cooler. Phone 2‘s navigation was
determined to be the ―lamest‖ when comparing phones, while Phone 3‘s touchpad was favored.
Tukey‘s HSD test revealed significant differences between the Indian and Chinese groups (p=
.026) (Table 12, in Appendix L). Chinese participants tended to give the lowest ratings across
design features. This difference can be seen with Phone 2 where the largest separation between
[image:37.612.82.517.299.442.2]mean scores of Chinese and Indian participants exists (Figure 4).
Figure 4. Ratings for the ―Cool‖ kansei word of the three experimental phones by design feature
(on the x-axis) and cultural groups (separate lines).
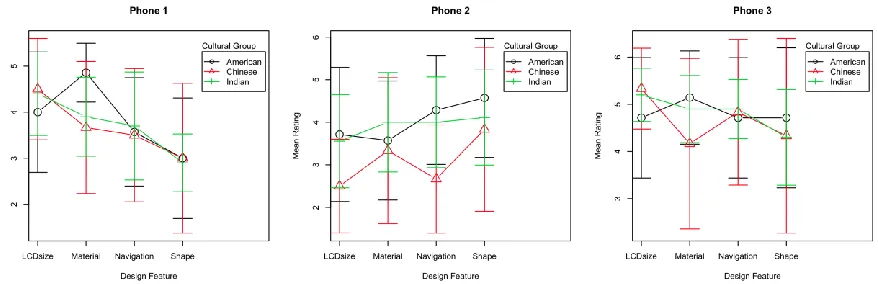
Durable
For the ―Durable‖ kansei word, the phone-cultural groups interaction was found to be
significant (Table 7, in Appendix L). Chinese responses were significantly different than Indian
and American scores when considering the different phone types. Phone 3 was considered to be
less durable and more fragile than Phone 1. Americans rated Phones 1 and 2 similarly, but rated
Phone 3 lower. Indian participants rated Phones 1 and 3 similarly, but tended to rate Phone 2
1. A grouping of similar ratings for all three cultures can be seen for Phone 1, while the scores
are more separated for Phone 3. This suggests that while the cultural groups agreed that Phone 1
[image:38.612.73.517.161.302.2]had good durability, they were in less harmony when considering Phone 3 (Figure 5).
Figure 5. Ratings for the ―Durable‖ kansei word of the three experimental phones by design
feature (on the x-axis) and cultural groups (separate lines).
Ergonomic
The phone-design feature interaction was found to be a significant contributor to the
―Ergonomic‖ kansei word (Table 8, in Appendix L). Phone 1‘s navigation, LCD screen size, and
material were all rated fairly similarly across the three phones. However, the largest difference
is seen when considering the shape of the phones. Phone 2‘s egg shape was highly ergonomic, as
Figure 6. Ratings for the ―Ergonomic‖ kansei word of the three experimental phones by design
feature (on the x-axis) and cultural groups (separate lines).
Modern
Again, the phone-design feature was determined to be a significant effect on kansei rating
scores (Table 9, in Appendix L). Phone 3‘s rectangular shape was significantly higher than
Phone 1‘s squared shape and Phone 2‘s egg shape. Considering the material of the phones,
Phone 1 was rated slightly higher than Phone 2, but Phone 3 obtained significantly higher ratings
than both. For LCD Screen size and Navigation, ratings went to opposite way for Phone 1 and
Phone 2- Phone 2 obtained lower scores than Phone 1. Both design features peaked with Phone
3. Overall, Phone 3 was deemed to be more modern across design features (Figure 7).
Figure 7. Ratings for the ―Modern‖ kansei word of the three experimental phones by design
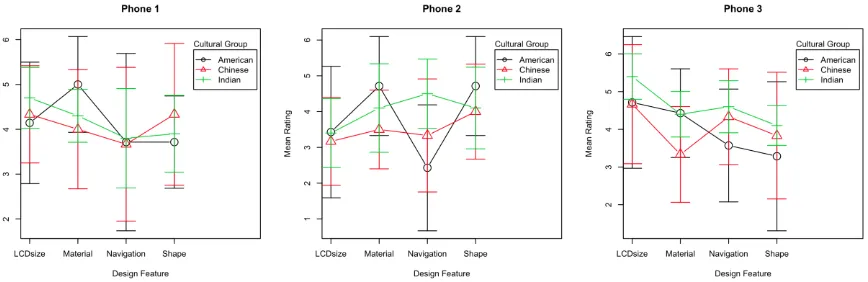
[image:39.612.76.517.517.661.2]User-friendly
The gender main effect and phone-design feature interaction were found to be significant
(Table 10, in Appendix L). Tukey‘s HSD test showed that male participants tended to rate the
design features as being more user-friendly than female participants across two of the three
phones (p= .023) (Table 13, in Appendix L). Scores between females and males are closely rated
for design features on Phone 2, which suggests that participants agreed on the level of kansei
elicited by this phone (with the exception of the Navigational Tools design feature). Looking at
the interaction effect, the greatest difference was found between Phone 2 and 3‘s ratings for the
LCD screen size. Participants perceived Phone 3‘s large screen as more intuitive than Phone 2‘s
[image:40.612.85.519.354.495.2]small screen (Figures 8, 9).
Figure 8. Ratings for the ―User-friendly‖ kansei word of the three experimental phones by design
Figure 9. Ratings for the ―User-friendly‖ kansei word of the three experimental phones by
design feature (on the x-axis) and gender (separate lines).
Likeability
Though this was not selected as a kansei word, likeability scores were examined for
significant score contributors; the phone-design feature interaction was found to be one (Table
11, in Appendix L). Consistent with the many of the other results found, the LCD screens of
Phones 1 and 3 were overall more liked than Phone 2. However, Phone 2‘s shape was more
preferred than Phone 1. Material received similar scores across all three phones indicating that
participants may not have had a strong preference for the three different materials presented.
Phone 3‘s navigation was marginally more likeable than Phone 1 and Phone 2 (Figure 10).
Figure 10. Ratings for the likeability of the three experimental phones by design feature (on the
[image:41.612.75.515.489.628.2]These results suggest that there are only some areas where difference exists between the
cultural groups, when considering mobile phone design preferences and the kansei associated
with those design features. For most groups, particular phone features elicited the same positive
kansei while other kanseis were less perceived As such, the null hypothesis can be partially
rejected; the durability and coolness of the phone yielded significant differences between
Americans, Chinese and Indians. However, the other four kansei words did not show any
significant cultural differences. Mainly Chinese participants were found to respond differently to
the given kanseis than Americans and Indians. Though a clear explanation is not known, several
possibilities can be speculated. The Chinese cultural group may have a tendency to rate scores
closer to the neutral point while other groups may be more prone to giving ratings at the extreme
ends of a scale. Something else to consider is that the kanseis may not be as strongly elicited for
Discussion
Previous studies have supported the importance of emotive appeal in visual product
design (Jordan, 2000; Koehler & Harvey, 2004; Norman, 2004; Lee, 2007). This feeling that is
experienced by the consumer aids in the decision-making process when selecting to purchase/use
a product. As such, KE was developed to identify, translate, and implement these feelings, as
dictated by the target consumer. However, it has typically been used in homogeneous cultures,
and there are large cultural differences in how consumers view products and how elicited
feelings translate into product design desires in America, which this study attempted to account
for. Several design features were explored to determine which would obtain the highest ratings
on a given descriptive kansei word. There were a total of three phones (Motorola CHARM,
Samsung t249, HTC HD7), four design features (Shape, Material, LCD Size, Navigation) and six
kansei words (Durable, Attractive, Modern, Cool, User-friendly, Ergonomic).
Of those, 15 were found to hold significantly different results from the other features
(Table 14). If designers were interested in appealing to the general population of RIT students in
the 18 to 30 years old age range (target end users) the data suggests that the most ideal phone
would have a rectangular body shape, be comprised mostly of glass and a metal-like material,
have a large or medium-sized LCD screen size (approximately 2.8‖- 4.3‖), and use a touchpad to
control most of the navigation. Use of the rectangular shape design feature or glass and
metal-like material as main material components would elicit the kanseis of ―Attractive‖, ―Modern‖,
and ―Cool‖, though on the downside, it may also elicit a feeling of being too fragile or having an
inconvenient fit. To account for the lack of durability or ergonomic feeling, designers may want
to consider using an egg-shaped phone or one is that comprised mainly of rubber/painted
―Attractive‖, ―Modern‖, ―Cool‖, ―User-friendly‖ and ―Ergonomic‖. However, the use of a
smaller screen may cause consumers to think that the phone is old-fashioned or lame. The use of
a touchpad navigation system would bring about all six kanseis. On the other hand, designers
will want to steer clear of designs that involve the use of a 5-way controller for main navigation
as this may be perceived to be old-fashioned and lame.
Limitations
There were several noted limitations with this study which may explain the results
derived through statistical analyses. One of the components of the KE Model is the testing for
the validity of the model (Jindo & Hirasago, 1997). This is done to determine how accurately the
proposed KES worked. However, due to time-line constraints and design limitations, this phase
was beyond the scope of this study‘s timeline. As such, the design recommendations can only be
suggested as being desired or preferred by the main target group. Future testing should involve
testing the proposed model to see if it yields similar results.
While the total sample size was 25, sub-cultural groups consisted of 7 Americans, 6
Chinese, 10 Indians, and 2 Koreans. With the sub-group sizes being so small, one must offer a
caveat concerned with the threat to external validity when using such a small sample size. Future
studies should use larger samples when testing the difference between multiple groups to
minimize this threat. The sample sizes of the phones and design features were also small. This
study only explored three variations of four features across six kansei words. Future studies
should consider using a larger sample of products to provide more variability and develop a more
accurate and realistic KE system.
Another limitation is concerned with the method used for identifying cultural groups.
cultural groups after initially using the CVSCALE. The self-identification method has its flaws
as participants may believe that they have values reflective of one culture when that may in fact
be false. However, the results from the CVSCALE did not seem to match how students may
view themselves. For example, of the 296 Americans, only two were determined to have
American values. The issues with the CVSCALE can be attributed to one of two possible
reasons: (1) Hofstede‘s dimensions were not designed to explore cultural differences concerned
with product design reference, or (2) the sample of university students used is a melting pot of
cultures where similar values exist. Culture is not easy to measure or define; however, future
studies should try to find a more robust way to measure different cultural groups who reside in
the United States.
Something else to consider that may have skewed or influenced the kansei rating scores
results would be the participant‘s current phone and their views on that phone. If a participant
has a particular design that he/she has had good experiences with, they may rate a phone with a
similar design feature highly. The same is true for the opposite; if a participant has had a
negative experience with a phone, they may rate a similar design feature lower on the SD scale.
Future studies should explore the involvement of this by looking into which phone the
participant currently has and their views on that phone‘s design features.
Also, reviewing the literature on KE highlighted a common issue- the lack of rigidity in
the method used to go through the full KE process. The literature mentions that there are several
different ways to collect and determine kansei words- researchers can acquire words through
feedback from the target group by asking them to use words to describe specific elements
associated with the product. Also, researchers can ask designers to provide these subjective
products or brands (Jindo & Hirasago, 1997; Ying & Yan, 2006; Chen, Chiu, & Lin, 2007). This
research chose to utilize the first option as this was thought to reveal the words that were most
relevant to the target group as they were determined by said group. However, by using this
method, there is a risk in a researcher understanding and interpreting what descriptive words
mean to different cultural groups, especially in cases where those words are translated into
English and standardized to be used for evaluations in multiple cultures. A future goal of this
study is to use the native words collected from participants and have them interpreted by native
speakers of the indicated languages to see if there were differences in the descriptive words
collected.
In order to synthesize the data between the Semantic Space and Product Elements Space,
several analysis techniques were used by past researchers: factor analysis (Quantification Theory
Type III), multiple regression analysis (Quantification Theory Type I), cluster analysis, rough set
analysis, neural networks, and correlation statistics (Nagamachi, 1995; Jindo & Hirasago, 1997;
Schutte & Eklund, 2001; Nagamachi, 2002; Lai, Lin, Yeh, & Wei, 2006; Ying & Yan, 2006;
Chen, Chiu, & Lin, 2007; Roy, Goatman, & Khangura, 2009). All were done with the intention
to determine the relatedness and influence of kansei words and product design features.
However, review of past research did not yield a clear, robust way to analyze data or rationale
for choosing the statistical analysis method used. This study opted to explore the use of Analysis
of Variance for statistical significance of the data set as the main goals of the analyses were to
determine if there were any significant differences between the variations of four mobile phone
design features, and determine if there were any significant differences between the cultural
Conclusion
In this thesis, we implemented the KE process and examined how it influences mobile
phone designs. Hardware design features (i.e., shape, material, LCD size, navigation) of three
phones were explored with the consideration of six kansei words: (1) attractive, (2) cool, (3)
durable, (4) ergonomic, (5) modern, and (6) user-friendly. It was determined that a desirable
phone for the sample group of participants should have a rectangular shape, be made of glass and
metal, have a large LCD screen, and have a touchpad navigation interface.
We also explored the role that cultural differences play in the perception of the
relationship between mobile phone design mobile phone design features and the desired kansei.
Three cultural groups were examined: (1) American, (2) Chinese, and (3) Indian.The Indian and
Chnese groups were found to be significantly different when evaluating the ―Cool‖ kansei, with
Chinese participants giving the lowest ratings across design features.
While the KE model has been tested in the past, and has been determined to yield reliable
results, future studies should consider developing a model which aims to behave similarly to the
KE process, while accounting for many of the loopholes discovered during this research. By
designing multiple models and testing those against the existing KE model, a more robust design
method is expected to emerge with which designers/consumers can accurately find design
References
Bakir, A., Blodgett, J. G., Vitell, S.J. & Rose, G.M. (2000). A preliminary investigation of the
reliability and validity of Hofstede‘s cross cultural dimensions. Proceedings for Academy
of Marketing Science, May 24-28, 2000. Montreal, Quebec, Canada.
Barber, W. & Badre, A. (1998) Culturability: The merging of culture and usability. In:
Proceeding of the 4th Conference on Human Factors and the Web, Basking Ridge, New
Jersey.
Cell phone subscriptions to hit 5 billion globally. (2010, February 16) Retrieved May 19, 2010
from Cnet website: http://reviews.cnet.com/8301-13970_7-10454065-78.html.
Chen, K., Chiu, S., & Lin, F. (2007). Kansei design with cross cultural perspectives. In Aykin, N.
(Ed.) Usability and internationalization: HCI and culture. U. Berlin; New York:
Springer.
De Mooij, M. & Hofstede, G. (2010). The Hofstede model: Global marketing and advertising,
understanding cultural paradoxes. International Journal of Advertising, 29(1), 85–110.
Desmet, P. M. A., & Hekkert, P. (2007). Framework of product experience. International
Journal of Design, 1(1), 57-66.
Hofstede, G. (1980). Culture's consequences: International differences in work-related values.
Beverly Hills, CA: Sage.
Jindo, T. & Hirasago, K. (1997) Application to car interior of Kansei engineering. International
Journal of Industrial Ergonomics, 19, 105-114.
Jordan, P.W. (2000). Designing pleasurable products. Philadelphia, PA: Taylor & Francis.