<
(
(
1
1
T
B
.
EXTERNAL TRADE
I l TJ B j g i
Monthly statistics
M
1 2 G
1 9 9 1
■YAW
| ^ B W
l _ r
3
BH
^
OFICINA ESTADÍSTICA DE LAS COMUNIDADES EUROPEAS
DE EUROPÆISKE FÆLLESSKABERS STATISTISKE KONTOR
STATISTISCHES AMT DER EUROPÄISCHEN GEMEINSCHAFTEN
ΣΤΑΤΙΣΤΙΚΗ ΥΠΗΡΕΣΙΑ ΤΩΝ
ΕΥΡΩΠΑΪΚΩΝ ΚΟΙΝΟΤΗΤΩΝ
STATISTICAL OFFICE OF THE EUROPEAN COMMUNITIES
OFFICE STATISTIQUE DES
COMMUNAUTÉS EUROPÉENNES
ISTITUTO STATISTICO DELLE COMUNITÀ EUROPEE
BUREAU VOOR DE STATISTIEK DER EUROPESE GEMEENSCHAPPEN
SERVIÇO DE ESTATÍSTICA DAS COMUNIDADES EUROPEIAS
L2920 Luxembourg Tél. 43011 Télex : Comeur Lu 3423
B1049 Bruxelles, bâtiment Berlaymont, rue de la Loi 200 (bureau de liaison) — Tél. 2351111
Las publicaciones de Eurostat están clasificadas por temas y por series. La clasificación se encuentra al
final de la obra. Para mayor información sobre las publicaciones, rogamos se pongan en contacto con
Eurostat.
Para los pedidos, diríjanse a las oficinas de venta cuyas direcciones figuran en la página interior de la
contracubierta.
Eurostats publikationer er klassificeret efter emne og serie. En oversigt herover findes bag i hæftet.
Yderligere oplysninger om publikationerne kan fås ved henvendelse til Eurostat.
Bestilling kan afgives til de salgssteder, der er anført på omslagets side 3.
Die Veröffentlichungen von Eurostat sind nach Themenkreisen und Reihen gegliedert. Die Gliederung ¡st
hinten in jedem Band aufgeführt. Genauere Auskünfte über die Veröffentlichungen erteilt Eurostat.
Ihre Bestellungen richten Sie bitte an die Verkaufsbüros, deren Anschriften jeweils auf der dritten
Umschlagseite der Veröffentlichungen zu finden sind.
Οι
εκδόσεις της Eurostat ταξινομούνται κατά θέμα και κατά σειρά. Η ακριβής ταξινόμηση αναφέρεται στο
τέλος κάθε έκδοσης. Για λεπτομερέστερες πληροφορίες σχετικά με τις εκδόσεις, μπορείτε να απευθύνεσθε
στην Eurostat.
Για τις παραγγελίες μπορείτε να απευθύνεσθε στα γραφεία πώλησης, των οποίων οι διευθύνσεις αναγράφονται
στη σελίδα 3 του εξωφύλλου.
Eurostat's publications are classified according to themes and series. This classification is indicated at the
end of the publication. For more detailed information on publications, contact Eurostat.
Orders are obtainable from the sales offices mentioned on the inside back cover.
Les publications d'Eurostat sont
classées par thème et par série. Cette classification est précisée à la fin
de l'ouvrage. Pour des informations plus détaillées sur les publications, contactez Eurostat.
Pour les commandes, adressez-vous aux bureaux de vente dont les adresses sont indiquées à la page 3
de la couverture.
Le pubblicazioni dell'Eurostat sono classificate per tema e per serie. Tale classificazione è precisata alla
fine dell'opera. Per informazioni più dettagliate sulle pubblicazioni rivolgersi all'Eurostat.
Per eventuali ordinazioni rivolgersi a uno degli uffici di vendita i cui indirizzi figurano nella 3a pagina
della copertina.
member countries. This simplification of declaration pro
cedures in the exchange of goods marks an important
step towards completion of the internal market.
(ii) The simultaneous entry into force of a new goods classi
fication known as the Combined Nomenclature (CN),
which is intended to meet Common Customs Tariff and
statistical requirements alike. This nomenclature is
based on the Harmonized Commodity Description and
Coding System (HS), whose aim is to enhance the world
wide comparability of external trade statistics.
As a result of both these changes, customs and statistical
departments were faced with a considerable amount of work
until the procedures had been properly introduced and
tested and formed part of normal working practice.
This meant that there were delays in the forwarding of data
in all the Member States. In addition, there was bound to be
a higher quota of errors and corrections, so that the first
month's data are not directly comparable with those of the
preceding year and therefore need to be interpreted with
caution.
drawn up using the 8-digit subheadings of the Combined
Nomenclature.
As an aid to interpretation of the statistics, Eurostat has
published in Theme 6 'Foreign Trade, Series E: Methods'
brochures entitled 'Nomenclature of goods, CN-Nimexe cor
relation tables'. These provide a comparison between the old
and new nomenclatures as well as showing the links bet
ween the Combined Nomenclature (CN) and its offshoots.
Eurostat will be glad to provide users of European statistics
with any further information or explanations they may require
with regard to these new developments.
Important note
Commentary
Charts,
General summary of trade by country:
Tab. 1: Yearly and quarterly data .
Tab. 2: Monthly data
General summary of trade by commodities:
Tab. 3: Yearly and quarterly data
Tab. 4: Monthly data
Trends in trade by country:
Tab. 5
Tab. 6
Tab. 7
World, intra- and extra-EC . . .
Intra-EC by member countries
Major areas
Trends in trade by commodities:
Tab. 8: SITC sections
Trade by partner countries:
Tab. 9: All commodities (monthly cumulative data)
Tab. 10: SITC sections and main partner countries (quarterly cumulative data)
Indices:
Tab. 11: Volume and unit value indices
Trade of main non-Community countries:
Tab. 12: Trends in total trade and with the EC (EUR 12)
Conversion rates:
Tab. 13: Member countries, United States of America, Japan and Switzerland
EC trade in agricultural products:
Tab. 14: Main product groups
Tab. 15: Products subject to common agricultural policy regulations
EC trade in petroleum products:
Tab. 16: Petroleum and petroleum products
EC and world trade:
Tab. A: World, Community and main non-Community countries
Trade of the FR of Germany, including West Berlin, as constituted prior to 3 October 1990:
Tab. B: Trade by countries
Tab. C: Trade by products
Catalogue of regular publications of external trade
XVII
2
5
8
11
16
24
30
52
92
100
140
142
146
148
152
164
168
169
172
175
Symbols and abbreviations used
EUR 12:
UEBL:
DK:
D:
GR:
E:
F:
IRL:
I:
NL:
P:
Total of the EC member countries
Belgo-Luxembourg Economic Union
Denmark
Federal Republic of Germany
Greece
Spain
France
Ireland
Italy
Netherlands
Portugal
0: Data less than half the unit used
Mio: Million
Mrd: 1000 million
ECU: European currency unit
Available data in this issue:
June 1991
July 1991
August 1991
September 1991
(The tables refer to the sta
Analysis and commentary:
Methodological notes:
EUR 12
X
UEBL
X
X
X
X
DK
X
X
X
X
D
X
X
X
GR
Χ
Χ
Χ
Χ
e of the CRONOS database on
Page VI
See Glossarium 1991
Ε
Χ
Χ
Χ
χ
4. 12
F
Χ
Χ
Χ
χ
IRL
Χ
1991)
Ι
Χ
Χ
Χ
Χ
NL
Χ
Χ
Χ
Χ
Ρ
Χ
Χ
Χ
Χ
υκ
χ
χ
χ
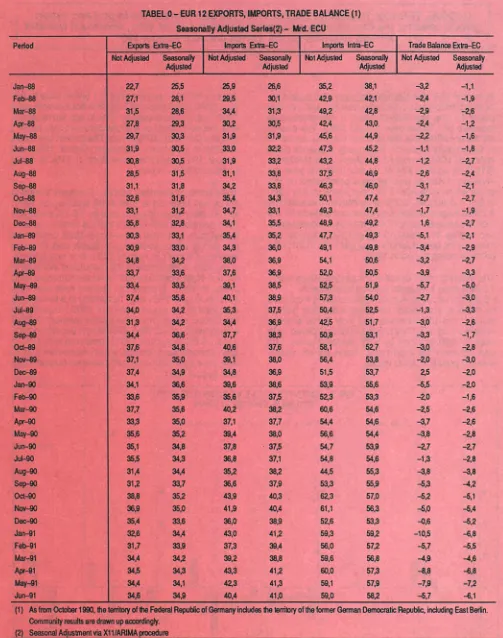
Between 1987 and the beginning of 1990, the
seasonally adjusted European Community exports
to the rest of the world (extra-EC) showed a smooth
upward trend. At the beginning of 1990 the trend
clearly started to head downwards. Over the last few
months, however, a slowdown In this downward
trend is observed. In June 1991, seasonally
adjusted extra-EC exports increased by 2,3%
compared to May 1991.
Seasonally adjusted European Community imports
from the rest of the world (extra-EC) showed a
clearly upward movement between the beginning of
1987 and the beginning of 1989. Between 1989 and
the end of 1990, seasonally adjusted imports
stabilised at a high level. They picked up again at
the beginning of 1991 and have shown considerable
fluctuations over the last few months. In June 1991,
seasonally adjusted extra-EC imports were down by
0,7% on May 1991.
The European Community's seasonally adjusted
trade balance, in deficit since the beginning of 1987,
showed a marked deterioration since the middle of
1990. The trade balance now shows significant
fluctuations around one of its lowest levels on
record. In June 1991, the seasonally adjusted
Community trade deficit stood at -6,1 mrd. ECU.
After the upward trend registered since 1988, trade
between EC Member States (intra-EC) stabilised
around a high level at the beginning of 1991.
However, over the last few months, the upward
tendency seems to have resumed. In June 1991,
seasonally adjusted trade between European
Community Member States increased by 0,5%
compared to May 1991.
EUR 12 Exports Extra-EC
Mrd. ECU
1884 1885 1 Μ β 1987 1988 1888 1880 1881 — Unadjusted — Seasonally Adjusted
EUR 12 Imports Intra-EC
Mrd. ECU
1884 1888 1888 1887 1888 1888 1880 1881 — Unadjusted — Seasonally Adjusted
EUR 12 Imports Extra-EC
Mid. ECU
1884 1985 1886 1987 1888 1989 1990 1991 — Unadjusted — Seasonally Adjusted
EUR 12 Trade Balance Exta-EC
Mar-88
Apr-88
May-88
Jun-88
Jut-88
Aug-88
Sep-88
Oct-88
Nov-88
Dec-88
Jan-89
Feb-89
Mar-89
Apr-89
May-89
Jun-89
Jul-89
Aug-89
Sep-89
Oet-89
Nov-89
Dec-89
Jan-90
Feb-90
Mar-90
Apr-90
May-90
Jun-90
Jul-90
Aug-90
Sep-90
Oct-90
Nov-90
Dec-βΟ
Jan-91
Feb-91
Mar-91
Apr-91
May-91
Jun-91
31,5
27,8
29,7
31,9
30,8
28,5
31.1
32,6
33,1
35,8
30,3
30,9
34.8
33,7
33,4
37,4
34,0
31.3
34,4
37,6
37,1
37,4
34,1
33,6
37.7
33,3
35,6
35,1
35,5
31,4
31
Ζ
38,8
36,9
35,4
32,6
31.7
34,4
34,5
34,4
34,6
28,6
29.3
30,3
30,5
30,5
31,5
31,8
31.6
31
Í.
32,8
33,1
33,0
34,2
33,6
33,5
35,8
34,2
34,2
36,6
34,8
35,0
34,9
36,6
35,9
35.6
35,0
35,2
34,8
34,3
34,4
33,7
35,2
35,0
33,6
34,4
33,9
34,2
34,3
34,1
34,9
34,4
30,2
31,9
33.0
31.9
31.1
34,2
35,4
34.7
34.1
35,4
34,3
38,0
37,6
39,1
40,1
35.3
34,4
37,7
40,6
39,1
34,8
39,6
35,6
40,2
37.1
39,4
37,8
36,8
35,2
36,6
43,9
41.9
36,0
43,0
37,3
39,2
43,3
42,3
40,4
31,3
30,5
31,9
32,2
33,2
33,8
33.8
34,3
33,1
35,5
35,2
36,0
36,9
36,9
38,5
38,9
37,5
36,9
38,3
37,6
38,0
36.9
38,6
37,5
38,2
37,7
38,0
37,5
37,1
38,2
37.9
40,3
40,4
38,9
41.2
39,4
38.8
41.2
41.3
41.0
49,2
42,4
45,6
47,3
43,2
37,5
46,3
50,1
49,3
48,9
47.7
49,1
54,1
52,0
52,5
57,3
50,4
42,5
50.8
58,1
56,4
51,5
53,9
52.3
60.6
54,4
56.6
54,7
54.8
44,5
53,3
62.3
61.1
52,6
59,3
56,0
59,6
60,0
59,1
59,0
42,8
43,0
44,9
45,2
44,8
46,9
46,0
47,4
47,4
49.2
49,3
49,8
50,6
50,5
51,9
54,0
52,5
51,7
53,1
52.7
53,8
53,7
55,6
53,3
54,6
54,6
54,4
53.9
54,6
55,3
55,9
57,0
56,3
53,3
59.2
57,2
56.8
57,3
57,9
58,2
-2.9
-2.4
-2.2
-1.1
-1.2
-2.6
-3,1
-2,7
-1,7
1.6
-5.1
-3.4
-3.2
-3.9
-5.7
-2.7
-1.3
-3.0
-3.3
-5.0
-2.0
2.5
-5.5
-2,0
-2,5
-3.7
-3,8
-2.7
-1.3
-3,8
-5.3
-5.2
-5.0
-0.6
-10,5
-5.7
-4.9
-3.8
-7.9
-5,7
-2.6
-1.2
-1,6
-1.8
-2.7
-2.4
-2.1
-2,7
-1,9
-2.7
-2.1
-2.9
-2,7
-3,3
-5,0
-3,0
-3,3
-2.6
-1.7
-2.8
-3,0
-2,0
-2,0
-1,6
-2,6
-2,6
-2.8
-2.7
-2.8
-3,8
-4,2
-5,1
-5.4
-5,2
-€.8
-5,5
-4,6
-6,8
-7,2
-6,1
(1 )
As
from October 1990, the territory of the Federal Republic of Germany includes the territory of the former German Democratic Republic, including East Berlin.
Community results are drawn up accordingly.
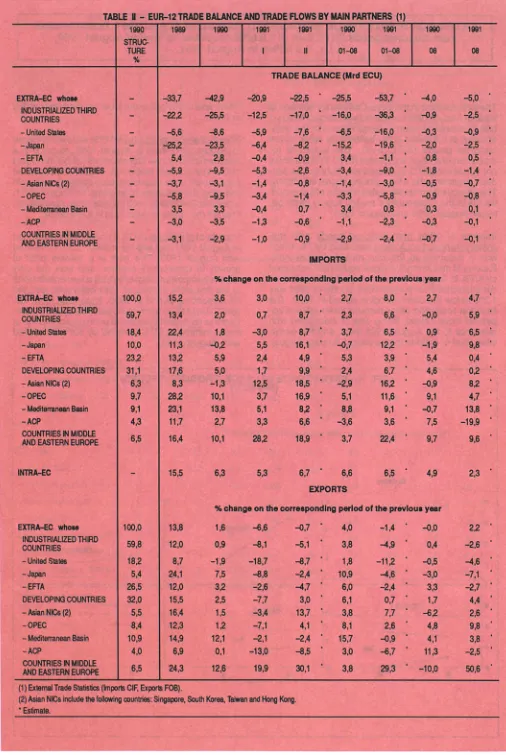
[image:9.595.63.566.34.672.2]In August 1991 the Community's external trade defi
cil was 5 billion ecus. Although less than the average
deficit for the first half of 1991, it represented an
increase of 1 billion over August 1990. The energy
bill did not affect this result, since the cost per barrel
of Community crude oil was nearly a quarter down
in August 1991 compared with the August 1990 price
($18.6 as against $24.4). At this time last year the
invasion of Kuwait was having a great effect on this
price, which rose from $15.7 per barrel in July 1990
to $24.4 in August. Community imports increased by
4.7% in August, which was down compared with the
monthly rates since April. Community exports increa
sed slightly in August 1991 (+2.2%), but remained
lowerforthe period JanuaryAugust 1991 thanforthe
corresponding period in 1990.
The external trade deficit of the United States was
7 billion ecus in August 1991 compared with
9,3 billion ecus in August 1990. Imports increased
by 8.7% in ecu terms, following a dull first half. In
dollar terms this increase was only 3.2%. Exports
increased by 17.7% in ecu terms compared with
August 1990, but only by 5.5% in dollar terms. The
gap between the export and import growth values
was 2.6 points in dollar terms.
Japan's monthly surplus was 6.1 billion ecus in Au
gust 1991, an increase of 2.5 billion ecus over August
1990. Imports increased by 11% in ecu terms, which
was the equivalent of a slight drop in dollar terms ,
and of a fall nearly 10% in yen. The growth in exports
of 23% in ecu terms, between August 1990 and
August 1991, was the equivalent of 11% in dollar
terms and 2.5% in yen.
Total trade of member states.
Germany's surplus
fell by half between August 1990 and August 1991,
to 1.4 billion ecus. Imports rose by 12.1% in August
1991 compared with August 1990, a similar increase
to that in August 1990 over August 1989, confirming
the strong trend. Imports into Spain and Portugal
increased further in August 1991 at a rate approa
ching 10%, comparable to the cumulated increase in
the first eight months of 1991 overthe corresponding
period in 1990. Imports into Greece rose again (by
17%) in August 1991 after remaining at a lower level
than for the first seven months of 1990. Imports into
the United Kingdom for the period JanuaryAugust
were down by 4% in 1991. Germany's exports increa
sed by 5.5% in August 1991, compared with 10% in
July. Exports from Greece, which recovered only in
July, rose by nearly onethird between August 1990
and August 1991.
GR. I
IMPORTS AND EXPORTS (CIF.FOB)
annual
% change In
value
wjm
»■
io
90
90
91
90
91
90
90 91
0106
08
0108
EUR12
USA
■a
' ■ '
90
91
90
90 91
03
0108
JAPAN
BLEU
Denmark
Germany
Greece
Spain
France
Ireland
Italy
Netherlands
Portugal
United Kingdom
EUR-12(2)
United States
Japan
BLEU
Denmark
Germany
Greece
Spain
France
Ireland
Italy
Netherlands
Portugal
United Kingdom
EUR-12(2)
United Stete·
Japan
BLEU
Denmark
Germany
Greece
Spain
France
Ireland
Italy
Netherlands
Portugal
United Kingdom
Memorandum
hem
1 USDs.„ECU
1 YEN = „.ECU
-2,2
1,2
64,0
-7,8
-19,3
-14,9
3,1
-11,2
3,5
-5,6
-41,1
15,2
14,6
20,6
15,2
10,5
15,4
40,0
27,3
16,6
19,8
18,7
14,2
13,4
7,8
13,8
21,3
11,3
16,7
11,3
13,1
48,6
16,0
16,2
18,6
17,6
16,7
23,5
11,7
7,3
-0,3
-6,6
2,4
47,4
-9,2
-20,1
-17,3
2,3
-9,3
0,3
-6,7
-31,9
%
3.6
-9,3 "
-3,9
6,0
2,9
10,3
6,0
7,7
4,9
3,8
2,9
5.3
14,0
-1,6
%
1,6
-6,2 "
-9,8
2,3
7,3
2,8
-7,8
9.3
3,9
-0,6
4,7
2,0
11,7
4,6
%
-13,5
-17,3
-1,5
0,5
3,0
-2,5
^»,7
-5,0
0,4
-i,2
-0,2
-1,8
-6,8
-1.6
0,6
-1,0
-2,3
-5,7
-3.2
-3,4
-1.3
-2.2
-5,7
-4,3
1,3
37,7
-6.7
-14,1
-10,6
1,7
-6,0
0,2
-4,2
-24,7
IMPORTS
-5,0
1.6
3,5
-6,0
-14,4
-10,7
-7,3
-2,4
-5,3
-17,1
-1,6
0,1
2,7
-0,6
-1,3
-1,3
-0,1
0,2
-0,7
-0,5
-2,6
change o n the corresponding period of the previous year
3,0
-13,7
"
1,4
2,6
-0,4
19,8
-2,1
5,4
0,8
3,6
-1.4
2,0
8,1
-6,3
10,0
1,4
"
8,1
5,2
7.6
24,9
-6,5
9,0
4,6
5,4
5,1
6,7
-4,9
2,7
-7,9 "
-6,4
6,9
3,9
8,0
25,8
6,0
5,5
3,3
3,1
5,8
14,6
-2,3
EXPORTS
8,0 '
-2.4 "
7.3
4.2
3,4
21,9
-2.1
8,9
3,7
3,0
4,7
8,8
-4.0
2,7
-15,0 "
-13,8
11,6
5,2
13,7
2,2
-7,0
5.9
1.9
-6,6
2,6
-1,3
-4,0
change on the corresponding period of the previous year
-6,6
-6,1 "
1.2
1.6
-1,2
-2,4
-12,6
14,7
-0,7
-3,6
4,2
-1,6
0,9
0,3
-0,7
10,4
15,5
5,8
7,7
2,0
14.1
13,8
6,2
0,1
0,1
-2,4
3,8
4,0
-3,8 "
-β,6
3,2
8,9
3,4
6,0
8,5
5,0
2,6
6,5
3,9
15,7
4,7
EXCHANGE RATE
-1,4
6,0 "
11.8
3.3
4,8
1.6
10,4
12,1
3,9
1,8
1,1
0,6
3,1
-0,0
-11.7 "
-9,5
5,9
8,5
-0,5
-18,0
4,6
4.0
-8.4
0,0
-7,8
-2,6
13,3
change on the corresponding period of the previous year
-10,1
-0,4
3,0
15,5
-11,1
-20,2
-0,3
10,2
-18,1
-21,5
-1,5
0,4
1,4
-0,7
-1,6
-1,1
0,2
-0,2
-0,6
-2.5
4,7 '
8,7 "
10,9
-5,8
-13,7
12,1
17,1
10,5
2,2
-0,3
-3,6
9,4
-0,9
2,2 '
17,7 "
23,0
-6,0
-1,8
5,5
30,9
4,3
4,4
0,4
2,8
2.9
0,1
11,9
20.5
(1 ) External Trade Statistics (Imports CIF, Exports FOB).
(2) EUR-12 includes only extra flows. Figures for Member States include world flows.
' Estimate.
In August 1991 the Community's trade deficit with the
industrialized countries increased by 1.6 billion ecus
over August 1990. The deficits with Japan and the
United States increased each by half a billion ecus,
and stood at -2.5 billion ecus and -0.9 billion ecus
respectively in August 1991. The surplus of 0.8%
billion ecus with EFTA in August 1990 fell to 0.5%
billion ecus in August 1991. Imports from the
indus-trialized countries increased by 5.9% between
Au-gust 1990 and AuAu-gust 1991, under the impetus of
imports from the United States (+6.5%) and Japan
(+9.8%), which may be compared with the increases
in the value of the dollar and the yen over the same
period (+11.9% and +20.5% respectively). Imports
from the EFTA countries stagnated. Exports from the
Community to the industrialized countries fell by
2.6% from the August 1990 level. This affected
ex-ports to EFTA (-2.7%), the United States (-4.6%) and
Japan (-7.1 ). The increases in the dollar and the yen,
which should have helped exports from Europe, do
not seem to have had much effect.
The balance of the Community's trade with the
de-veloping countries improved by 0.4 billion ecus
be-tween August 1990 and August 1991. Neverthless, it
was still in deficit by 1.4 billion ecus. Community
imports from the developing countries remained
un-changed with reference to the August 1990 level,
after a sharp rise in July 1991 compared with July
1990. Imports from the Mediterranean countries
in-creased substantially (+13.8%), and imports from the
OPEC countries by 4.7%, while imports from the ACP
countries slumped (-19.9%). The increase in exports
to the developing countries remained limited
(+4.4%), following a very good month in July. Exports
to the OPEC countries were nearly 10% above the
August 1990 level. The increases in Community
ex-ports to the Mediterranean countries and the Asian
NICs were below 4%. Exports to the ACP countries
fell by 2.5% in August 1991 from the August 1990
level.
The Community's balance of trade with Central and
Eastern Europe improved by 0.6 billion ecus
be-tween August 1990 and August 1991 and was thus
more or less in equilibrium. The rates of increase in
trade were very high following the unification of
Ger-many in October 1990.
GR . II - EXTRA TRADE BALANCE (MAIN PARTNERS)
(BIO ECU)
JAPAN
JAPAN
JAPAN
INDUSTRIALIZED THIRD
COUNTRIES
-United States
-Japan
-EFTA
DEVELOPING COUNTRIES
-AsianNICs(2)
-OPEC
- Mediterranean Basin
-ACP
COUNTRIES IN MIDDLE
AND EASTERN EUROPE
EXTRA-EC
whoee
INDUSTRIALIZED THIRD
COUNTRIES
- United States
-Japan
-EFTA
DEVELOPING COUNTRIES
-AsianNICs(2)
-OPEC
- Mediterranean Basin
-ACP
COUNTRIES IN MIDDLE
AND EASTERN EUROPE
INTRA-EC
EXTRA-EC
whoee
INDUSTRIALIZED THIRD
COUNTRIES
-United States
-Japan
-EFTA
DEVELOPING COUNTRIES
- Asian NCs (2)
-OPEC
- Mediterranean Basin
-ACP
COUNTRIES IN MIDDLE
AND EASTERN EUROPE
-100,0
59,7
18,4
10,0
23,2
31,1
6.3
9,7
9,1
4,3
6,5
-100,0
59,8
18,2
5,4
26,5
32,0
5,5
8,4
10,9
4,0
6,5
-222
-5,6
-25,2
5,4
-5,9
-3.7
-5,8
3.5
-3.0
-3,1
15.2
13,4
22,4
11.3
13,2
17,6
8.3
282
23,1
11,7
16,4
15,5
13,8
12,0
8,7
24,1
12,0
15,5
16,4
12,3
14,9
6,9
24,3
(1 ) External Trade Statistics (Imports CIF, Exports FOB).
-25,5
-12,5
-17,0
'
-8,6 -5,9 -7,6 '
-23,5
-6,4 -8,2 '
2,8 -0,4 -0,9 '
-9,5 -5,3 -2,6 '
-3,1 -1,4 -0,8 '
-9,5 -3,4 -1,4 '
3,3
-0,4
0,7
"
-3,5 -1,3 -0,6 '
-2,9 -1,0 -0,9 '
-16,0 -36,3 '
-6,5 -16,0 '
-15,2 -19,6 '
3,4 -1,1
-3,4 -9,0 '
-1,4 -3,0
-3,3 -5,8 '
3,4 0,8 '
-1,1 -2,3 "
-0,9
-0,3
-2,0
0,8
-1,8
-0,5
-0,9
0,3
-0,3
-2,9 -2,4 " -0,7
IMPORTS
% change on the corresponding period of the previous year
3,6 3,0 10,0 '
2,0 0,7 8,7 '
1,8 -3,0 8,7
- 0 2 5,5 16,1
5,9 2,4
4,9
5,0 1,7 9,9
-1,3 12,5 18,5
10,1 3,7 16,9
13,8 5,1
8 2
2,7 3,3 6,6
10,1 282 18,9
2,7 8,0 '
2,3 6,6
3,7 6,5
-0,7 1 2 2
5,3 3,9
2,4 6,7
-2,9 16,2
5,1 11,6
8,8 9,1
-3,6 3,6
3,7 22,4
2,7
-0,0
0,9
-1.9
5,4
4,6
-0,9
9,1
-0,7
7.5
9,7
6,3
5,3 6,7 " 6,6
6,5
' 4,9
EXPORTS
%
change on the corresponding period of the previous year
1,6 -€.6 -0,7
0,9
-β,1 -5,1
-1,9 -18,7
-8,7
7,5 -8,8 -2,4
3 2 -2,6 -4,7
2,5 -7,7 3,0
1,5 -3,4 13,7
12 -7,1 4,1
12,1 -2,1 -2,4
0,1 -13,0 -8,5
12,6 19,9 30,1
4,0 -1,4
3,8 -4,9
1,8 -11,2
10,9 -4,6
6,0 -2,4
6,1 0,7
3.8 7,7
8,1 2,6
15,7 -0,9
3,0 -6,7
3,8 29,3
-0.0
0,4
-0,5
-3,0
3.3
1,7
-62
4,8
4,1
11,3
-10,0
(2) Asian NICs include the following countries: Singapore, South Korea, Taiwan and Hong Kong.
-2,5 '
-0,9 '
-2,5
0,5
-1,4
-0,7
-0,8
0,1
-0,1
-0,1 '
4,7
5,9
6,5
9,8
0,4
0 2
8 2
4.7
13.8
-19,9
9,6
2,3 '
22
-2.6
-4,6
-7,1
-2,7
4,4
2,6
9,8
3,8
-2.5
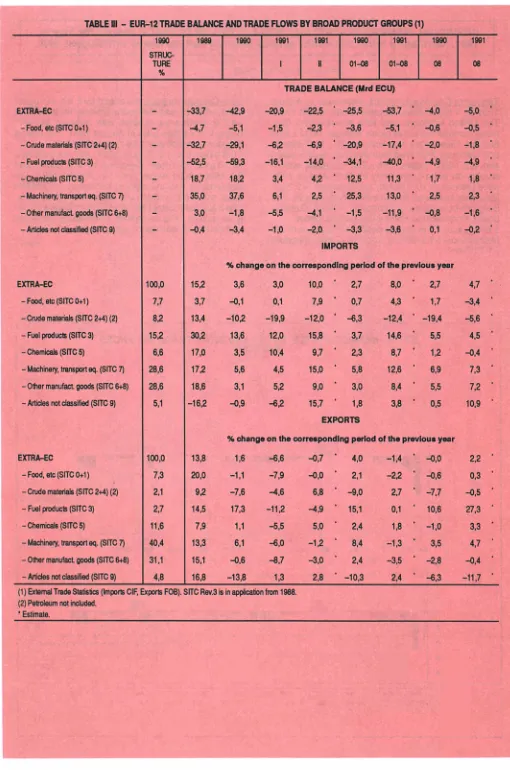
[image:13.595.55.561.31.786.2]The deterioration in the extraCommunity balance of
trade in August 1991 compared with August 1990 (1
billion) should be seen in conjunction with the dete
rioration of 0.8 billion in the balance for other manu
factured goods (SITC 6+8). The balances for
machinery/transport equipment (SITC 7) and articles
not classified (SITC 9) decreased slightly. The situ
ation regarding the other groups improved slightly.
The energy bill remained stable, in spite of a substan
tial fall in the Community's energy supply costs be
tween August 1990 and August 1991.
Imports of other manufactured goods and ma
chinery/transport equipment increased by 7%, which
was a reduction in the rate recorded since April.
Exports of machinery/transport equipment increased
by 4.7% in August 1991 over August 1990, but their
cumulated level forthe first eight months of 1991 was
1.3% below the corresponding period in 1990. The
situation regarding other manufactured articles ap
peared more critical, being one of stagnation with
reference to the August 1990 level, and the cumu
lated level of exports for the period JanuaryAugust
1991 was 3.5% below the level forthe same period
in 1990.
Imported energy products (SITC 3) were 4.5% higher
in August 1991 than in August 1990, in spite of a
substantial fall in the Community's oil bill in August
1991. The political tension in August 1990 and the
subsequent price explosion were certainly factors in
reducing the volumes of imports. In August 1991,
when the Community's oil bill was more reasonable,
imports may have increased in volume terms.
Imports of chemicals (SITC 5) remained unchanged
in August 1991, but exports rose by 3.3% compared
with August 1990. This item is a reliable pillar of
growth in Community exports, and was the only
relatively important item to exhibit a favourable trend
in the first eight months of 1991 compared with the
corresponding period in 1990. Imports of food, etc.
(SITC 0+1) fell by 3.4% in August 1991, while extra
Community exports remained unchanged.lmports of
crude materials (SITC 2+4) fell by 5.6% compared
with August 1990.
GR. Ill
EXTRA TRADE BALANCE (PRODUCT GROUPS)
(BIO ECU)
ManufacUres
Β
*■
30
15
0
•15
•30
<5
«
30
1 5 · ·
Prim.goods
Fuels
•30 ■
Maula aures
Prim.goods
■s·
Manufactures
Priiagoods
Fuels
90
91
-Food, etc (SITC0+1)
- Crude materials (SITC 2+4) (2)
-Fuel products (SITC3)
-Chemicals (SITC 5)
- Machinery, transport eq. (SITC 7)
- Other manufacl goods (SITC 6+8)
- Articles not classified (SITC 9)
EXTRA-EC
-Food, etc (SITC 0+1)
- Crude materials (SITC 2+4) (2)
- Fuel products (SITC 3)
- Chemicals (SITC 5)
- Machinery, transport eq. (SITC 7)
- Other manufacl goods (SITC 6+8)
- Articles not classified (SITC 9)
EXTRA-EC
-Food, etc (SITC 0+1)
- Crude materials (SITC 2+4) (2)
-Fuelproducts (SITC3)
-Chemicals (SITC 5)
- Machinery, transport eq. (SITC 7)
- Other manufact goods (SITC 6+8)
- Articles not classified (SITC 9)
-—
100,0
7,7
8,2
152
6,6
28,6
28,6
5,1
100,0
7,3
2,1
2.7
11,6
40,4
31,1
4,8
-4,7
-32,7
-52,5
18,7
35,0
3,0
-0,4
152
3,7
13,4
30,2
17,0
172
18,6
-16,2
13,8
20,0
9 2
14,5
7,9
13,3
15,1
16,8
-5,1
-29,1
-59,3
18,2
37,6
-1,8
-3,4
-1,5 -2,3 '
- 6 2 -6,9 '
-16,1 -14,0
'
3,4 4 2
'
6,1
2,5
'
-5,5 -4,1 '
-3,6
-5,1
'
-20,9 -17,4 '
-34,1 -40,0 '
12,5 11,3 '
25,3 13,0 '
-1,5
-11,9 '
-0,6
-2,0
-4,9
1.7
2,5
-0.8
- 1 , 0 - 2 , 0 ' -3,3 -3,6 ' 0,1
IMPORTS
%
change on the
c o r r e s p o n d i n g
period of the prevloua year
3.6
-0,1
-10,2
13,6
3.5
5,6
3,1
-0.9
3,0
10,0
'
0,1
7,9
-19,9 -12,0
12,0 15,8
10,4
9,7
4,5 15,0
5 2 9,0
2,7 8,0
0,7 4,3
-6,3 -12,4
3,7
14,6
2.3 8.7
5,8
12,6
3,0 8,4
2,7
1,7
-19,4
5,5
12
6,9
5,5
- 6 2 15,7
' 1,8
3,8
' 0,5
EXPORTS
% change on the corresponding period of the prevloua year
1,6
-1.1
-7,6
17,3
1,1
6,1
-0,6
-13,8
-6.6 -0.7
-7,9 -0,0
-4.6 6.8
-11.2 -4,9
-5,5 5,0
-6,0 -1,2
-8,7 -3,0
4,0 -1,4
2,1 - 2 2
- « , 0
2,7
15,1 0,1
2,4 1,8
8,4 -1,3
2,4 -3,5
-0,0
-0,6
-7,7
10,6
-1,0
3,5
-2,8
1,3 2,8 -10,3 2,4 -6,3
-0,5 '
-1,8 "
-4,9 "
1,8 '
2,3 '
-1,6 '
-0,2 '
4,7
-3,4
-5,6
4,5
-0,4
7,3
7,2
10,9 '
2,2
0,3
-0,5
27,3
3,3
4,7
-0,4
-11,7
(1 ) External Trade Statistics (Imports CIF, Exports FOB). S ITC Rev.3 is in application from 1988.
(2) Petroleum not included.
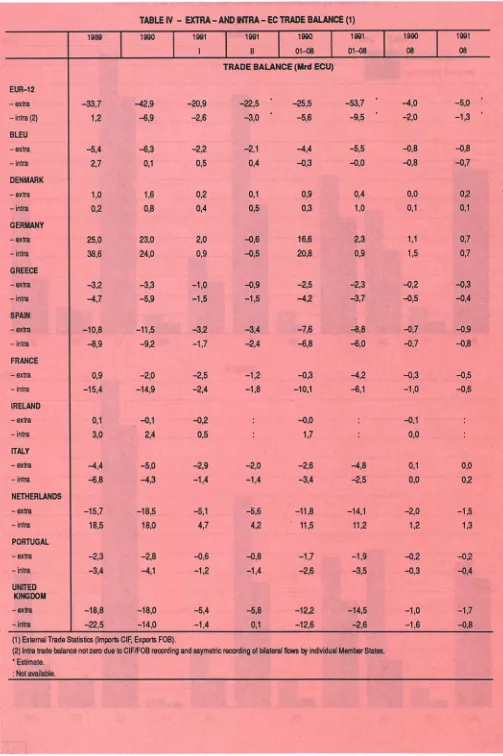
[image:15.595.51.561.25.795.2]The extraCommunity deficit increased in August
1991 by 1 billion ecus compared with August 1990.
The United Kingdom, and to a lesser extent Ger
many, contributed to this result, with falls of 0.7 billion
and 0.4 billion ecus respectively. The Netherlands
and Denmark improved their positions by 0.5 billion
and 0.2 billion respectively. The countries with a
surplus on extraCommunity trade in August 1991
were Germany (+0.7 billion) and Denmark (+0.2 bil
lion). Italy balanced its extraCommunity trade. The
BelgiumLuxembourg Economic Union, Greece,
Spain, Portugal and France had deficits below
1 billion ecus. The largest deficits were those of the
Netherlands (1.5 billion) and the United Kingdom
(1.7 billion).
IntraCommunity trade increased by 2.3% in August
1991, albeit by less than extraCommunity imports at
+4.7%. Germany's surplus was reduced by half,
falling to 0.7 billion ecus in August 1991. The United
Kingdom's deficit was also reduced by half
(0.8 billion ecus) in August 1991, and the balances
for France and Italy improved by 0.4 billion and
0.2 billion ecus respectively. In August 1991, the
Netherlands had the highest surplus at +1.3 billion
ecus, followed by Germany with +0.7 billion ecus.
The trade balances of Italy and Denmark were slight
ly in surplus. The remaining Community countries
had deficits of less than 1 billion ecus.
GR
.
IV
MEMBER STATES' EXTRA AND INTRA TRADE BALANCES
(BIO ECU)
rwm~
E C
BL
E X T R A
□
DK
0 7 / 0 0
G R
o a s i
F
I N T R A
N L
Ρ
■
08/Θ1
EUR-12
-extra
-intra (2)
BLEU
-extra
-intra
DENMARK
-extra
-intra
GERMANY
-extra
-intra
GREECE
-extra
-intra
SPAIN
-extra
-intra
FRANCE
-extra
-intra
IRELAND
-extra
-intra
ITALY
-extra
-intra
NETHERLANDS
-extra
-intra
PORTUGAL
-extra
-intra
UNITED
KINGDOM
-extra
-intra
-33,7
12
-5,4
2,7
1,0
0,2
25,0
38,6
-3,2
-4,7
-10,8
-8,9
0,9
-15,4
0,1
3,0
^»,4
-6,8
-15,7
18,5
-2,3
-3,4
-18,8
-22,5
-42,9
-6,9
-6,3
0,1
1,6
0,8
23,0
24,0
-3,3
-5,9
-11,5
- 9 2
-2,0
-14,9
-0,1
2,4
-5,0
-4,3
-18,5
18,0
-2,8
-4,1
-18,0
-14,0
-20,9
-2,6
-2,2
0,5
0 2
0,4
2,0
0,9
-1,0
-1.5
-3.2
-1,7
-2,5
-2,4
- 0 2
0,5
-2.9
-1.4
-5.1
4.7
-0,6
- 1 2
-5.4
-1,4
-22,5
-3,0 "
-2,1
0,4
0,1
0,5
-0,6
-0,5
-0,9
-1.5
-3,4
-2,4
- 1 2
-1,8
:
:
-2,0
-1,4
-5,6
4 2
-0,8
-1.4
-5,8
0,1
-25,5
-5,6
-4,4
-0,3
0,9
0,3
16,6
20,8
-2,5
- 4 2
-7,6
-6,8
-0,3
-10,1
-0,0
1.7
-2,6
-3,4
-11,8
11,5
-1,7
-2,6
-12,2
-12.6
-53,7
-9,5
-5,5
-0,0
0,4
1,0
2,3
0,9
-2,3
-3,7
-8,8
-6,0
- 4 , 2
-6,1
:
:
-4,8
-2,5
-14,1
112
-1,9
-3.5
-14,5
-2,6
-4,0
-2,0
-0,8
-0,8
0,0
0,1
1,1
1,5
-0,2
-0,5
-0,7
-0,7
-0,3
-1,0
-0,1
0,0
0,1
0,0
-2,0
12
- 0 2
-0,3
-1.0
-1.6
-5.0
-1,3 '
-0,8
-0,7
02
0,1
0,7
0,7
-0,3
-0,4
-0,9
-0,8
-0,5
-0,6
:
:
0,0
0,2
-1.5
1,3
-0,2
-0,4
-1.7
-0,8
(1) External Trade Statistics (Imports CIF, Exports FOB).
(2) Intra trade balance not zero due to C IF/FOB recording and asymétrie recording of bilateral flows by individual Member States.
' Estimate.
[image:17.595.60.563.29.785.2]120
100
Mrd ECU
160
Export
220
160
100
70
50
30
20
220
160
100
70
50
Be I g I um & L u x e m b o u r g
■ ■ ■ · ι · ■ ' ■ ■ I ■ ■ ' ' ■ , I
30-20
1989
1990
1991
G r e e c e
Ι , ι I . . 1 I , . 1 ι
1989
1990
1991
220
160
100
70
50
30
20
220-160
100
70
50
30
20
I N T R A E C TRADE (EUR
1 2 )
D e n m a r k
■ I t ■ I ■ » Ι ι ι Ι ι ι Ι ι ι Ι ι ι Ι ι ι Ι ι ι Ι ι ι Ι ι ι Ι ι
1989
1990
1991
S p a i η
ι Ι ι ι Ι ι ι Ι ι ι Ι ι . Ι ι ι Ι ι ι 1 ι ι 1 ι ι Ι ι ι 1 , ■
FR of
G e r m a n y
220
1601100
-70
50
30
20
220
160-100
7 0
5 0
-30
■ Ι ι ι I I t Ι ι Ι Ι ι ι Ι ι ι Ι ι ! Ι ι ι Ι ι ι Ι ι ] Ι t ι Ι ι
1989
1990
1991
20
1989
1990
1991
F r a n c e
I t 1 , 1 1 1 I ■ ■ I I 1 I I I I I I I I I I 1 I I I I I I 1 I I I
1989
1990
1991
220
160
1UU
70
50
30
I r e i and
^ Λ Λ ^ Λ Λ Α ^
ι ' ι 1 I , , Ι ι , I , , Ι ι ι
1989
1990
1991
220
160
100
70
50
30
20
I t a l y
1 1 ι ι Ι ι ι Ι ι ι Ι ι ι Ι ι ι 1 ι ι Ι ι ι Ι ι ι Ι ι ι Ι ι ι Ι ι
220
160
100
7 0
5 0
-30
N e t h e r I a n d s
1989
1990
1991
20
t ι 1 ι ι Ι ι ι Ι ι ι Ι ι ι Ι ι ι Ι ι ι Ι ι ι 1 ι ι Ι ι ι Ι ι ■ 1 ■
1989
1990
1991
220
160
100
70
50
30
20
Por t u g a l
, ' ι ι Ι ι ,1 ι Ι ι i l ι ι
1989
1990
1991
220
160
100
70
50
30
20
Un 11 ed K l n g d o m
ι 1 ι ι ι ι ι ι ι ι Ι ι ι Ι ι ι Ι ι ι Ι ι ι Ι ι ι Ι ι ι ! ι ι Ι ι
100
70
50
30-20L
i l i . l i Ι , ι Ι ι , Ι , ,1989
1990
1991
G r e e c e
100
70
50
30
20
' ι ' ι ' ' ι ■ ' ' ' I ' ι ' ' ' ' ■ ' ' ' ' I ' ' ' ' ι ' ' * ' ■
1989
1990
1991
220 Γ
160
100
70
50
30
20
1989
1990
1991
Spa i η
■ ' ' ' ' ■ ■ ' ■ ι I ■ ■' ■■ ' ■ ■ ' ' ' I ■ ' ' ■ ■ ' ' ■ ' '
100
7 0
5 0
-
30-20
ι ι Ι ι ι Ι ι ι Ι t ι Ι ι ι Ι ι ι Ι ι ι Ι ι ι Ι ι ι Ι ι ι Ι ι ι Ι ι ι220
160
100
70
5 0
-30
1989
1990
1991
F r a n c a
1989
1990
1991
20
■ ■ ι ' ' ' ■ ' ι ■ ■ 1 ' ■ ι ' ' ι ' ■ 1 ' ■ Ι ■ ■ ' ' ' ι ' ■ ι ■ ■
1989
1990
1991
220160
-100
70
50
30-20
LI re I and
' ' ■ ι ' ι ■ ' ■ ■ I ■ ' ' ■ ■ ' ■ ■ ' ■ ' 1 ' ■ ' ' ι ' ■ ■ ' ι
19Β9
1990
1991
220 Γ
160
100
70
50
30
20
Ι t a I y
^ Α ^ ^ ^
ι Ι , ι Ι , ι Ι ι , Ι ι , Ι ι ι Ι , Ι ,
1989
1990
1991
220-
180-100
70
50
30
20
Ne t h e r Ι ands
■ I ' ι Ι ι ■ ' ' ■ I ' ' ' ■ ' ' ■ ■ ' ■ ι Ι I ■ ' I I ' ■ I ' ■ I
1989
1990
1991
220"
160
-100
70
50
30
20
Por t u g a I
220 Γ
160
100-70
50
30
' Ι ι ' ' Ι ι .1 ι ι Ι ι .1 , ,
1989
1990
1991
20
Un Ι t e d K l n g d o m
■ Ι ι ■ Ι ι ι Ι ι ι Ι ι ι Ι 1 ι ι Ι ι ι Ι ι ι Ι ι ι Ι ι
1989
1990
1991
Values in Mio ECU
1000 1010 1011 1020 1021 1022 1023 1028 1030 1031 1032 1033 1038 1060 1070 1090 1051 1053 1057 1058 024 028 030 032 036 038 043 046 048 052 056 060 062 064 066 068 204 208 212 216 220 248 268 272 276 288 302 314 318 322 330 346 352 372 373 382 388 400 404 412 436 442 448 453 458 462 480 484 496 500 504 508 512 520 524 528 600 604 608 616 624 628 632 640 644 647 649 653 662 664 666 669 680 700 701 706 708 720 728 732 736 740 743 Partner countries WORLDIntra-EC (EUR 12)
Extra-EC
Class 1
EFTA Other West. Europe USA and Canada Other class 1
Class 2
ACP (68 countries)
DOM TOM
Other class 2
Class 4
Class 5 Miscellaneous Mediterranean Basin OPEC
ASEAN Latin America
Main countries :
Iceland N o r w a y S w e d e n Finland Switzerland Austria Andorra Malta Yugoslavia Turkey Soviet Union Poland Czechoslovakia Hungary Romania Bulgaria Morocco Algeria Tunisia Libya Egypt Senegal Liberia Ivory Coast Ghana Nigeria Cameroon G a b o n C o n g o Zaire Angola Kenya Tanzania Reunion Mauritius Z i m b a b w e South Africa (1) United States ol America Canada
Mexico Costa Rica P a n a m a C u b a B a h a m a s Guadeloupe Martinique Colombia Venezuela French Guiana Ecuador Peru Brazil Chile Paraguay Uruguay Argentina Cyprus Lebanon Syria Iran Israel Jordan Saudi Arabia Bahrein Qatar
United Arab Emirates Oman Yemen Pakistan India Bangladesh Sri Lanka Thailand Indonesia Malaysia Singapore Philippines China South Korea Japan Taiwan Hong Kong Macao 1988 930 694 540 833 387 891 238 898 90 653 10 907 76 765 60 573 116 617 17 541 1 363 740 96 973 23 487 7 486 1 869 30 196 31 851 12 203 23 047 731 12 507 21 965 8 996 29 572 16 881 29 390 5 892 4 346 12 990 3 361 2 211 2 158 2 234 462 2 271 4 864 1 527 5 223 1 646 384 679 1 6t5 497 2 876 1 105 1 092 403 1 284 713 532 163 128 667 603 12 528 68 349 8 415 2 466 355 400 374 113 133 166 1 322 1 155 28 328 684 9 329 2 187 366 884 2 624 400 112 421 3 106 2 885 121 5 470 109 68 649 316 1 230 3 266 371 349 2 966 2 134 2 687 2 993 1 209 7 005 7 240 41 618 8 067 6 317 494 1989 1073 SS2 624 488 446 716 270 893 102 589 13 436 93 472 61 396 137 113 19 597 1 413 878 115 225 27 348 9 716 2 347 37 174 40 843 15 173 26 047 779 15 365 25 406 9 918 32 029 19 092 33 568 6 997 5 536 15 166 3 858 2 558 2 587 2 548 531 2 674 5 848 1 960 6 304 2 441 413 1 055 1 622 642 3 472 1 096 1 002 569 1 348 538 588 207 no 718 752 8 185 83 660 9 812 2 760 397 401 433 151 122 169 1 525 1 559 72 326 1 040 10 446 2 752 427 659 2 787 524 101 775 5 352 3 197 102 6 666 98 121 1 553 144 1 271 4 181 427 419 3 362 2 553 3 507 4 023 1 325 9 149 6 953 46 337 9 259 6 432 503 1990 1129 055 663 797 462 720 276 380 108 597 14 648 94 591 58 545 143 948 20 125 1 588 712 121 523 29 216 11 095 2 S3S 42 298 44 982 16 748 25 356 936 16 465 25 432 10 438 34 338 20 989 36 649 7 684 5 943 16 749 5 278 2 786 3 004 1 617 593 3 043 6 940 2 250 7 888 2 299 411 702 1 677 730 4 386 1 379 1 095 602 1 142 1 092 520 177 125 756 577 5 929 85 182 9 409 2 947 433 490 325 214 97 194 1 465 1 784 75 354 803 9 203 2 617 445 567 3 474 581 97 1 239 5 798 3 467 92 Β 224 90 74 1 509 153 1 461 4 553 501 440 4 105 2 863 3 606 4 694 1 257 10 603 6 557 46 224 9 159 5 916 519 II 278 704 162 170 115 929 71 576 26 695 3 335 25 309 16 23B 34 329 4 912 369 228 28 820 7 286 2 337 606 9 508 9 812 3 666 7 041 194 3 971 6 753 2 608 8 247 4 922 7 136 1 751 1 366 4 129 1 015 649 618 696 126 678 1 638 470 1 569 625 110 227 437 138 782 290 255 133 364 86 159 59 33 177 180 2 191 22 600 2 708 747 118 118 115 66 29 49 387 453 22 108 336 2 804 765 116 111 678 142 21 221 1 058 824 27 1 307 24 36 274 25 319 1 132 109 107 845 637 839 1 010 319 2 187 1 710 12 174 2 383 1 462 97 1989 III 253 178 144 712 107 785 63 717 23 808 3 133 21 441 15 335 34 464 4 782 280 234 29 168 6 565 2 636 682 8 919 9 834 3 834 6 895 205 3 851 5 609 2 339 7 260 4 544 10 139 1 645 1 266 3 578 928 508 643 679 121 658 1 336 467 1 671 579 103 258 386 162 803 247 245 163 343 131 142 43 27 209 192 2 037 19 077 2 364 694 80 90 95 31 23 34 384 390 31 57 263 2 886 632 175 138 885 121 21 209 1 423 756 24 1 5B1 25 37 299 32 294 981 102 95 822 617 878 1 042 341 2 505 1 829 11 614 2 434 1 798 170
I m ρ
IV 281 932 166 693 114 679 69 363 27 107 3 495 23 437 15 324 35 181 5 189 339 229 29 424 7 129 2 473 561 9 780 11 466 3 905 6 132 189 3 910 6 742 2 504 8 701 5 061 8 145 1 810 1 448 3 987 1 011 717 740 574 150 689 1 531 548 1 742 678 107 291 401 173 1 040 269 327 147 328 158 145 39 17 190 194 1 986 21 036 2 401 645 100 107 108 26 22 40 366 382 11 89 226 2 426 664 102 188 622 109 26 227 1 478 769 27 2 009 19 28 526 25 307 971 111 118 804 648 939 1 141 304 2 330 1 644 11 671 2 242 1 560 118
o r t s
362 909
222 029 96 434 12 886 81 933 30 776 113 634 15 551 7 254 1 404 89 425 19 4813 808 35 423 31 198 10 689 13 227
625
8 515 21 132 7 767 35 881 22 514 643 843 5 714
5 225 10 114
2 756 2 169 2 355
615
1 406 2 609 3 704 2 003 2 706 3 676
537 453 988
412 2 166 677 1 017
317 725 626 811 377
1 039
313 283
6 360 71 809 10 124 2 296
128 390 511 188 837 839 778
2 406 379
333 403
3 122
851
135 215
1 311
1 053
851
659 2 873 4 712 1 031 7 572 437 386 2 288 826 1 606 5 638
403
375
2 072 1 934 1 385 4 067
912 5 802 4 392 17 020 4 460
413 010 248 718 107 968 14 947 88 675 37 128 131 197 16 627 8 307 1 683 104 580
24 209 7 216 4 557 40 699 35 031
14
110
15 109
592
8 607 24 058
9 372 40 071 25 268 773 1 064 7 031 5 609 12 603 3 945 2 385 2 988
689
1 477 3 226 4 715 2 531
2
911
3 764
641 480
1 142 453 2 216 758
722 345 787 819 891 421
1 150
395 353
6 450 78 020 10 655 3 511 166 563 587 133 962 896 865
1 667
672 391 371
3 841 1 207
117 252
1 161
1 438
829
780 3 286
5
101
905
8 805
670 444
3 110 742
1 460 7 083
445
391
2 765 2 039 2 049 5 486 1 197 6 369 5 207 21 130 5 206
419 813 250 920 111 370 18 773 85 859 34 917 134 425 16 649 8 532 1 679 107 564 23 308 6 108 4 742 45 633 35 439 16 083 15 067
638
9 306 23 941 9 165 41 340 26 981 874 1 210 8 521 7 722 13 614 4 934 2 909 3 220 1 415 1 034 3 562 4 976 2 971 2 660 4 153 684 1 008 832
501
2 501 736
545 350 732 843 797 401
1 176 391
336
4 090 76 561 9 298 3
166
564 665 307
1 061 988
812
1 692 910
328
334 3 653 1 170
175 233
1 238 1 280
756
845 5 021 5 240 830 7 756
456 455
3 567 694 1 428 6 019
402 347
3 429 2 841 2 497 5 689 1 247 5 318 6 061 22 721 4 917
104 766 63 705 27 537 4 005 22 675 9 489 32 717 4 088 2 078
405
26 146 6 091 1 710 1 151 10 352 8 548 3 410 3 649
142
2 173 6 089
2 403 10 331 6 399
195 277
1 908 1 478 3 110 1 038 566
772 184 370
852
1 057
672 736 905 165 111 311 125 556 184 158 76 225 190 198 117 297 102 90
1 658 19 930 2 745
848 37 139 163
31
235 231 228 387 126 108 82 890 288 26 65 324
408 127 186
796 1 316
206
2 046 183
113 848 190
397
1 860
102 123 753 524 469
1 332
278
1 483 1 333 5 306 1 335
100 162 60 387 25 510 3 588 21 922 9 368 32 019
3 903 1 986
415
25 716 5 709 1 719 1 255 9 612 8 560 3 749 3 795
157
2 016 5 422 2 212 9 474 6 230 204
256
1 652 1 377 2 905 948
588 739 172 339
737
1 088 577 782 925 133 103 247 97 485 187 213 86 188 197 216 92 279 101
81 1 659
19 363 2 559 890 41
162 138 28 205 189 217 356 226 111
91 1 056 307 30 59 237
311 169 200 776
1 177 169 2 215 129
96 716 230
315
1 731 108
82 648 54 7
537
1 510
314
1 519 1 308 5 418 1 366
111 719 66 625 29 148 4 366 23 432 9 679 35 687 4 588 2 230 473 28 396 7 188 1 772 1 196 11 657 9 764 3 656 4 199
147 2 405 6 678
2 500 10 742 6 675
213 303
2 035 1 697 3 803 1 117 750 848 210 434
902
1 546 716
786
1 016
166
91
272 125 685 206 201 80 199 266 295 108 316 109 108
1 523 20 623
2 809 1 059
47 130 139 34 311 262 230 414 141
91
124
1 048
381 32 66 276
343 298 243
940 1 350 205 2 400
236 137 814 161
365
1 860
121 98 800 562 642
1 423
333
1 560 1 349 5 608 1 385
105 717 63 434 28 339 4 198 21 786 9 111 34 131
4 193 2 104 386 27 448 6 260
11 185 9 016 3 878 3 622
137
2 265 6 244 2 414 10 595 6 683 193
255
1 940 1 699 3 480
901 577 656 287 341
857
1 418 708 633
1 028
171 241 225 120 626 179 126 89 223 225 217 101 281 94
19 292 2 494
121 117 33 256 253 202 352 284 78 107 881 294 33
61
359
340 192 241 956
1 326
334
1 915 182 149 857 153
355
1 645
107 96 847 608 572
1 441
362
1 408 1 606 5 990 1 364
104 350 63 403 28 593 4 766 21 555 8 488 33 286 4 365 1 958
447 26 516 5 805 1 486 1 162 11 546 9 091 3 802 3 467
149
2 426 6 155
2 412 10 724 6 726
221 318
2 195 1 906 2 923 951
587 763 384 179
936
1 294
757 660
1 055
161 552 206 128 625 194 112
81
176 199 210 97 293 107 79
1 115
19 307 2 248
966 42 108 167 29 250 235 223 412 119 76
91
718 287 45 52 233
347 164 193
1 114 1 310
178
1 878
113 113
1 021
165
371
1 342
104 78 767 614 612
1 381
330
1 254 1 477 5 455 1 199
98 238 59 764 25 827 4 384 20 997
8 556 31 570 3 827 1 982 397 25 363 5 152 1 491 1 084 10 394 8 406 3 928 3 712
151
2 143 5 260 2 093 9 702 6 478
227 304
1 866
1 891
2 426 1 003
598 676 247 169
753 992 631 698
1 057
143 27 186 124 597 176 164 90 165 179 185 83 270 101 73
1 020 18 664 2 333
945
42
130 143 214 238 217 176 432 224 74 77
1 001
263 41
59 281
280 193
178 1 297 1 199 146 1 991
99 90 763 140
339
1 385 106
85 793 707 581
1 429 289 1 293 1 451 5 501 1 079
111 508 64 320 28 612 5 424 21 521 8 762 35 438 4 264 2 489 449 28 237 6 055 1 552 1 399 12 508 8 925
4 475 4 265
201
2 471 6 281
2 245 10 318 7 095
234
333 2 520 2 226 4 785 2 079 1 146 1 124
498 345
1 015 1 272
876
669 1 012
209 189 214 129 652 187 143 90 168 240 185 119 331 90 98 946
19 298 2 223 1 087
42 207 238 30 317 283 211 496 284 99 58
1 053
326 56
61
366
313 206 234
1 654 1 405
172
1 972
62 103 926 236
364
1 647
84 87
1 022 912
731
1 438 266 1 362 1 528 5 775 1 275
98 694 58 30B 27 609 4 517 17 709 8 473 31 492 3 649 2 067 359 25 418 7 530 1 372 1 306 10 953 8 373 4 043 3 437
149
2 248 5 498 2 010 10 416 7 290
199 286
1 891
2 027
3 353 1 833
912 792 341 252
890
1 075 766
657
1 057
157
11
207 121 594 166
144
79 147 185 196 88 284 74 96
1 312 15 676 2 033 932
35 147 189 36 233 224 175 385 231 85 84 785 236 38 50 304
299 210 199
1 724 1 225
91 2 111
97
159 729 190 92 351
1 378
77 89 818 702 631
1 382 299 1 101 1 614 5 464 1 241
103 618 60 237 27 252 4 598 19 849 8 540 34 257 3 992 2 192
425
27 647 7 550 1 573 1 130 11 258 9 443 4 143 4 060
182 2 349 5 485 1 I 10 215
7 160 220
332
2 002
1 925 3 109 2 017
873
942 316
261
958
1 096 769
660 877 140 126 252
134 745
14
186 82 111 191
1
103 316 90 110
1 418 17 661 2 1 1 103
64 149 191 86 238 235 241 470 189
91
117 898 260 37 62 347
323 293
206 1 756 1 407
135
2 371 136
147
1 095
164 107 465
1 108 80 86 996 739 682
1 401
266
1 324 1 786 5 336 1 469
Extra - EC Class 1
EFTA
Other West. Europe USA and Canada Other class 1
Class 2
ACP (68 countries) DOM
TOM Other class 2
Class 4 Class 5 Miscellaneous
Mediterranean Basin OPEC
ASEAN Latin America
Main countries :
Iceland Norway Sweden Finland Switzerland Austria Andorra Malta Yugoslavia Turkey Soviet Union Poland Czechoslovakia Hungary Romania Bulgaria Morocco Algeria Tunisia Libya Egypt Senegal Liberia Ivory Coast Ghana Nigeria Cameroon Gabon Congo
Zaire
Angola Kenya Tanzania Reunion Mauritius Zimbabwe South Africa (1) United States of America CanadaMexico Costa Rica Panama Cuba Bahamas
Guadeloupe
Martinique Colombia Venezuela French Guiana Ecuador Peru Brazil Chile Paraguay Uruguay Argentina Cyprus Lebanon Syria Iran Israel Jordan Saudi Arabia Bahrein QatarUnited Arab Emirates Oman
Values in Mio ECU
1000 1010 1011 1020 1021 1022 1023 1028 1030 1031 1032 1033 1038 1060 1070 1090 1051 1053 1057 1058 024 028 030 032 036 038 043 046 048 052 056 060 062 064 066 068 204 208 212 216 220 248 268 272 276 288 302 314 318 322 330 346 352 372 373 382 388 400 404 412 436 442 448 453 458 462 480 464 496 500 504 508 512 520 524 528 600 604 608 616 624 626 632 640 644 647 649 853 662 664 666 669 680 700 701 706 708 720 728 732 736 740 743 Partner countries WORLD Intra-EC (EUR 12) Extra-ECClass 1
EFTA
Other West. Europe USA and Canada Other class 1 Class 2
ACP (68 countries) DOM
TOM Other class 2
Class 4 Class 5 Miscellaneous Mediterranean Basin OPEC ASEAN Latin America
Main countries .' Iceland Norway Sweden Finland Switzerland Austria Andorra Malta Yugoslavia Turkey Soviet Union Poland Czechoslovakia Hungary Romania Bulgaria Morocco Algeria Tunisia Libya Egypt Senegal Liberia Ivory Coast Ghana Nigeria Cameroon Gabon Congo Zaire Angola Kenya Tanzania Reunion Mauritius Zimbabwe South Africa (1) United States ol America Canada Mexico Costa Rica Panama Cuba Bahamas Guadeloupe Martinique Colombia Venezuela French Guiana Ecuador Peru Brazil Chile Paraguay Uruguay Argentina Cyprus Lebanon Syria Iran Israel Jordan Saudi Arabia Bahrein Qatar
United Arab Emirates