White Rose Research Online URL for this paper:
http://eprints.whiterose.ac.uk/118230/
Version: Accepted Version
Article:
Fyllas, NM, Bentley, LP, Shenkin, A et al. (17 more authors) (2017) Solar radiation and
functional traits explain the decline of forest primary productivity along a tropical elevation
gradient. Ecology Letters, 20 (6). pp. 730-740. ISSN 1461-023X
https://doi.org/10.1111/ele.12771
© 2017 John Wiley & Sons Ltd/CNRS. This is the peer reviewed version of the following
article: Fyllas, NM, Bentley, LP, Shenkin, A et al. (17 more authors) (2017) Solar radiation
and functional traits explain the decline of forest primary productivity along a tropical
elevation gradient. Ecology Letters, 20 (6). pp. 730-740., which has been published in final
form at https://doi.org/10.1111/ele.12771. This article may be used for non-commercial
purposes in accordance with Wiley Terms and Conditions for Self-Archiving.
[email protected] https://eprints.whiterose.ac.uk/ Reuse
Items deposited in White Rose Research Online are protected by copyright, with all rights reserved unless indicated otherwise. They may be downloaded and/or printed for private study, or other acts as permitted by national copyright laws. The publisher or other rights holders may allow further reproduction and re-use of the full text version. This is indicated by the licence information on the White Rose Research Online record for the item.
Takedown
If you consider content in White Rose Research Online to be in breach of UK law, please notify us by
For Review Only
! " # $ # %
& ! ' $ # ( ) * + , - . ' /0' ") # ' 1 2 # " #
. !
3 ) , - . ' /0' ") . ! &# 2
# + ) $ 0 " , - . ' /0' ") # ' 1 2 # " #
. !
$ ) 1 2, ' " - . ) & 2 ! ' 1 2 $ + ) /4 , $ * - . ) $ & & ' 0
5 2 3 2 ) # # ' 3 2
6) " , - . " " * " & " ) " " 3 27 8 2
9 ) 3 , - . ' $ 6 ) 2 " . 3 2
( ' ) : !, : + ( - . ) ! ' 3 2
1 ) ! , - . ' " ) # ' 1 2 # 1 ) , - . " " $ ! " 3
; ; ) : , - . " " " $ " " & )
# " ) < + , ! & + - . ) & ' . !
" ) & 2 ' " . !
) , ' " - . ) & 2 ! ' 1 2
) 5 +, $ * - . ) . ' 5 )
# # ' 3 2
5# ) / . , - . ' " ) # ' 1 2 # . ) * ! , - . ' /0' ")
! ) , : + ( - . ) ! ' 3 2
: 2# ) # , $ * - . ) . ' 5
) # # ' 3 2
= 2 6 & ) , - . ' 0 & 2 ' ' "
. ! ) 1 2 #
# ) < ". " , - . ' /0' ") # ' 1 2 # " #
. !
> : "
( 5 " . ) & ! ) ( ) " 2) ( )
1 ! 2) " ) ! ) $ " )
For Review Only
1For Review Only
1
Solar radiation and functional traits explain the decline of forest
1
primary productivity along a tropical elevation gradient
2
3
Nikolaos M. Fyllas1, Lisa Patrick Bentley1, Alexander Shenkin1, Gregory P. Asner2, Owen K.
4
Atkin3, Sandra Díaz4, Brian Enquist5, William Farfan.Rios6, Emanuel Gloor7, Rossella Guerrieri8,12,
5
Walter Huaraca Huasco9, Yoko Ishida10, Roberta E. Martin2,Patrick Meir11,12, Oliver Phillips7,
6
Norma Salinas1,13, Miles Silman6, Lasantha K Weerasinghe11,14, Joana Zaragoza.Castells12,15 and
7
Yadvinder Malhi1
8
1. Environmental Change Institute, School of Geography and the Environment, University of Oxford, 9
Oxford, UK 10
2. Department of Global Ecology, Carnegie Institution for Science, 260 Panama Street, Stanford, CA 11
94305, USA 12
3. ARC Centre of Excellence in Plant Energy Biology, Research School of Biology, The Australian 13
National University, Building 134, Canberra, ACT 2601, Australia 14
4. Instituto Multidisciplinario de Biología Vegetal (IMBIV), CONICET and FCEFyN, Universidad 15
Nacional de Córdoba, Casilla de Correo 495, 5000 Córdoba, Argentina 16
5. Department of Ecology and Evolutionary Biology, University of Arizona, Tucson, AZ 85721, USA 17
6. Department of Biology, Wake Forest University, Winston Salem, NC, USA 18
7. Ecology and Global Change, School of Geography, University of Leeds, UK 19
8. Centre for Ecological Research and Forestry Applications (CREAF), Universidad Autonoma de
20
Barcelona, Edificio C, 08290 Cerdanyola, Barcelona Spain
21
9. Universidad Nacional de San Antonio Abad del Cusco, 733 Avenida de la Cultura, Cusco, 921, Peru 22
10. Centre for Tropical Environmental and Sustainability Science, College of Marine and
23
Environmental Sciences, James Cook University, Cairns, Qld, Australia
24
11. Division of Plant Sciences, Research School of Biology, The Australian National University,
25
Building 134, Canberra, ACT, 2601, Australia
26
12. School of Geosciences, University of Edinburgh, EH9 3FF, Edinburgh, UK. 27
13. Sección Química, Pontificia Universidad Católica del Perú, San Miguel, Lima, Peru 28
14. Faculty of Agriculture, University of Peradeniya, Peradeniya 20400, Sri Lanka 29
15. Geography, College of Life and Environmental Sciences, University of Exeter, Amory Building, EX4 30
4RJ, Exeter, UK 31
32
Type of Article: Letter
33
Running Title: Understanding forest primary productivity along a tropical elevation gradient
34
For Review Only
Key words:? : ) 9 = , ) ? ? 8
1
Scaling Theory, Global Ecosystem Monitoring.
2
Author Contribution: N.M.F. and Y.M. designed the research. L.P.B., A.S, G.P.A., O.K.A., S.D.,
3
B.E., W.F.R., R.G., W.H.H., Y.I, R.E.M., P.M., N.S., M.S, K.W.L.K.W. and J.Z.C. gathered the
4
stand and functional traits data. N.M.F, L.P.B. and A.S analysed the field data. N.M.F developed
5
the model and analysed simulations. N.M.F., L.P.B. and Y.M. wrote the manuscript with
6
contributions from all authors.
7
Data accessibility statement: We confirm that, should the manuscript be accepted, the data
8
supporting the results will be archived in an appropriate public repository and the data DOI will be
9
included at the end of the article.
10
Correspondence: Nikolaos M. Fyllas, Environmental Change Institute, School of Geography and
11
the Environment, University of Oxford, South Parks Road, OX1 3QY, Oxford, UK. Tel: +44 (0)
12
1865 275848. Email: [email protected].
13
Number of words: Abstract: 241 , Main text: 5040
14
Number of references: 59; Number of figures: 4; Number of tables: 1
15
Email address of authors:
16
N.M. Fyllas: [email protected]
17
L.P. Bentley: [email protected]
18
A. Shenkin: [email protected]
19
G. P. Asner: [email protected]
20
O. K. Atkin: [email protected]
21
S. Díaz: [email protected]
22
B. Enquist: [email protected]
23
W. Farfan.Rios: [email protected]
24
E. Gloor: [email protected]
25
R. Guerrieri: [email protected]
26
W.H Huasco: [email protected]
27
Y. Ishida: [email protected]
28
R. E. Martin: [email protected]
29
P. Meir: [email protected]
30
O. L. Phillips: [email protected]
31
N. Salinas: [email protected]
32
M. Silman: [email protected]
33
L. K. Weerasinghe: [email protected]
34
J. Zaragoza.Castells: [email protected]
35
Y. Malhi: [email protected]
36 37
For Review Only
Abstract
1
2
A mechanistic understanding of environmental controls on ecosystem productivity remains
3
surprisingly elusive and controversial. Tropical forest environmental gradients present a particularly
4
rich study system for facilitating insights into the relationships between environment, biodiversity
5
and ecosystem function. In this study, we integrated a generic framework for scaling plant growth,
6
carbon fluxes, and functional trait spectra within an individual.based forest model, to analyse
7
variation in forest primary productivity along a 3.3 km tropical elevation gradient in the Amazon.
8
Andes. The model accurately predicted the magnitude and trends in forest productivity with
9
elevation, with solar radiation and plant functional traits collectively accounting for productivity
10
variation along the gradient. Solar radiation influenced the magnitude of forest productivity with
11
upland sites being less productive, while the variation of plant functional traits (leaf dry mass per
12
area, leaf nitrogen and phosphorus concentration and wood density) with elevation regulated the
13
sensitivity of productivity to changes in elevation. Remarkably, explicit representation of
14
temperature variation with elevation was not required to achieve accurate predictions of forest
15
productivity. The turnover in the plant community and ensuing shift in leaf traits, a possible indirect
16
response to temperature, cancels much of the temperature dependency that is found in single plant
17
measurements of photosynthesis. Light competition is an important process that should be explicitly
18
accounted for in order to accurately simulate forest productivity. Our semi.mechanistic model
19
shows that spatial variation in traits can translate into potentially mapping spatial variation in
20
productivity at the landscape scale.
21
For Review Only
1. Introduction
1
One of the major challenges in contemporary ecosystem science is to understand how ecosystems
2
respond to changes in environmental conditions, and how taxonomic and functional diversity
3
mediate these changes (Lavorel & Garnier 2002; Balvanera et al. 2006). Environmental conditions
4
change both in time and in space, and transects along environmental gradients can provide valuable
5
insights into controls of ecosystem function. Tropical forest environmental gradients present a
6
particularly rich study system (Vazquez & Givnish 1998; Wright 2002), with their high diversity
7
facilitating general insights into the relationships between diversity and function that are not
8
contingent on the characteristics and presence or absence of particular dominant species. More
9
specifically, tropical elevation gradients, with their usual high levels of moisture and year.long
10
growing season, provide “natural laboratories” in which to understand the influence of temperature
11
on ecosystem function without the complicating influence of variation in temperature seasonality
12
and winter dormant seasons (Malhi et al. 2010;Sundqvist et al. 2013).
13
It is valuable to distinguish direct environmental controls on ecosystem productivity from
14
indirect controls mediated through forest structure and composition, as direct and indirect controls
15
can have different response times to environmental change, and determine the degree to which
16
productivity can be estimated from surveying ecosystem composition. Environmental conditions are
17
usually considered direct drivers of ecosystem productivity (Fig 1). Although in most tropical
18
regions temperature is not a limiting factor on productivity, some studies suggest that across sites,
19
tree growth increases with mean temperature (Raich et al. 2006, Cleveland et al. 2011) within the
20
temperature range of currently observed tropical climates. In seasonal tropical forests, rainfall is
21
positively associated with tree growth (Brienen & Zuidema 2005), while other studies identify solar
22
radiation as a key driver of forest productivity across Amazonia (Nemani et al. 2003) particularly
23
during the rainy season (Graham et al. 2003). Soil fertility may be important: in lowland tropical
24
forest, phosphorus (P) availability is considered a key limiting factor of primary productivity
25
(Quesada et al. 2012) whereas in montane regions with colder and younger soils, nitrogen (N) may
26
be the limiting factor (Tanner et al. 1998). In summary, increases in one of the above factors can
27
have positive effect on tree growth (given no other resource limitation), expressing a direct
28
(“proximal”) and short.term effect of environmental conditions on ecosystem productivity (Fig 1).
29
Environmental conditions can additionally have an indirect (“distal”) effect on forest
30
productivity by regulating the structure and/or the species/functional composition of the community
31
(Fig 1). Such effects tend to act on longer temporal scales, where potential feedbacks between
32
structure and functional composition can also take place. Many studies have shown that functional
33
traits systematically vary with water availability (Santiago et al. 2004), soil fertility (Fyllas et al.
34
For Review Only
774B 9 :, A 8 K .? K 710) and trait variation can predict individual.
1
tree growth rate (Poorter et al. 2008) and community productivity (Finegan et al. 2014). However
2
feedbacks between environmental conditions, stand structure and functional composition have also
3
been identified. For example, across Amazonia there exists a structural feedback on productivity,
4
with rich soils favoring low biomass, fast.growing species in contrast to poor soils that favor high
5
biomass slow.growing species (Baraloto et al. 2011; Quesada et al. 2012).
6
Disentangling the role of environmental and biotic controls on tropical forest productivity
7
requires appropriate datasets. In recent years, a large body of data has been emerging from an
8
elevation transect in the Andes and Amazon in SE Peru, including rates of ecosystem carbon
9
cycling (Girardin et al. 2010; Malhi et al. 2017a; Nottingham et al. 2015), forest structure and
10
dynamics (Feeley et al. 2011; Asner et al. 2014a), plant ecophysiology (van de Weg et al. 2009;
11
2012; Bahar et al. 2016) and leaf and wood traits (Asner et al. 2014b; Malhi et al. 2017b). Along
12
this 3300 m gradient there is a steep temperature decrease with increasing elevation, a reduction in
13
solar radiation, and an increase in soil N and P content that drive high species turnover (Neyret et al.
14
2016). This species turnover is associated with shifts in several functional traits including increasing
15
leaf mass per area (LMA) and leaf P concentration with elevation (Asner et al. 2014b). Forest stature
16
and structure vary greatly between lowland and highland plots, resulting in a decline in biomass
17
with elevation and more open forests in the mountains (Malhi et al. 2017a; Asner et al. 2014a).
18
Productivity declines with elevation but with some evidence of a step.change decline near the cloud
19
base (Malhi et al. 2017a). It thus seems that various direct and indirect factors can potentially
20
control forest productivity along the Andes.Amazon gradient. The integration of the available
21
datasets presents a unique opportunity to mechanistically explore the influence of climate, plant
22
functional traits and forest structure on forest productivity.
23
Individual.based vegetation models provide an ideal framework to integrate forest inventory data
24
with ecosystem dynamics theory and to explore how climate, functional traits and stand structure
25
control primary productivity (Purves & Pacala 2008). In particular, by accounting for inter.specific
26
functional variation as well as tree.size variation, the performance of alternative life history
27
strategies can be explored (Moorcroft et al. 2001; Scheiter et al. 2009). Mechanistic, process.based
28
vegetation models apply detailed energy, carbon and water flux algorithms to quantify how key
29
ecosystem processes vary with environmental conditions and tree functional traits, the latter
30
extensively used as predictors of plant processes (Scheiter et al. 2013). For example, LMA and
31
mass.based leaf nitrogen (NLm) and phosphorus (PLm) concentration are the central elements of the 32
leaf economic spectrum and can be used to predict mass.based photosynthetic and respiration rates
33
(Wright et al. 2004; Atkin et al. 2015), while wood density (ρW) and maximum height (Hmax) appear 34
For Review Only
8 : - ! , A 772J + 710).
1
Process.based vegetation models usually implement detailed photosynthetic algorithms (Farquhar et
2
al. 1980) to calculate rates of CO2 assimilation and then allocate C to different plant components 3
(Franklin et al. 2012). However, such models can be challenging to parameterise and
4
computationally expensive to run at individual.tree scale. As an alternative approach, Enquist et al.
5
(2007) suggested a framework that employs a growth equation which integrates functional traits
6
with tree.size and can be used to estimate individual growth rates for each tree in a stand in a much
7
simpler way. In our current study we make changes to an existing vegetation model (TFS, Fyllas et
8
al. 2014) that replace the detailed physiological algorithms with a general trait.based growth
9
equation.
10
The aim of our paper is to apply the TFS model to disentangle the relative importance of climate
11
(direct environmental effects), stand structure and functional traits (indirect environmental effects)
12
in controlling forest productivity along the Andes.Amazon elevation gradient. We initially apply
13
TFS along the gradient and validate its performance against field.based estimates of productivity.
14
We subsequently exploit the model framework to perform a set of randomisation exercises designed
15
to quantify the relative importance of climate, stand structure and functional traits in determining
16
the observed patterns of forest productivity.
17
18
2. Materials and Methods
19
2.1 Study site
20
The study area is located along a 3300 m elevation gradient in the tropical Andes and extends to the
21
Amazon Basin. Across this transect a group of nine intensively monitored 1.ha plots (Table S1.1)
22
was established as part of the long.term research effort coordinated by the Andes Biodiversity
23
Ecosystems Research Group (ABERG, http://www.andesconservation.org) and the ForestPlots
24
(https://www.forestplots.net/) and Global Ecosystems Monitoring Network (GEM;
25
http://gem.tropicalforests.ox.ac.uk/projects/aberg) networks. Five of the plots are montane plots in
26
the Kosñipata Valley, spanning an elevation range 1500 . 3500 m (Malhi et al. 2010), two are
27
submontane plots located in the Pantiacolla front range of the Andes (600 . 900 m) and two plots
28
are found in the Amazon lowlands in Tambopata National Park (200 . 225 m). The elevation
29
gradient is very moist (Table S1.1), with seasonal cloud immersion common above 1500 m
30
elevation (Halladayet al. 2012), and no clear evidence of seasonal or other soil moisture constraints
31
throughout the transect (Zimmermann et al. 2010). Plots were established between 2003 and 2013
32
in areas that have relatively homogeneous soil substrates and stand structure, as well as minimal
33
evidence of human disturbance (Girardinet al. 2014).
34
For Review Only
: ' : - 8 , ) , 8 ::
-1
plots, the net primary productivity (NPP, the rate of biomass production in wood, canopy and fine
2
roots) and gross primary productivity (GPP, the rate of canopy carbon uptake through
3
photosynthesis) were estimated by summation of the measured and estimated components of NPP
4
(litterfall, woody production, fine root turnover and branch turnover) and autotrophic (leaf, wood
5
and fine root) respiration (Malhi et al. 2017a). For the remaining plots, we used measured NPP to
6
estimate GPP applying the mean carbon use efficiency (c=NPP/GPP) of the other plots, separated
7
into cloud forest and submontane/lowland plots. Further details of measurement protocols are given
8
in Malhi et al. (2017a) and summarised in S1.
9
2.2 Model Description
10
The original TFS model is a trait.continua and individual.based model, which simulates the carbon
11
(C) balance of each tree in a stand (Fyllas et al. 2014). Rather than grouping trees into plant
12
functional types, TFS prescribes inter.related joint distributions of functional traits which represent
13
trade.offs of possible plant strategies and responses to environmental conditions. The model is
14
initialised with tree.by.tree diameter at breast height (D) and functional traits data. Three leaf traits
15
(LMA, NLm, PLm), the central components of the leaf economic spectrum, regulate the 16
photosynthetic capacity and the respiration rate of trees. Wood density (ρW) accounts for variation 17
in aboveground biomass (MA), with trees of greater ρW supporting higher biomass. Allometric 18
equations are used to infer tree height (H) and allocation to leaf (ML), stem (MS) and root (MR) 19
biomass. Light competition is approximated using the perfect plasticity assumption (Strigul et al.
20
2008). The carbon and water balance of each tree is estimated on a daily time.step and at the end of
21
each year stand.level GPP and NPP is estimated by summing up the daily individual.tree C fluxes.
22
Here we use a simplified version of TFS (described in S2), where the mechanistic representation
23
of photosynthesis, respiration and C allocation is replaced with the integrative whole.plant growth
24
rate model of Enquist et al. (2007):
25
( )( ) (1)
T L
L L
L
dM c a
A M
dt ω m
= 26
where MΤ is the total plant dry biomass (kg), c the carbon use efficiency (no units), ω the fraction of 27
whole.plant dry mass that is carbon, AL the leaf area specific photosynthetic rate (g C cm.2 per unit 28
time), aL the individual leaf area (cm2), mL the individual leaf mass (g) and ML the total leaf dry 29
mass (kg).
30
Equation (1) is an extension of the classic relative growth rate equation (Hunt 1982), with the
31
basic assumption that whole.plant net biomass growth rate scales isometrically with total plant leaf
32
For Review Only
8 , : - : 8 , : - 9 8 !
1
Metabolic Scaling Theory (MST) suggesting relative invariant power laws and other studies arguing
2
that scaling varies across species and plant sizes (Poorter et al. 2015). Another critique of MST.
3
based growth equations is that they do not take into account resource availability and in particular
4
the vertical distribution of light in forest stands (Muller.Landau et al. 2006; Coomes & Allen 2009).
5
In order to implement equation 1 within TFS and deal with these critiques we 1) used a set of
6
allometric equations with stochastic scaling coefficients estimated from available data and 2)
7
expressed the photosynthetic rate AL as a function of both leaf traits (that vary in a continuous way
8
within and between communities) and irradiance that takes into account competition for light
9
between individuals. In the following paragraphs we describe how the model was constrained with
10
the available field and literature data. A sensitivity analysis of the simulated GPP and NPP for some
11
of the key model parameters is provided in S2.
12
2.2.1 Tree allometry
13
Transect.wide allometric equations of tree height (H) and crown area (CA) as a function of tree 14
diameter were used to define the architecture of each tree in a stand (Shenkin et al. in review). In
15
the model, trees were considered to have a flat.topped circular canopy with an area equal to the
16
allometrically estimated projected crown area.
17
In TFS aboveground tree biomass (MA in kg) is estimated from the Chave et al. (2014) equation 18
that takes into account the diameter, the wood density and the height of a tree. Total leaf biomass
19
was expressed as a power function of MA, parameterised using the BAAD dataset (Falster et al. 20
2015). During simulations we allowed the coefficients of the power functions to vary within their
21
95% confidence interval estimates, with individual trees having different leaf allometries (S2–Tree
22
Allometry).
23
2.2.2 Functional traits and Photosynthesis
24
The photosynthetic rate (AL) is controlled by the leaf functional traits and the available light of each
25
individual. A Michaelis.Menten (MM) model was used for that purpose where:
26
max
(2)
L d
A
I
A
R
k
I
=
−
+
27
with I (Umol m.2s.1) the irradiance at the top of each individual, Amax the maximum gross
28
photosynthetic rate (Umol m.2s.1), k the half saturation coefficient (Umol m.2s.1) and Rd is the non.
29
photorespiratory mitochondrial CO2 release taking place in the light (i.e. respiration in the light)
30
(Umol m.2s.1).
31
For Review Only
? I , ) ,: , !
-1
functional traits (LMA, NL and PL) regulate the parameters of the light response curve (Marino et al.
2
2010). An independent dataset of 136 light response curves and LMA, NL and PL measurements 3
(Atkin et al. 2015; Weerasinghe 2015) was available for 14 study sites along the Andean elevation
4
gradient. These data were used to fit MM light response curves and express their parameters (Amax, 5
k and Rd) as a function of the leaf functional traits (S2.Photosynthesis). An average daily AL is 6
estimated using equation 2 and average daily irradiance, with the total daily AL given after 7
multiplying average AL with the day length. 8
Analyses in Bahar et al. (2016) and here (S2.Photosynthesis) suggest that across the Andean
9
gradient the maximum light.saturated photosynthetic rate does not vary with elevation. Thus
10
photosynthesis strongly acclimates to prevailing air temperature and this supports the use of a
11
temperature independent model of leaf photosynthesis in our simulations. However, in order to
12
specifically test for the importance of direct temperature effects on photosynthesis, we used a
13
generic temperature sensitivity model (Higgins et al. 2016) and compared simulations with and
14
without temperature dependence. In this wet gradient (Zimmermann et al. 2010) we did not include
15
any water availability effect on photosynthesis.
16
2.3 Model , Inventory data integration
17
Within our study plots all trees with a D>10 cm have been identified at the species level, and in
18
selected subplots all trees with D>2 cm have been measured and identified. In addition LMA, NLm, 19
PLm and ρWwere available (Malhi et al. 2017b; Asner et al. 2016b) for approximately 7% of the 20
stems of species that comprise 60% (in diverse lowland sites) to 80% (in the less diverse montane
21
sites) of the total plot basal area. In our simulations individuals with measured trait values were
22
included as such, without using an average species value, in order to incorporate intraspecific
23
variation. For the rest of the trees, trait values were populated hierarchically using, in decreasing
24
order of preference, the species mean plot value, the species transect.wide mean value or, for trees
25
for which no species.level traits were available, the plot.level trait means.
26
Climate data were available from weather stations located close to each study site (Table S1.1).
27
The most complete time series for most weather stations were for the year 2013 and solar radiation,
28
temperature and precipitation were recorded at 30.minute intervals. We used these time.series to
29
estimate average daily climate. For days with missing data, the average daily values were estimated
30
by interpolating the daily parameters of the previous and following three days.
31
For Review Only
10
2.4 Simulations
1
We performed two sets of simulations to elucidate the major controls of forest productivity along
2
Amazon.Andes gradient. Firstly, the importance of temperature sensitivity was explored following
3
a “leave.one.out” procedure that explored the ability of TFS to simulate GPP and NPP patterns
4
under three different model setups: 1) inclusion of both photosynthetic temperature sensitivity and
5
variation of functional traits along the gradient, 2) inclusion only of photosynthetic temperature
6
sensitivity, and, 3) inclusion only of functional trait variation.
7
Secondly to explore the importance of climate, stand structure and functional traits in
8
determining GPP and NPP across our study sites, we applied within TFS a set of randomization
9
exercises. These are described in detail in S3. To test the importance of climate (Climate only Setup
10
. CoS), we simulated GPP and NPPby using the local (plot.specific) climate and a regional average
11
stand structure and trait distribution (i.e. the average stand structure and traits distribution across all
12
plots along the transect). The hypothesis behind CoS is that climate, and particularly variation in
13
incoming solar radiation, is sufficient to explain variation in productivity across the elevation
14
gradient, with no between.plots variation in traits or stand structure required. The role of stand
15
structure was tested using the Structure only Setup (SoS). Following this setup, the observed D
16
distribution in each plot was used to initialise trees, while climate and functional diversity were kept
17
constant. The hypothesis behind the SoS is that change in stand structure, via its effects on the
18
partitioning of available light, is the most important determinant of productivity along the elevation
19
gradient. Finally, the potential control of functional trait variation, expressed through the
20
distributions of the four traits, was explored by initializing TFS with the locally observed trait
21
distribution while keeping climate and stand.size distribution fixed (Traits only Setup (ToS)). The
22
hypothesis tested by this setup is that knowledge of the local distribution of the four functional traits
23
is adequate to predict observed variation in GPP and NPP with elevation.
24
25
3. Results
26
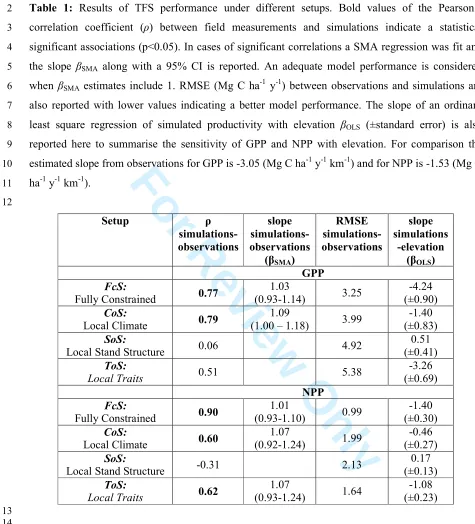
The predictive ability of the various model setups were quantified through standardised major axis
27
(SMA) regressions and estimation of root mean square error (RMSE in MgC ha.1 y.1) between
28
observed and simulated GPP and NPP. In addition ordinary least square regressions of simulated
29
GPP and NPP with elevation were performed with the estimated slope (βOLS in MgC ha.1 y.1 km.1) 30
representing the sensitivity of each setup to changes in elevation.
31
Simulations including photosynthetic temperature sensitivity and functional trait shifts along the
32
gradient over.predict sensitivity to elevation changes, underestimating both GPP and NPP
33
For Review Only
11
particularly at upland sites [GPP: RMSE=9.75, βOLS=.8.90, NPP: RMSE=2.86, βOLS=.2.94] (Fig 2, 1
Table S5.1). A similar model behavior was observed even when only temperature sensitivity was
2
included, assuming no functional traits shift with elevation. However, when trait values were
3
allowed to vary with elevation in accordance with observations and temperature sensitivity was
4
excluded, the model performed best [GPP: RMSE=3.25, βOLS=.4.24, NPP: RMSE=0.99, βOLS=. 5
1.40]. We named this model setup, initialized with plot specific solar radiation, stand structure and
6
functional traits data, as the fully constrained model setup (FcS). We note here that accounting for
7
light competition was particularly important for accurate GPP and NPP simulations (Fig S5.2, Table
8
S5.2). The FcS captures the broad gradient between higher productivity in lowland sites and lower
9
productivity in montane sites, suggesting that direct photosynthetic temperature sensitivity could be
10
excluded from our modelling framework (although it could still matter through its effects on traits),
11
and that across the gradient solar radiation is the main climatic driver of spatial variation in forest
12
productivity.
13
After validating the model, we used the randomization exercises to test the importance of
14
climate, stand structure and functional traits to drive GPP and NPPpatterns. When exploring for the
15
effects of climate (CoS), i.e. factoring out stand structure and traits variation, the RMSE increased
16
both for GPP and NPP [3.99 and 1.99 respectively] and the model was less sensitive to elevation
17
changes [βOLS=.1.40 and βOLS=.0.46 respectively] (Table 1). Hence, CoS captured the mean 18
productivity across the gradient but was not as sensitive as FcS to changes in elevation and in
19
particular overestimated forest productivity at upland sites (Fig 3).
20
When site.specific structure was used as the main driver (SoS), there was a substantial decline in
21
the predictive ability of the model. The broad scale decline of primary productivity with elevation
22
could not be reproduced adequately (Fig 3), and RMSE increased both for GPP and NPP (Table 1).
23
This suggests that knowledge of the tree.size distribution alone is not enough to estimate patterns of
24
productivity along the Andean elevation gradient. It should be remembered however that the SoS
25
setup represents mainly variation in size.class distribution and not variation in established biomass,
26
which in the model is additionally influenced by variation in wood density.
27
When functional trait variation alone was considered (ToS), the model reproduced the broad
28
scale decline with elevation but both GPP and NPP were overestimated compared to FcS,
29
particularly at mid elevations (Fig 3). For GPP the RMSE increased [5.38] compared to the FcS and
30
the CoS but the sensitivity of the model to elevation was close to observations [βOLS=.3.26] (Table 31
1). For NPP, the RMSE [1.64] was higher than FcS but lower than CoS and sensitivity with
32
elevation [βOLS=.1.08] was higher than CoS. These results suggest that the local traits distributions 33
For Review Only
12
captures the declining trend in productivity with elevation, but additional knowledge of solar
1
radiation, is required to accurately estimate GPP and NPP.
2
To gain further insights into the mechanisms that drive variation in forest productivity, we
3
explored how some key stand.level parameters vary with elevation using inferences from the FcS
4
(Fig 4). Average light availability over all canopy depths (I) declines with elevation and then
5
increases at the uppermost plot, following variation in incoming solar radiation at the top of the
6
canopy (SO) and inversely the number of stems per area (NS). On the other hand, the basal.area 7
weighted average LMA and PLa increase with elevation, while NLa does not change much. Simulated 8
Rd does not vary much across the gradient and given the constant Amax the decline in actual 9
photosynthesis (AL) is mainly a result of variation in light availability, with a small divergence at 10
the uppermost plots. However, the half.saturation coefficient also increases with elevation and this
11
suggests that trees at upland sites have a lower photosynthetic rate for a given light intensity (below
12
maximum rates) compared to their lowland counterparts, explaining the divergence in AL. Thus 13
reductions in average photosynthetic rate with elevation are likely to be mainly due to reductions in
14
light availability as well as due to the higher light levels required for photosynthetic light saturation
15
for trees at higher elevations.
16
17
4. Discussion
18
Various environmental and biotic drivers can control forest productivity along the Amazon.Andes
19
elevation gradient (Fig 1). We developed a simplified version of a vegetation model that integrates a
20
range of field measurements in order to understand the relative importance of climate, stand
21
structure and functional traits on forest productivity. The inclusion of the trait.based growth
22
equation of Enquist et al. (2007) increases the simplicity and tractability of the model. Overall, TFS
23
provided simulations that were in line with observations of the magnitude and trends in GPP and
24
NPP across the elevation gradient. In the following paragraphs we describe how the performed
25
simulations and randomisation exercises were used to understand the decline in productivity with
26
elevation.
27
Temperature and Photosynthesis Acclimation
28
Variation in primary productivity has been traditionally considered to reflect the effects of climate
29
variables such as radiation, temperature and precipitation on plant metabolic rates (Chapin et al.
30
2012). A recent study reported that, along the Andean elevation gradient, maximum carboxylation
31
and electron transport rates at a standardized temperature of 25oC were significantly higher at
32
upland sites, possibly reflecting greater P per unit leaf area at high elevations and/or thermal
33
For Review Only
13
acclimation to sustained lower growth temperatures (Bahar et al. 2016). By contrast, when
1
measurements of gas exchange were made at the daytime temperatures at each site (20.28oC; Fig
2
S2.2), light.saturated, area.based rates of net photosynthesis, as well as maximum carboxylation
3
and electron transport rates, show no significant trend with elevation (Bahar et al. 2016, Malhi et al.
4
2017a). The latter observations support the use of a temperature.independent equation for
5
photosynthetic carbon assimilation. Our simulations show that accurate GPP and NPP predictions
6
can be made without a direct temperature sensitivity effect on photosynthesis (Fig 2). When both
7
temperature sensitivity and functional traits variation was included in the model, forest productivity
8
was too sensitive to elevation changes. This suggests that the effect of temperature is likely to be
9
manifested through variation in leaf traits, which may be controlled by variation in environmental
10
conditions (including temperature) along the gradient. The shift in leaf traits and photosynthetic
11
characteristics with elevation cancels out much of the ecophysiological temperature dependency
12
found in single plant measurements. This does not imply that short.term temperature changes
13
(months to decades) will not affect forest productivity but rather that long.term changes lead to a
14
turnover in species such that the local community is acclimated to local growing conditions,
15
resulting in little sensitivity of productivity to temperature on long time scales, and within the
16
temperature range studied. An alternative possibility is that temperature shows a strong but non.
17
causal relationship with leaf traits along the gradient, and this obscures a real direct temperature
18
effect.
19
Functional Traits
20
Previous studies along this and other elevation gradients in the Andes region found that more than
21
80% of LMA and NL turnover between communities is determined phylogenetically, suggesting that 22
these traits may have been involved in evolutionary adaptation (Asner et al. 2014b). Furthermore,
23
Asner et al. (2014b) found that these inter.community differences in LMA and NL were dominated 24
by changes in temperature, rather than by other factors such as moisture or radiation. By contrast,
25
between.community variation in PL is controlled by substrate rather than temperature effects (Asner 26
et al. 2016b). Along the Amazon.Andes gradient leaf N:P ratio declines with elevation (Malhi et al.
27
2017b) and this might indicate a switch from P to N limited photosynthesis consistent with soil
28
properties (Nottingham et al. 2015, 2016), with Bahar et al. (2016) suggesting that knowledge of
29
growth temperature is not required to estimate photosynthetic capacity if leaf and soil P data are
30
available. Here, we used empirical relationships to infer the parameters of the photosynthetic light
31
response curve form LMA, NLa and PLa and thus determine how changes in traits regulate C. 32
fixation. In an additional simulation exercise, the progressive increase of the functional strategies
33
included in the model (from one PFT, to nine PFTs, to a continuum of plant strategies), increased
34
For Review Only
14
the predictive ability of the model. This outcome suggests that species turnover (Asner et al. 2014a;
1
Neyret et al. 2016) and the associated shifts in plant functional traits is a stronger driver of spatial
2
variation in forest productivity than direct environmental filtering effects (S5–Importance of
3
elevation shifts in functional traits).
4
Solar Radiation & Light Competition
5
Along the Andean gradient, solar radiation declines at mid.high elevations, associated with a higher
6
frequency of both cloud occurrence and cloud immersion (Halladay et al. 2012), and then rises
7
again at the uppermost treeline plot. In our simulations, the actual photosynthetic rate follows
8
variation in light availability, while at the uppermost plots this relationship could be additionally
9
controlled by the higher photosynthetic light saturation level that characterises upland trees (Fig 4).
10
Thus, solar radiation is the strongest direct climatic determinant of forest productivity, and therefore
11
actual photosynthesis does not track potential photosynthesis (van der Weg et al. 2014, Malhi et al.
12
2017a). One of the key criticisms of classical MST is that it fails to account for asymmetric
13
competition for light (Coomes & Allen 2009). The proposed modelling framework addresses this
14
issue by explicitly simulating the hierarchical position of each individual within a stand, using the
15
PPA assumption (Strigul et al. 2008). Our simulations show that inclusion of light competition is
16
necessary for accurately predicting GPP and NPP (S5–Light Competition).
17
Stand Structure
18
Our simulations suggest that stand structure and in particular diameter distribution do not have a
19
strong effect on forests productivity along our study plots. Although woody biomass declines with
20
elevation, basal area does not (Malhi et al. 2017b). This constancy of basal area may diminish the
21
effect of biomass variation in contrast with studies that identify biomass as the strongest predictor
22
of forest productivity, for example during succession (Lohbeck et al. 2015). Thus in mature stands,
23
like the ones studied here, variation in functional traits that control carbon assimilation and biomass
24
allocation might be stronger predictors of forest productivity than standing biomass (Finegan et al.
25
2015). In our case this functional trait variation seems to be primarily controlled by species
26
turnover.
27
28
5. Conclusions
29
Here we combine a uniquely rich dataset of plot.level productivity coupled with functional traits
30
and a modelling framework to understand what drives the trend of productivity along a tropical
31
forest elevation gradient. We have shown that an individual.based model that explicitly describes
32
functional trait variation within and between plots, and accounts for light competition can
33
For Review Only
15
realistically capture variation in primary productivity along the investigated gradient. Our findings
1
suggest that the decline in productivity with increasing elevation is explained by a combination of
2
shifts in plant traits values and a decline in solar radiation. Remarkably, we do not need to account
3
for direct temperature dependence of photosynthesis, beyond what may be an effect of temperature
4
through the observed plant traits. The turnover in the plant community and ensuing shift in plant
5
traits cancels much of the temperature dependency that is found in single plant in situ
6
measurements. The work demonstrates the utility of tropical elevation transects in yielding
7
important insights into long.term ecosystem sensitivity to temperature, but also suggests that
8
variation in solar radiation introduces a moderate complicating caveat. Advanced new techniques
9
such as airborne spectroscopy have demonstrated the potential to map key leaf traits at landscape
10
and regional scale, both along elevation gradients and across edaphic contrasts in the lowlands
11
(Asner et al. 2014a, 2016a). Our work shows that this spatial variation in traits can translate into
12
potentially mapping spatial variation in productivity at landscape scale, with spatial variation in leaf
13
traits capturing much of the spatial variation in environmental conditions. However, mapping traits
14
alone is not sufficient, and there is still a need to account for light.limitation of photosynthesis. In
15
combination with airborne mapping of canopy traits at large scale, this work opens the door to a
16
mechanistic approach to mapping ecosystem productivity at landscape and regional scales.
17
18
Acknowledgements
19
This work is a product of the Global Ecosystems Monitoring (GEM) network
20
(gem.tropicalforests.ox.ac.uk), the Andes Biodiversity and Ecosystems Research Group ABERG
21
(andesresearch.org) and the Amazon Forest Inventory Network RAINFOR (www.rainfor.org)
22
research consortia. N.F. and Y.M were funded by a European Research Council (ERC) Advanced
23
Investigator grant GEM.TRAIT (321131) to Y.M. The field campaign was funded by grants to
24
Y.M. and PM from the UK Natural Environment Research Council (Grants NE/J023418/1,
25
NE/J023531/1, NE/F002149/1) and the Gordon and Betty Moore Foundation to Y.M, G.P.A and
26
O.L.P. with additional support from European Research Council Advanced Investigator grants
27
GEM.TRAIT (321131) and T.FORCES (291585) to Y.M. and O.L.P. under the European Union's
28
Seventh Framework Programme (FP7/2007.2013) and the U.S. National Science Foundation grant
29
to G.P.A. (DEB.1146206). Y.M. was also supported by the Jackson Foundation; O.K.A. and P.M.
30
acknowledge the support of the Australian Research Council (CE140100008, DP0986823,
31
DP130101252, FT110100457). S.D. was partially supported by a Visiting Professorship Grant from
32
the Leverhulme Trust, UK.
33
For Review Only
16
References
1
2
1. Asner, G.P., Anderson, C.B., Martin, R.E., Knapp, D.E., Tupayachi, R., Sinca, F., et al.
3
(2014a). Landscape.scale changes in forest structure and functional traits along an Andes.to.
4
Amazon elevation gradient. Biogeosciences, 11, 843–856
5
2. Asner, G.P., Knapp, D.E., Anderson, C.B., Martin, R.E. & Vaughn, N. (2016a). Large.scale
6
climatic and geophysical controls on the leaf economics spectrum. PNAS, 113, E4043–E4051
7
3. Asner, G.P., Martin, R.E., Anderson, C.B., Kryston, K., Vaughn, N., Knapp, D.E., et al.
8
(2016b). Scale dependence of canopy trait distributions along a tropical forest elevation
9
gradient. New Phytol, DOI: 10.1111/nph.14068
10
4. Asner, G.P., Martin, R.E., Tupayachi, R., Anderson, C.B., Sinca, F., Carranza.Jiménez, L., et
11
al. (2014b). Amazonian functional diversity from forest canopy chemical assembly. PNAS,
12
111, 5604–5609
13
5. Atkin, O.K., Bloomfield, K.J., Reich, P.B., Tjoelker, M.G., Asner, G.P., Bonal, D., et al.
14
(2015). Global variability in leaf respiration in relation to climate, plant functional types and
15
leaf traits. New Phytol, 206, 614–636
16
6. Bahar, N.H.A., Ishida, F.Y., Weerasinghe, L.K., Guerrieri, R., O’Sullivan, O.S., Bloomfield,
17
K.J., et al. (2016). Leaf.level photosynthetic capacity in lowland Amazonian and high.elevation
18
Andean tropical moist forests of Peru. New Phytol, DOI: 10.1111/nph.14079
19
7. Balvanera, P., Pfisterer, A.B., Buchmann, N., He, J..S., Nakashizuka, T., Raffaelli, D., et al.
20
(2006). Quantifying the evidence for biodiversity effects on ecosystem functioning and
21
services. Ecology Letters, 9, 1146–1156
22
8. Baraloto, C., Rabaud, S., Molto, Q., Blanc, L., Fortunel, C., Hérault, B., et al. (2011).
23
Disentangling stand and environmental correlates of aboveground biomass in Amazonian
24
forests. Global Change Biology, 17, 2677–2688
25
9. Brienen, R.J.W. & Zuidema, P.A. (2005). Relating tree growth to rainfall in Bolivian rain
26
forests: a test for six species using tree ring analysis. Oecologia, 146, 1
27
10. Chapin, F.S., Matson, P.A. & Vitousek, P.M. (2011). Principles of Terrestrial Ecosystem
28
Ecology. Springer New York, New York, NY
29
11. Chave, J., Réjou.Méchain, M., Búrquez, A., Chidumayo, E., Colgan, M.S., Delitti, W.B., et al.
30
(2014). Improved allometric models to estimate the aboveground biomass of tropical trees.
31
Global Change Biology, 20, 3177–3190
32
12. Cleveland, C.C., Townsend, A.R., Taylor, P., Alvarez.Clare, S., Bustamante, M.M.C.,
33
Chuyong, G., et al. (2011). Relationships among net primary productivity, nutrients and climate
34
in tropical rain forest: a pan.tropical analysis. Ecology Letters, 14, 939–947
35
For Review Only
17
13. Coomes, D.A. & Allen, R.B. (2009). Testing the Metabolic Scaling Theory of tree growth.
1
Journal of Ecology, 97, 1369–1373
2
14. Enquist, B.J., Kerkhoff, A.J., Stark, S.C., Swenson, N.G., McCarthy, M.C. & Price, C.A.
3
(2007). A general integrative model for scaling plant growth, carbon flux, and functional trait
4
spectra. Nature, 449, 218–222
5
15. Falster, D.S., Duursma, R.A., Ishihara, M.I., Barneche, D.R., FitzJohn, R.G., Vårhammar, A.,
6
et al. (2015). BAAD: a Biomass And Allometry Database for woody plants. Ecology, 96,
7
1445–1445
8
16. Farquhar, G.D., Caemmerer, S. von & Berry, J.A. (1980). A biochemical model of
9
photosynthetic CO2 assimilation in leaves of C3 species. Planta, 149, 78–90
10
17. Feeley, K.J., Silman, M.R., Bush, M.B., Farfan, W., Cabrera, K.G., Malhi, Y., et al. (2011).
11
Upslope migration of Andean trees. Journal of Biogeography, 38, 783–791
12
18. Finegan, B., Peña.Claros, M., de Oliveira, A., Ascarrunz, N., Bret.Harte, M.S., Carreño.
13
Rocabado, G., et al. (2015). Does functional trait diversity predict above.ground biomass and
14
productivity of tropical forests? Testing three alternative hypotheses. J Ecol, 103, 191–201
15
19. Franklin, O., Johansson, J., Dewar, R.C., Dieckmann, U., McMurtrie, R.E., Brännström, Å., et
16
al. (2012). Modeling carbon allocation in trees: a search for principles. Tree Physiol, 32, 648–
17
666
18
20. Fyllas, N.M., Gloor, E., Mercado, L.M., Sitch, S., Quesada, C.A., Domingues, T.F., et al.
19
(2014). Analysing Amazonian forest productivity using a new individual and trait.based model
20
(TFS v.1). Geosci. Model Dev., 7, 1251–1269
21
21. Fyllas, N.M., Patiño, S., Baker, T.R., Bielefeld Nardoto, G., Martinelli, L.A., Quesada, C.A., et
22
al. (2009). Basin.wide variations in foliar properties of Amazonian forest: phylogeny, soils and
23
climate. Biogeosciences, 6, 2677–2708
24
22. Girardin, C. a. J., Malhi, Y., Aragão, L.E.O.C., Mamani, M., Huaraca Huasco, W., Durand, L.,
25
et al. (2010). Net primary productivity allocation and cycling of carbon along a tropical forest
26
elevational transect in the Peruvian Andes. Global Change Biology, 16, 3176–3192
27
23. Girardin, C.A.J., Espejob, J.E.S., Doughty, C.E., Huasco, W.H., Metcalfe, D.B., Durand.Baca,
28
L., et al. (2014). Productivity and carbon allocation in a tropical montane cloud forest in the
29
Peruvian Andes. Plant Ecology & Diversity, 7, 107–123
30
24. Graham, E.A., Mulkey, S.S., Kitajima, K., Phillips, N.G. & Wright, S.J. (2003). Cloud cover
31
limits net CO2 uptake and growth of a rainforest tree during tropical rainy seasons. PNAS, 100,
32
572–576
33
25. Halladay, K., Malhi, Y. & New, M. (2012). Cloud frequency climatology at the Andes/Amazon
34
transition: 1. Seasonal and diurnal cycles. J. Geophys. Res., 117, D23102
35
For Review Only
18
26. Higgins, S.I., Buitenwerf, R. & Moncrieff, G.R. (2016). Defining functional biomes and
1
monitoring their change globally. Global Change Biology, 22, 3583–3593
2
27. Hunt, R. (1982). Plant growth curves. The functional approach to plant growth analysis. E. 3
Arnold Publishers, London. ISBN 0.7131.2844.5
4
28. Lambers, H., Chapin, F.S. & Pons, T.L. (2008). Plant Physiological Ecology. Springer New
5
York, New York, NY
6
29. Lavorel, S. & Garnier, E. (2002). Predicting changes in community composition and ecosystem
7
functioning from plant traits: revisiting the Holy Grail. Functional Ecology, 16, 545–556
8
30. Lebrija.Trejos, E., Pérez.García, E.A., Meave, J.A., Bongers, F. & Poorter, L. (2010).
9
Functional traits and environmental filtering drive community assembly in a species.rich
10
tropical system. Ecology, 91, 386–398
11
31. Lohbeck, M., Poorter, L., Martínez.Ramos, M. & Bongers, F. (2015). Biomass is the main
12
driver of changes in ecosystem process rates during tropical forest succession. Ecology, 96,
13
1242–1252
14
32. Malhi, Y., Girardin, C.A.J., Goldsmith, G.R., Doughty, C.E., Salinas, N., Metcalfe, D.B., et al.
15
(2017a). The variation of productivity and its allocation along a tropical elevation gradient: a
16
whole carbon budget perspective. New Phytol, n/a.n/a. DOI: 10.1111/nph.14189
17
33. Malhi, Y., Silman, M., Salinas, N., Bush, M., Meir, P. & Saatchi, S. (2010). Introduction:
18
Elevation gradients in the tropics: laboratories for ecosystem ecology and global change
19
research. Global Change Biology, 16, 3171–3175
20
34. Marino, G., Aqil, M. & Shipley, B. (2010). The leaf economics spectrum and the prediction of
21
photosynthetic light–response curves. Functional Ecology, 24, 263–272
22
35. Moorcroft, P.R., Hurtt, G.C. & Pacala, S.W. (2001). A Method for Scaling Vegetation
23
Dynamics: The Ecosystem Demography Model (ed). Ecological Monographs, 71, 557–586
24
36. Muller.Landau, H.C., Condit, R.S., Chave, J., Thomas, S.C., Bohlman, S.A., Bunyavejchewin,
25
S., et al. (2006). Testing metabolic ecology theory for allometric scaling of tree size, growth
26
and mortality in tropical forests. Ecology Letters, 9, 575–588
27
37. Nemani, R.R., Keeling, C.D., Hashimoto, H., Jolly, W.M., Piper, S.C., Tucker, C.J., et al.
28
(2003). Climate.Driven Increases in Global Terrestrial Net Primary Production from 1982 to
29
1999. Science, 300, 1560–1563
30
38. Neyret, M., Bentley, L.P., Oliveras, I., Marimon, B.S., Marimon.Junior, B.H., Almeida de
31
Oliveira, E., et al. (2016). Examining variation in the leaf mass per area of dominant species
32
across two contrasting tropical gradients in light of community assembly. Ecology and
33
Evolution
34
For Review Only
19
39. Nottingham, A.T., Whitaker, J., Turner, B.L., Salinas, N., Zimmermann, M., Malhi, Y., et al.
1
(2015). Climate Warming and Soil Carbon in Tropical Forests: Insights from an Elevation
2
Gradient in the Peruvian Andes. BioScience, 65, 906–921
3
40. Nottingham, A.T., Turner, B.L., Whitaker, J., Ostle, N.J., McNamara, N.P., Bardgett, R.D., et
4
al. (2015). Soil microbial nutrient constraints along a tropical forest elevation gradient: a
5
belowground test of a biogeochemical paradigm. Biogeosciences, 12, 6071–6083
6
41. Poorter, H., Jagodzinski, A.M., Ruiz.Peinado, R., Kuyah, S., Luo, Y., Oleksyn, J., et al. (2015).
7
How does biomass distribution change with size and differ among species? An analysis for
8
1200 plant species from five continents. New Phytol., 208, 736–749
9
42. Poorter, L., Wright, S.J., Paz, H., Ackerly, D.D., Condit, R., Ibarra.Manríquez, G., et al.
10
(2008). Are Functional Traits Good Predictors of Demographic Rates? Evidence from Five
11
Neotropical Forests. Ecology, 89, 1908–1920
12
43. Purves, D. & Pacala, S. (2008). Predictive Models of Forest Dynamics. Science, 320, 1452–
13
1453
14
44. Quesada, C.A., Phillips, O.L., Schwarz, M., Czimczik, C.I., Baker, T.R., Patiño, S., et al.
15
(2012). Basin.wide variations in Amazon forest structure and function are mediated by both
16
soils and climate. Biogeosciences, 9, 2203–2246
17
45. Raich, J.W., Russell, A.E. & Vitousek, P.M. (1997). Primary Productivity and Ecosystem
18
Development Along an Elevational Gradient on Mauna Loa, Hawai‘i. Ecology, 78, 707–721
19
46. Santiago, L.S., Kitajima, K., Wright, S.J. & Mulkey, S.S. (2004). Coordinated changes in
20
photosynthesis, water relations and leaf nutritional traits of canopy trees along a precipitation
21
gradient in lowland tropical forest. Oecologia, 139, 495–502
22
47. Scheiter, S. & Higgins, S.I. (2009). Impacts of climate change on the vegetation of Africa: an
23
adaptive dynamic vegetation modelling approach. Global Change Biology, 15, 2224–2246
24
48. Scheiter, S., Langan, L. & Higgins, S.I. (2013). Next.generation dynamic global vegetation
25
models: learning from community ecology. New Phytol, 198, 957–969
26
49. Shenkin, A., Bentley, L.P., Oliveras, I., Salinas, N., Adu.Bredu, S. et al. (2016). Tropical Tree
27
Crown Size and Shape across Biogeography, Ecosystems and Gradients: Convergence and
28
Variation. Ecological Monographs, under review.
29
50. Strigul, N., Pristinski, D., Purves, D., Dushoff, J. & Pacala, S. (2008). Scaling from trees to
30
forests: tractable macroscopic equations for forest dynamics. Ecological Monographs, 78, 523–
31
545
32
51. Sundqvist, M.K., Sanders, N.J. & Wardle, D.A. (2013). Community and Ecosystem Responses
33
to Elevational Gradients: Processes, Mechanisms, and Insights for Global Change. Annual
34
Review of Ecology, Evolution, and Systematics, 44, 261–280
35
For Review Only
* ? ' @ ; @ ) L =) 9 ' A1998). Experimental Investigation of Nutrient
1
Limitation of Forest Growth on Wet Tropical Mountains. Ecology, 79, 10–22
2
53. Vazquez, A.J. & Givnish, T.J. (1998). Altitudinal gradients in tropical forest composition,
3
structure, and diversity in the Sierra de Manantlán. Journal of Ecology, 86, 999–1020
4
54. Weg, M.J. van de, Meir, P., Grace, J. & Atkin, O.K. (2009). Altitudinal variation in leaf mass
5
per unit area, leaf tissue density and foliar nitrogen and phosphorus content along an Amazon.
6
Andes gradient in Peru. Plant Ecology & Diversity, 2, 243–254
7
55. Weg, M.J. van de, Meir, P., Grace, J. & Ramos, G.D. (2012). Photosynthetic parameters, dark
8
respiration and leaf traits in the canopy of a Peruvian tropical montane cloud forest. Oecologia,
9
168, 23–34
10
56. Weg, M.J. van de, Meir, P., Williams, M., Girardin, C., Malhi, Y., Silva.Espejo, J., et al.
11
(2014). Gross Primary Productivity of a High Elevation Tropical Montane Cloud Forest.
12
Ecosystems, 17, 751–764
13
57. Wright, J.S. (2002). Plant diversity in tropical forests: a review of mechanisms of species
14
coexistence. Oecologia, 130, 1–14
15
58. Wright, S.J., Kitajima, K., Kraft, N.J.B., Reich, P.B., Wright, I.J., Bunker, D.E., et al. (2010).
16
Functional traits and the growth–mortality trade.off in tropical trees. Ecology, 91, 3664–3674
17
59. Zimmermann, M., Meir, P., Bird, M.I., Malhi, Y. & Ccahuana, A.J.Q. (2010). Temporal
18
variation and climate dependence of soil respiration and its components along a 3000 m
19
altitudinal tropical forest gradient. Global Biogeochem. Cycles, 24, GB4012
20
For Review Only
1
TABLES
1
Table 1: Results of TFS performance under different setups. Bold values of the Pearson’s
2
correlation coefficient (ρ) between field measurements and simulations indicate a statistical
3
significant associations (p<0.05). In cases of significant correlations a SMA regression was fit and
4
the slope βSMA along with a 95% CI is reported. An adequate model performance is considered 5
when βSMA estimates include 1. RMSE (Mg C ha.1 y.1) between observations and simulations are 6
also reported with lower values indicating a better model performance. The slope of an ordinary
7
least square regression of simulated productivity with elevation βOLS (±standard error) is also 8
reported here to summarise the sensitivity of GPP and NPP with elevation. For comparison the
9
estimated slope from observations for GPP is .3.05 (Mg C ha.1 y.1 km.1) and for NPP is .1.53 (Mg C
10
ha.1 y.1 km.1).
11
12
Setup ρ
simulations, observations
slope simulations, observations
(βSMA)
RMSE simulations, observations
slope simulations
,elevation (βOLS)
GPP
Fully Constrained 0.77
1.03
(0.93.1.14) 3.25
.4.24 (±0.90)
Local Climate 0.79
1.09
(1.00 – 1.18) 3.99
.1.40 (±0.83)
Local Stand Structure 0.06 4.92
0.51 (±0.41)
Local Traits 0.51 5.38
.3.26 (±0.69) NPP
Fully Constrained 0.90
1.01
(0.93.1.10) 0.99
.1.40 (±0.30)
Local Climate 0.60
1.07
(0.92.1.24) 1.99
.0.46 (±0.27)
Local Stand Structure .0.31 2.13
0.17 (±0.13)
Local Traits 0.62
1.07
(0.93.1.24) 1.64
.1.08 (±0.23)
13 14 15
[image:24.612.50.525.70.594.2]