of SCFRC
.
White Rose Research Online URL for this paper:
http://eprints.whiterose.ac.uk/95560/
Version: Accepted Version
Proceedings Paper:
Garcia-Taengua, E orcid.org/0000-0003-2847-5932, Taylor, S, Sonebi, M et al. (3 more
authors) (2016) Effect of Polypropylene Macrofibers on the Flexural Response of SCFRC.
In: Khayat, K, (ed.) Proceedings of the 8th International RILEM Symposium on
Self-Compacting Concrete. 8th International RILEM Symposium on Self-Compacting
Concrete (SCC2016), 15-18 May 2016, Washington DC, United States. RILEM
Publications S.A.R.L. (France) , pp. 479-488. ISBN 978-2-35158-156-8
This is an author produced version of a paper published in Proceedings of the 8th
International RILEM Symposium on Self-Compacting Concrete
[email protected] https://eprints.whiterose.ac.uk/ Reuse
Unless indicated otherwise, fulltext items are protected by copyright with all rights reserved. The copyright exception in section 29 of the Copyright, Designs and Patents Act 1988 allows the making of a single copy solely for the purpose of non-commercial research or private study within the limits of fair dealing. The publisher or other rights-holder may allow further reproduction and re-use of this version - refer to the White Rose Research Online record for this item. Where records identify the publisher as the copyright holder, users can verify any specific terms of use on the publisher’s website.
Takedown
If you consider content in White Rose Research Online to be in breach of UK law, please notify us by
Effect of Polypropylene Macrofibers on the Flexural
Response of SCFRC
Emilio Garcia-Taengua1 , Su Taylor2, Mohamed Sonebi2, Peter Deegan3,
Liberato Ferrara4, Andrea Pattarini5
1 Institute for Resilient Infrastructure, School of Civil Engineering,
University of Leeds (United Kingdom)
2 School of Planning, Architecture and Civil Engineering, Queen’s
University of Belfast (United Kingdom)
3 Banagher Precast Concrete Ltd., Co. Offaly (Republic of Ireland) 4 Politecnico de Milano, Milan (Italy)
5 Azichem, Mantova (Italy)
Abstract This study looks into the effect of polypropylene (PP) macrofibers on the flexural response of self-consolidating fiber-reinforced concrete (SCFRC). PP fibres with a length of 38 mm dosed at 8 kg/m3 were incorporated in different mixes in
order to produce prismatic specimens and test them in flexure. The total binder content was maintained at 450 kg/m3 in all cases, and the percentage of ground
granulated blast-furnace slag (GGBS) was varied between 25% and 50%. The water-to-binder ratio (w/b) was varied between 0.40 and 0.45. The compressive strength and the residual flexural strength were evaluated at the age of 56 days. The experimental results from these tests were related to w/b and GGBS content. Predictive equations and response surfaces were obtained for the residual flexural strength parameters by means of multiple linear regression. It was shown that there is a statistically significant synergy between GGBS content and w/b that affects the variability of residual load-bearing capacity of SCFRC in flexure.
Keywords: Ground-granulated blast-furnace slag, polypropylene fibers, residual flexural strength.
Introduction
fresh state performance that makes it easier for fibers to be dispersed in the fresh mix [2]. This is made possible partially as a result of the addition of important amounts of mineral powders, which have a lubricant effect on the fresh paste that complements the effect of superplasticizers and allows for better compatibility between these and cement [3–5]. Mineral additions are therefore important constituents of self-consolidating concretes. The partial replacement of cement with pozzolanic materials or the addition of fillers such as limestone powder (LSP) can significantly interact with fibers [3, 6].
Fibers restrain the initiation and development of cracks and as a result provide concrete with a residual load bearing capacity. In general, SCFRC shows better crack resistance and better strength and toughness than SCC [7]. Contrarily to steel fibers, PP fibers are hydrophobic and therefore weakly wetted by cement paste, but despite that they have been shown to behave satisfactorily in terms of bonding to the concrete matrix [8].
Scope and Objectives
This research aimed at assessing the changes in flexural response that are observed in SCFRC reinforced with 8 kg/m3 of 38-mm length PP fibers when the ground granulated blast-furnace slag (GGBS) content and/or the water-to-binder ratio are varied. To do so, several batches of four different SFRC mix designs were cast and prismatic specimens were produced and tested in flexure. The following particular objectives were pursued:
Identification of significant synergies between w/b ratio and GGBS content and quantification of their impact on residual flexural strength.
Establishment of regression models that relate the residual flexural loads to w/b and GGBS content and that account for significant interactions.
Assessment of the variability profile of the flexural response of cracked SCFRC specimens.
Experimental Programme
Materials
Cement class CEM I 42.5 R and GGBS were used as constituents of the binder. The average particle size of the GGBS was 13.8 microns. Limestone powder (LSP) was also used as a filler, with an average particle size was 9.1 microns. The chemical composition of these materials is shown in Table I.
Effect of Polypropylene Macrofibers on SCFRC Flexural Response 3
with different maximum size (8 and 14 mm) were used, all of them crushed. Polypropylene fibers with a length of 38 mm were used.
Table I. Chemical composition of cement, LSP and GGBS.
Cement LSP GGBS SiO2 19.61 1.74 35.65
TiO2 0.336 0.011 0.735
Al2O3 5.02 0.09 11.53
Fe2O3 3.14 0.11 0.96
MnO 0.097 0.048 0.210 MgO 2.67 0.54 7.22 CaO 63.79 55.24 41.26 Na2O 0.22 <0.003 0.26
K2O 0.469 0.026 0.396
P2O5 0.077 0.132 0.008
SO3 3.04 <0.002 2.33
L.O.I. 2.40 42.71 -0.86
Mix designs
Four different mixes were considered, differing in terms of their water-to-binder (w/b) ratio and their GGBS content. They are summarized in Table II.
The w/b ratio was considered at the levels of 0.40 and 0.45. In all cases, the total binder content (total weight of cement and GGBS) was kept constant at 450 kg/m3.
The relative amount of GGBS was considered at two different dosages: either 25% or 50% of the total binder weight. The SP dosage was adjusted in each case after some trial mixes to achieve a maximum spread between 650-700 mm in the slump flow test.
Table II. SCFRC mixes produced and tested in flexure (kg/m3).
A25G A50G B25G B50G water/binder ratio w/b = 0.45 w/b = 0.40
Cement type I 338 225 338 225
Water 203 203 180 180
Sand 800 800 825 825
Aggregate 8-mm 592 592 611 611
Aggregate 14-mm 208 208 215 215
Limestone Powder 150 150 150 150
GGBS 113 225 113 225
SP 2.5 1.7 2.9 1.9
Fuller's theoretical curve was assumed when proportioning the aggregates, seeking the relative volumes that optimised the fit between the actual and the theoretical curve. The total aggregates content was 1600 kg/m3 or 1650 kg/m3 for the mixes
with w/b of 0.45 and 0.40 respectively. The sand/coarse ratio was kept to 1.0 in all cases in order to ensure a reasonably good degree of cohesion. The LSP content was kept constant at 150 kg/m3 in all cases.
Bending tests
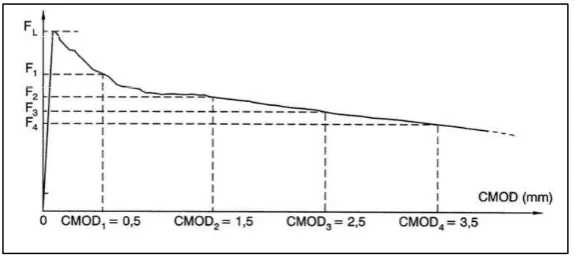
The residual flexural strength of the SCFRC mixes was assessed by testing prismatic specimens in flexure to the European standard EN 14651:2005. Figure 1 shows the dimensions of the prismatic specimens produced and the setup of the three-point bending test. Figure 2 illustrates the parameters that were retained as outcomes of these tests: the flexural loads corresponding to the limit of proportionality (LOP or peak load, FL), and the loads corresponding to crack widths of 0.5, 1.5, 2.5, and 3.5
[image:5.595.97.382.265.395.2]mm (F1, F2, F3 and F4 respectively).
Figure 1. Bending test setup and specimen dimensions (EN 14651).
[image:5.595.95.384.432.560.2]Effect of Polypropylene Macrofibers on SCFRC Flexural Response 5
Three batches of each of the four mixes in Table II were produced and three prismatic specimens per batch were tested at the age of 56 days, as the pozzolanic effect of GGBS had been shown to be fully developed at this age [3]. Additionally, three cubic specimens per batch were tested in compression at the same age to obtain the average compressive strength values.
Experimental Results
The experimental results obtained for the compressive strength (fc,cube, in MPa), the
limit of proportionality (FL, in kN), and the loadings in the postcrack region (F1, F2,
F3, and F4, in kN) are given in Table III.
Table III. Experimental results obtained from the bending tests.
Mix fc,cube (MPa)
FL
(kN)
F1
(kN)
F2
(kN)
F3
(kN)
F4
(kN) A25G 69 19.09 7.43 8.41 8.88 8.87 A25G 72 20.19 9.47 11.40 11.91 11.63 A25G 68.3 19.67 6.23 7.47 8.03 8.17 A50G 55.6 16.35 5.84 6.63 7.06 8.49 A50G 54 16.71 6.27 8.26 8.97 9.28 A50G 54.6 17.24 4.18 5.24 5.64 5.77 B25G 63.2 18.15 7.60 9.34 9.71 7.43 B25G 64.5 16.37 5.49 6.43 6.97 7.37 B50G 62 18.69 7.55 9.20 9.94 9.72 B50G 58.6 17.69 7.43 8.89 9.93 9.93 B50G 61 15.10 7.54 8.65 9.67 9.78
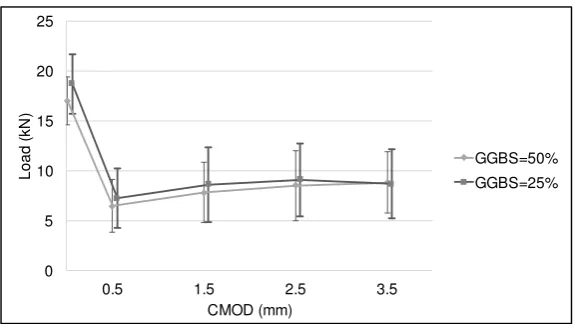
These results are plotted in Figures 3 and 4, which include the error bars corresponding to the 95% confidence interval for each average value. It is observed that the average residual loads are not below 50% of the limit of proportionality, and therefore the contribution of 8 kg/m3 of 38-mm PP fibres to the residual flexural
strength of these SCFRC mixes is not negligible.
Figure 3. Experimental results, grouped by w/b values.
Figure 4. Experimental results, grouped by GGBS contents.
Analysis and Discussion
The experimental values obtained for the limit of proportionality and residual flexural loads were related to w/b ratio and GGBS content (in %) by means of multiple linear regression.
Limit of proportionality
For the limit of proportionality, the following expression (Eq. 1) was obtained (R-squared = 0.62):
0 5 10 15 20 25
0 0.5 1 1.5 2 2.5 3 3.5 4
L
o
a
d
(
k
N
)
CMOD (mm)
w/b=0.40 w/b=0.45
0 5 10 15 20 25
0 0.5 1 1.5 2 2.5 3 3.5 4
L
o
a
d
(
k
N
)
CMOD (mm)
[image:7.595.95.383.261.423.2]Effect of Polypropylene Macrofibers on SCFRC Flexural Response 7
(1)
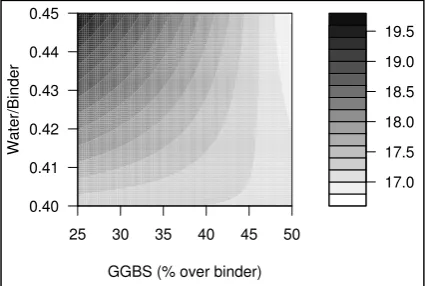
The relationship as modelled by Equation (1) is shown in Figure 5 as a contour plot. It is observed that the combination that gives the highest value for this parameter corresponds to the case with a GGBS content of 25% and w/b ratio of 0.45. This is attributed to the fact that 8 kg/m3 of polypropylene fibres is a relatively high dosage,
which can negatively affect the consolidation of the cementitious matrix. However, the variations observed in the limit of proportionality are not of an important magnitude: the values obtained range between 17 kN and 19.5 kN approximately, and the deviation that these values represent with respect to the average is below 10%, which is consistent with the variability accepted for concrete compressive strength. It can be concluded that the addition of 8 kg/m3 of polypropylene fibres,
[image:8.595.131.345.253.396.2]and the variations of GGBS content and w/b ratio between the ranges considered have a minor impact on the limit of proportionality.
Figure 5. Contour plot for the limit of proportionality (FL, in kN).
Residual flexural load values
In terms of the flexural capacity, similar trends are observed for all the residual load values. Only F1 and F3 are discussed in here, as representative of the relationships
observed between any of them and w/b ratio and GGBS content. The following equations (2 and 3) were obtained for F1 and F3 values (R-squared=0.50 and 0.45
respectively):
(2)
(3)
17.0 17.5 18.0 18.5 19.0 19.5
25 30 35 40 45 50
0.40 0.41 0.42 0.43 0.44 0.45
GGBS (% over binder)
W
a
te
r/
B
in
d
e
Figure 6 shows the contour plot for F1 values corresponding to their relationship
[image:9.595.130.346.148.292.2]with w/b ratio and GGBS content as modelled by equation (3). It is observed that the worst situation corresponds to the mixes with the highest w/b ratio (0.45) and GGBS content (50%). On the other hand, the most satisfactory combinations are either w/b = 0.40 if GGBS is used at 50% or w/b = 0.45 if GGBS is used at 25%. Similar observations can be made with respect to equation (3) and Figure 7.
Figure 6. Contour plot for F1 values (in kN).
Figure 7. Contour plot for F3 values (in kN).
Conclusions
Four series of prismatic specimens were produced and tested at 56 days to characterize the residual flexural strength of SCFRC mixes incorporating 8 kg/m3
[image:9.595.129.346.324.474.2]Effect of Polypropylene Macrofibers on SCFRC Flexural Response 9
Residual flexural loads, in average, were not significantly less than 50% of the limit of proportionality and therefore the contribution of PP fibers at the dosage considered to the mechanical performance of the material in flexure is not negligible.
The variability of residual flexural loads for mixes with w/b = 0.45 was found to be consistently higher than for mixes with w/b = 0.40.
Increasing the relative GGBS content from 25% to 50% was observed to cause a slight reduction (10%) of the limit of proportionality, but did not affect the variability of residual flexural loads.
Significant synergistic effects between w/b and GGBS content were detected. The minimum values for both the limit of proportionality and the residual flexural loads were observed in mixes with w/b = 0.45 and GGBS content of 50%. The best performance was found in these cases: w/b = 0.40 and GGBS content of 50%, or w/b = 0.45 and GGBS content of 25%.
Acknowledgements
The authors wish to acknowledge the financial support and funding received from the European Union, as this research is part of the FP7-PEOPLE-2012-IAPP project "EiroCrete: Development of sustainable, lower carbon, pre-cast concrete infrastructure". The authors also thank their industrial partners Banagher Precast Concrete (Ireland) and Azichem (Italy), and the technical staff of the Heavy
Structures Laboratory at Queen’s University of Belfast.
References
1. Hossain, K.M.A., Lachemi, M., Sammour, M., Sonebi, M.: Influence of Polyvinyl Alcohol, Steel, and Hybrid Fibers on Fresh and Rheological Properties of Self-Consolidating Concrete. ASCE J. Mater. Civ. Eng. 24, 1211–1220 (2012).
2. Ferrara, L., Park, Y.-D., Shah, S.P.: Correlation among Fresh State Behavior, Fiber Dispersion, and Toughness Properties of SFRCs. J. Mater. Civ. Eng. 20, 493 (2008).
3. García-Taengua, E., Sonebi, M., Crossett, P., Taylor, S., Deegan, P., Ferrara, L., Pattarini, A.: Performance of sustainable SCC mixes with mineral additions for use in precast concrete industry. J. Sustain. Cem. Mater. 1–19 (2015).
4. Alonso, M.M., Palacios, M., Puertas, F.: Compatibility between polycarboxylate-based admixtures and blended-cement pastes. Cem. Concr. Compos. 35, 151–162 (2013).
5. García-Taengua, E., Sonebi, M., Taylor, S., Ferrara, L., Deegan, P.: Compability of superplasticisers with cementitious materials. BFT International. 80, 44–53 (2014).
reinforced concrete. Mater. Struct. 37, 318–327 (2004).
7. Hossain, K.M.A., Lachemi, M., Sammour, M., Sonebi, M.: Strength and fracture energy characteristics of self-consolidating concrete incorporating polyvinyl alcohol, steel and hybrid fibres. Constr. Build. Mater. 45, 20–29 (2013).