COMMISSION OF THE EUROPEAN COMMUNITIES
SEC(94) 2105finaL
Brussels, 14.12.1994
REPORT FROM THE COMMISSION
THE MARKET FOR SOLID FUELS IN THE COMMUNITY IN
1994
THE MARKET FOR SOLID FUELS IN THE COMMUNITY IN
1994
AND THE OUTLOOK FOR
1995
1. This preliminary report analyses the forecasts for 1994 and 1995 prepared by lhe
Member States and forwarded to the Commission in November 1994. Its purpose is to
provide the ECSC Consultative Committee and the circles concerned with the most
up-to-date information on the developments in the Community solid fuels market.
A new report on the market for solid fuels in the Community in 1994 and the outlook for
1995 will be drawn up during the first quarter of 1995.
At the time of writing, no new data had been submitted by France and Denmark.
Therefore the previous data available for these countries for 1994 has been kept for 1995.
2.
On the economic front, contrary to the earlier expectations of a moderately paced
recovery, there is increasing evidence that the Community economy is moving from
a
gentle upswing to a rather vigorous and sustained recovery. Given the recent trend in
economic indicators and the forces at work in the Community economy, real GOP is
now projected to rise by 2% per cent in 1994, strengthening further to close to 3 per cent
in 1995.
3. Previous forecasts for 1994 pointed to a growth in gross inland demand of some 1.6%.
For the first half of the year, the growth in total primary energy demand for the whole
Community was 1.3%. By energy source, only natural gas and hydro have increased by
more than 7% and 35% respectively compared to the same period of the previous year.
On the other hand, demand for lignite has decreased by almost 6%, whilst there has
been a drop of less than 1% for petroleum products and hard coal.
For 1995, bearing in mind the anticipated recovery of the economy, energy demand
could increase by around 2.5%. With respect lo
s~)lid
fuels,
IH~Wl~wr, liH~
demilnd
lor
hard coal could slightly increase whilst lignite could decrease by 5%.
For 1995, current forecasts are for a drop of some 2.2 Mt (-1.6%) to 130.6 Mt, which is one
of the lowest annual decreases seen for many years. The United Kingdom will probably
have the largest drop of some 1.6 Mt (-3.3%), followed by Spain with a decrease of 0.6
Mt (-3.3% ). On the other hand, total hard coal output could increase by 0.6 Mt in
Germany.
1993
1994
1995
1994/93
1995/94
.Ktu.:~l cstimo~l<•s for<>CJst
(«l;(l)U
(«Yu)••·
~e;.gJ?:,!f.9A~
;:;:~:;:::~:~:i:l:~:~::::::. .:. ·.
.N·.::
.t<_,.
·•>xo····.
Resources
Production
158.6
132.7
130.6
-16.3
-l.f>Recoveries
2.5
1.5
1.7
-38.6
7.5
Imports from third countries
115.9
118.1
119.1
1.9
0.9
r-ota I
277.1
252.4
251.3
-8.9
-0.4
Deliveries
To coking plants
52.5
51.5
51.1
-1.8
-0.9
To power stations'
182.5
171.7
172.0
-5.9
0.2
To others
37.9
37.1
36.8
-2.0
-0.8
Exports to third countries
0.4
0.3
0.3
-18.0
-0.3
r-ota I
273.2
260.7
260.2
-4.6
-0.2
ICOK
IR~~ou
Production
39.4
38.5
37.5
-2.3
-2.7
Imports from third countries
3.1
3.8
3.9
22.6
:u
rrotJI
42.5
42.3
41.4
-0.5
-2.2
Deliveries
To steel industry
37.1
39.2
38.4
5.6
-2.1
Oth"r ddivPri<!s within tlw Community 4.8
4.2
4.0
· I 1.0 .(>.]Exports to third countri<'S
0.7
0.7
0.7
-1.4
-'J.7
fot.:~l
42.6
44.2
43.0
3.6
-2.6
~.IGNITE:A.NOiPE:A[i'
: }::::::::
):}:::')!{':}\@
Resources , ... ,.,.,.,. .,.,.,.,.,.,.,., ... ,.,.
Production and imports
301.5
286.7
272.1
-4.9
~5.1Deliveries
To briquetting plants
47.7
38.4
33 .. 4
-19.6
-12.8
To power stations
233.8
230.0
222.5-1.6
-3.3
Others (including exports to third countries)
20.0
18.8
16.3
-6.0
-13.3
r-ota I
301.5
287.2
272.2
-4.7
-5.2
(!) 1l1e sums may not add up due to roundong. • Including industrial and pit head power stations. ··n~~~ variations arc calculated on kl.
5. In 1994, internal hard coal deliveries in the Community could total 260.4 Mt, which is
some 12.5 Mt down on the previous year. This decrease is due to the lower demand
from all the consumer sectors, with the only exception being thermal coal deliveries to
the steel industry. The drop in ddiveries was <•specially marked in
ell~clricity
g<'lll'ration
( -1 0.8 M l;
-5.9% ),
followed by Llw co keries (
-O.lJ
M l;
-1.8% ).
With respect to the hard coal stocks, producers' stocks have declined as much as those of
the consumers'. During the first eight months of the year, some 6 Mt and 10 Mt have
been drawn from stocks at the coal_producers and at the power stations respectively.
Thus, bearing in mind this stock variation, the drop in hard coal
consumpti~n
during
1994should be much less significant than that shown by the deliveries.
With respect to the electricity generating industry, total electricitY- generation could
increase by more than 1% during. 1994 compared to 1993. Natural gas and hydro will be
the only primary energy sources that will take advantage of this increase in electricity
demand.
For 1995, total internal hard coal.deliveries are expected to remain steady at a level of
about 260 Mt, putting an end to the decline registered since 1991 (when deliveries
reached 332 Ml). By
S(~clor,
most of the variations up or down are lower than 0.5
Ml in
absolute terms. Small decreases are forecast in deliveries to cokeries and to other
indus tries.
By country, the main decrease is expected to be in the United Kingdom with a decline of
some 3.0 Mt (-4.5%), whilst in Germany and Belgium deliveries could increase by 2.1
and 0.7 Mt respectively.
6. Crude steel production for 1994 is likely to reach some 137 Mt, which would represent
a rise of almost 3.6% compared to 1993. For 1995, crude steel production could increase
by 3 Mt to reach 140.0 Mt; internal demand would be the main motor for this.
The final figure for coke production in 1994 could turn out to be 38.5
Mt, which is 0.9 Mt
(-2.3%) lower than in 1993, whilst imports from third countries could increase by 0.7 Mt
to 3.8 Mt. Deliveries to the steelworks could be 39.2 Mt (up 5.6%) as result of the
expected increase in crude steel output. Other deliveries of coke in the Community are
expected to be some .4.2
Mt, which is 11.0% down on the previous year. For 1995 a
decline is expected, both in production (down 1.1 Mt or -2?%) and in deliveries to the
steel industry (down 0.8 Mt or -2.1% ), as well as to other Community consumers (down
0.3 Mt or -6.3%) ..
It
is also important to note the gentle increase in deliveries to the steel industry of
thermal coal for pulverised coal injection.
7. Lignite and peat resources in the Con1n{unity in ·1994 are expected to be 14.8
Mt
(-4.9%) lower than in the previous year. The most significant change is the reduction of
13.8 Mt in Germany, due to the lower demand from briquetting plants (-10.3 Mt) and
power plants (-3.0 Mt). For 1995, they are expected to decrease again by 14.6 Mt (-5.1% ),
owing to the expected fall in demand in Germany ..
8. In 1994, imports of hard coal from third countries are expected to rise slightly with
respect to the previous year. Total imports are estimated to be 118.1 Mt, which is 2.2 Mt
(1.9%) more than in 1993. For 1995, they could again increase by a further 1.0 Mt (0.9%),
compared to 1994, to reach 119.1 Mt.
9. With respect to the prices for imported coal, the guide price for coking coal in the
third quarter of 1994 is estimated to
be US$ 53.8 as against US$ 55.3 for the same quarter
of the previous year. This guide price has shown a downwards trend since the peak
reached in the first quarter of 1991 (US$ 60.4).
The weighted average price of steam coal (all contracts and all origins) imported into the
Community in the second quarter of 1994 (the latest information available at the time of
writing) was US$ 42.6 per tee compared with US$ 45.9 per tee for the same period of
the previous year. However, upward movements in the spot fob price have been
registered during the year.
1994 is seeing an exceptional increase on freight rates, reaching levels not seen since the
early 1980's. The increase in trade movements linked to the steel industry and coal
demand, together with other bulk commodities as cement, ferrous scrap, etc.,
particularly in the south-east Asia belt but also to a certain extent in the western
economies as they surge from the recession, have led to tight supply/ demand
conditions.
In the negotiations carried out in the fourth quarter of 1994 for the annual pricing on
contracts for 1995, there appears to be a certain inconsistency as some of them point to
large price increases whilst others point to small increases. Maybe it is too early to
confirm any definite emerging trend in the market, but it does appear that a certain
increase in prices will occur for 1995 compared to 1994 .
.
}!/'('i••<:;:lf:J?I~Iqg~¥9R
QPA t:GQM
l.NG .•.
fgQM TmHP
qQY!WJ'I~ Ui~:
:: ... . }
PERIOD
COKING COAL (US$/1)* STEAM COAL (US$/tce)u
1/1993
57.50
46.96
2/1993
56.80
45.92
3/1993
55.30
42.80
4/1993
55.00
43.12
1/1994
54.70
4~-~12/1994
5-1.00 42.fill.__ _ _
-=-37/l""'~...,.:J-1.53.-SO
---n_-,~,----H4/199-.1
n.a.
n.a.
• Referred to a standard coal quality of: ash-7.5%; moisture-8.0%; sulphur-0.8% and
volatile matter-26%.
•• For electricity generation purposes
l ' .
10. The expansion in the Community's GDP during 1994 is likely to lead to an increase in
total energy demand. However, solid fuels will remain unaffected by this increase in
demand and in fact will witness a significant decrease. The preliminary forecasts for
1995 are less negative, as they show a certain stability in hard coal deliveries, whilst the
lignite market will continue to contract.
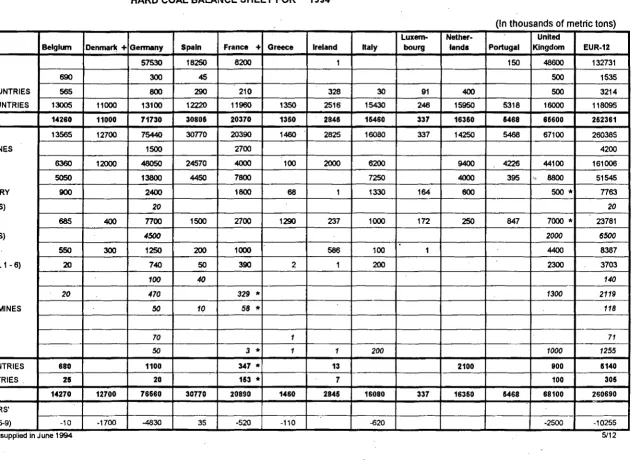
TABLE 1
HARD COAL BALANCE SHEET FOR
1995
(In thousands of metric tons)
Lux
em-
Nether. UnitedBelgium Denmark • Germany Spain France • Greece Ireland Italy
•
bourg lands Portugal Kingdom EUR·121. PRODUCTION (t=t) 58100 17650 7800 1 47000 130551
2. RECOVERIES 800 300 50 500 1650
3. RECEIPTS FROM ECSC COUNTRIES
530
700300
210344
30
84
400 500 30984. IMPORTS FROM THIRD COUNTRIES 13565 11000 14400 12600 11960 1400 2635 15430
226
155505338
15000 119104 5. AVAILABILITIES (1+2+3+4) 148911 11000 73500 30600 19970 1400 2980 15460 310 15950 1338 83000 251305 6. TOTAL INLAND DELIVERIES 14235 12700 77580 30600 20390 1500 2960 16080 310 141505338
64100 259943A.· POWER STATIONS AT MINES 1500 2700 4200
B.· POWER STATIONS 7100 12000
50550
24500 4000 100 2102 62009500
4173 41100 161325C.· COKING PLANTS
4950
13400 4300 7800 72504000
395
9000 51095D.- IRON AND STEEL INDUSTRY 1000
2500
1800 70 1 1330 159500
500*
7860(of which POWER STATIONS)
20
20
!E.· OTHER INDUSTRIES
650
400 7700 1500 2700 1328 247 1000 150 150 7706800
*
23395
(of which POWER STATIONS)
4500
2000
6500
F.- DOMESTIC HEATING 525
300
1250 200 1000609
100 1 44008385
G.· MISCELLANEOUS (TOTAL 1 • 6) 10 680 100 390 2 1 200
2300
3683
1. ISSUE TO WORKERS
90
60
150
2. PATENT FUEL PLANTS
10
450329
1300
2089
3. OWN CONSUMPTION AT MINES ~ ~
58
138
4.GASWORKS
5. RAILWAYS
60
1
61
6. OTHERS ~
3
1
1
200
1000
1245
7. DELIVERIES TO ECSC COUNTRIES 8150 1350 347 14 1700 800 4961
8. EXPORTS TO THIRD COUNTRIES 215 20. 153 6 100 304
9. TOTAL DELIVERIES (6+7+8) 14910 12700 78950 30600 20890 1500 2980 16080 310 16860 5338 66100 260247 10. MOVEMENT OF PRODUCERS'
AND IMPORTERS STOCKS (5-9) -15 -1700 -5450 -920 -100 -620 100 -2100 -10805
- · . . _ ·
TABLE 2
HARD COAL BALANCE SHEET FOR
1994
(In thousands of metric tons)
Lux
em-
Nether- UnitedBelgium Denmar11:
+
Gennany Spain France+
Greece Ireland Haly bourg lands Portugal Kingdom EUR-121. PRODUCTION (t=t)
57530
18250 8200 1 15048600
1327312. RECOVERIES
690
300
45
500 15353. RECEIPTS FROM ECSC COUNTRIES
565
800 290 210 328 30 91 400 500 32144. IMPORTS FROM THIRD COUNTRIES 13005 11000 13100 12220 11960 1350 2516 15430 246 15950 5318 16000 118095 5. AVAILABILITIES (1 +2+3+4) 14260 11000 71730 30805 20370 1350 2845 15460 337 16360 5468 86600 262361 6. TOTAL INLAND DELIVERIES 13565 12700 75440
30no
20390 1460 2825 16080 337 142505468
67100 260385A.- POWER STATIONS AT MINES 1500 2700 4200
B.- POWER STATIONS
6360
1200048050
245704000
1002000
6200
9400
4226 44100 161006C.- COKING PLANTS
5050
138004450
7800 72504000
395 ~8800
51545D.- IRON AND STEEL INDUSTRY
900
2400 180068
1 1330 164600
500*
n63
(ofwhlch POWER STATIONS)
20
20
E.· OTHER INDUSTRIES
685
400noo
1500 2700 1290 237 1000 172 250 847 7000*
23781(of which POWER STATIONS)
4500
2000
6500
F.· DOMESTIC HEATING
550
300
1250 200 1000586
100 14400
8387G.- MISCELLANEOUS (TOTAL 1 - 6) 20 740 50
390
2 1 2002300
37031. ISSUE TO WORKERS
100
40
140
2. PATENT FUEL PLANTS
20
470
329
*
1300
2119
3. OWN CONSUMPTION AT MINES
50
10
58
*
118
4.GASWORKS
5. RAILWAYS
70
1
71
6.0THERS
50
3
*
1
1
200
1000
1255
7. DELIVERIES TO ECSC COUNTRIES
880
1100 347*
13 2100 900 151408. EXPORTS TO THIRD COUNTRIES . 215 20 163
*
7 100 3069. TOTAL DELIVERIES (6+7+8) 14270 12700 76660 30770 20890 1460 2846 16080 337 16360 5468 68100 260690 10. MOVEMENT OF PRODUCERS'
AND IMPORTERS STOCKS (5-9) -10 -1700 -4830 35 -520 -110 -620 -2500 -10255
• Commission estimates; + Data supplied in June 1994 5/12
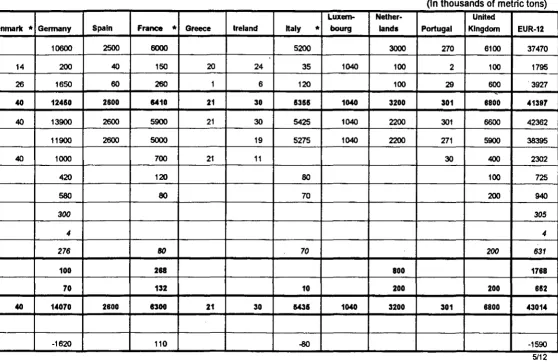
TABLE 3
COKE BALANCE SHEET FOR
1995
(In thousands of metric tons)
Lux em-
Nether·
United
Belgium
Denmark*
Germany
Spain
France*
Greece
Ireland
Italy
*
bourg
lands
Portugal
Kingdom
EUR-12
1. PRODUCTION (t=t)
3800
10600 2500 6000 5200 3000 270 6100 374702. RECEIPTS FROM ECSC COUNTRIES 70 14 200
40
150 20 2435
1040 100 2 100 17953. IMPORTS FROM THIRD COUNTRIES 1075 26 1650
60
260 1 6 120 100 29 600 "3927-4. TOTAL AVAILABILITIES (1 +2+3)
4941
40
12450
2800
1410
21
30
5355
1040
3200
301
8800
41397
5. TOTAL INLAND DELIVERIES 4305
40
13900 26005900
21 30 5425 10402200
301 6600 42362A.- STEEL INDUSTRY 4190 11900 2600 5000 19 5275 1040
2200
271 5900 38395B.- OTHER INDUSTRIES 100
40
1000 700 21 11 30 400 2302C.- DOMESTIC SECTQR 5 420 120
80
100 725D.· MISCELLANEOUS of which : 10 560
80
70 200 9401. ISSUE TO WORKERS
5
300
305
2. OWN CONSUMPTION
4
4
I3.0THERS
5
276
80
70
200
631
6. DELIVERIES TO ECSC COUNTRIES
800
100
268
800
1788
7. EXPORTS TO THIRD COUNTRIES
40
70
132
10
200
200
852
8. TOTAL DELIVERIES (5+6+7)
4941
40
14070
2800
1300
21
30
5435
1040
3200
301
8800
43014
9. STOCK MOVEMENT AT
PRODUCTION & IMPORTS (4-8) -1620 110
-80
-1590
-*
Commission estimates
5112TABLE4
COKE BALANCE SHEET FOR
1994
(In thousands of metric tons)
Lux em- Nether· United
Belgium Dervnark
*
Germany Spain France+
Greece Ireland Italy bourg lands Portugal Kingdom EUR-12I
1. PRODUCTION (t=t)
3850
109003300
6000
5200 2900 270 6100 385202. RECEIPTS FROM ECSC COUNTRIES 70 14 200
40
150 20 1535
1127 175 2 100 19483. IMPORTS FROM THIRD COUNTRIES 1030
26
155060
260
1 4 120 12529
6003805
I~·
4. TOTAL AVAILABILITIES (1 +2+3) 4950 40 12650 3400
8410
21 19 5355 1127 3200 301 6800 423255. TOTAL INLAND DELIVERIES 4250
40
142703400
5900
16 19 5525 11272000
295
6600
43442A.·
STEEL INDUSTRY 4130 121003400
5000 12 5275 11272000
265
5900 39209B.- OTHER INDUSTRIES 100
40
1150 700 16 7 30 400 2443C.- DOMESTIC SECTOR
5
430 120 80 100 735D.· MISCELLANEOUS of which : 15 590
eo
170 200 1055
-1. ISSUE TO WORKERS
5
300
305
2. OWN CONSUMPTION
5
5
3. OTHERS
10
285
80170
200
745
-6. DELIVERIES TO ECSC COUNTRIES 850 350 288
*
ISO
2218-7. EXPORTS TO THIRD COUNTRIES 50 80 132 • 10 250 200 722
8. TOTAL DELIV~RIES (5+6+7) 4950 40 14700 3400 8300 18 19 5535 1127 3200 295 6800 44164
9. STOCK MOVEMENT AT
PRQDUCTION & IMPORTS (4-8) -1850 110 5 -180 6 -1909
._
·*
Commission estimates;
+
Data supplied in June 1994
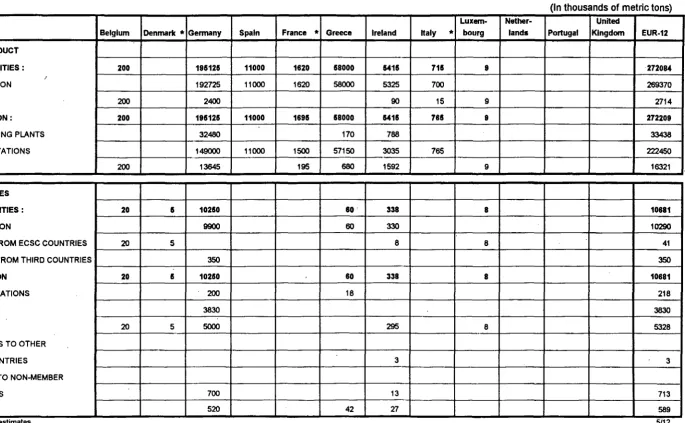
5/12TABLE II
LIGNITE AND PEAT BALANCE SHEET FOR
1995
(In thousands of metric tons)
Lux
em-
Nether- UnitedBelgium Denmark* Germany Spain France * Greece Ireland Italy
•
bourg lands Portugal Kingdom EUR-12A. RAW PRODUCT
- AVAILABILITIES : 200 1911125 11000 1620 118000 5415 715 9 ·27201U
I
PRODUCTION
192725
11000
1620
58000
5325
700
269370
IMPORTS 200
2400
90
15
9
2714
• UTILIZATION: 200 1951211 11000 1695 58000 5415 765 9 272209
BRIQUETTING PLANTS
32480
170
788
33438
POWER STATIONS
149000
11000
1500
57150
3035
765
222450
OTHERS 200
13645
195
6801592
9
16321
B.
BRIQUETTES-AVAILABILITIES: 20 5 10250 80. 338 8 10681
PRODUCTION
9900
60
330
10290
ARRIVAL FROM ECSC COUNTRIES
20
5
a
8
41
IMPORTS FROM THIRD COUNTRIES
350
350
• UTILIZATION 20 5 10250 60 338 8 10681
POWER STATIONS 200
18
218
INDUSTRY
3830
3830
DOMESTIC
20
5
5000
295
8
5328
SHIPMENTS TO OTHER
ECSC COUNTRIES
3
3
EXPORTS TO NON-MEMBER
COUNTRIES
700
13
713
-OTHERS
520
42
27
589
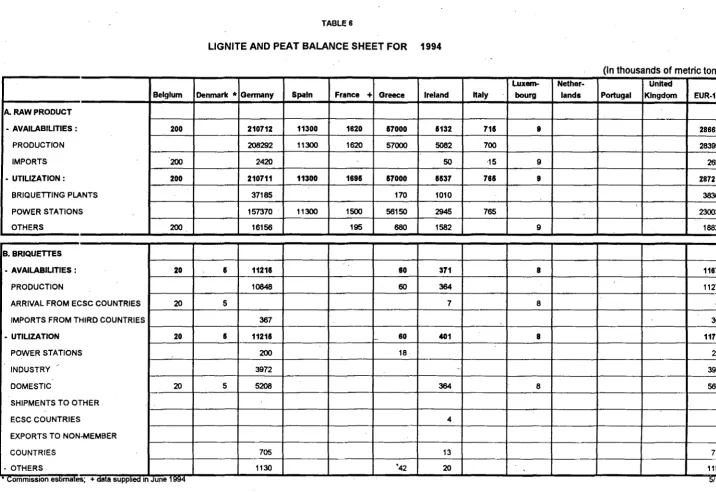
TABLE 6
LIGNITE AND PEAT BALANCE SHEET FOR
1994
(In thousands of metric tons)
Lux
em-
Nether- UnitedBelgium Denmark"' Germany Spain France
+
Greece Ireland Italy bourg lands Portugal Klngdl?fll EUR-12A.
RAW PRODUCT- AVAILABILITIES : 200 210712 11300 1620 &7000 a132 711 9 286688
PRODUCTION
208292
11300
1620
57000
5082
700
283994
I
IMPORTS 200
2420
50
·15
9
2694
- UTILIZATION : 200 210711 11300 169a a7000 1537 78a 9 287217
BRIQUETIING PLANTS
37185
170
1010
38365
'
POWER STATIONS
157370
11300
1500
56150
2945
765
230030
_gTHERS 200
16156
195
6801562
9
18822
-~--- ~- - - ~- -
-B. BRIQUETIES
- AVAILABIUTIES: 20 a 1121a 80 371
8
11879PRODUCTION
10848
60
364
11272
ARRIVAL FROM ECSC COUNTRIES
20
5
7
8
40
IMPORTS FROM THIRD COUNTRIES
367
367
- UTILIZATION 20 a 11218
--
80 4018
11709POWER STATIONS 200
18
218
-·
INDUSTRY
3972
--
3972
DOMESTIC
20
5
5208
364
8
5605SHIPMENTS TO OTHER
ECSC COUNTRIES
4
4
EXPORTS TO NON-MEMBER
COUNTRIES
705
13
718
- OTHERS
1130
'42
20
'1192
-TABLE7A
HARD COAL PRODUCTION BY AREA
5112194
(In thousands of metric tons)1993
1994
1995
Cam pine
BELGIUM
:: 'iRuhr
51474
45010
45900
Aachen
1560
1580
1580
lbbenburen
2066
2050
2030
Saar+Kieinzechen
9075
8890
8590
GERMANY
64175
57530
58100
Central Asturias
3714
3420
3240
Bierzo-Villablino + Narcea
6359
6575
6330
Norte Leon + Palencia
2176
1975
1860
Sur
1802
1980
2100
Aragon-Catalui'la, Baleares
4132
4300
4120
SPAIN
18183
18250
17650
Lorraine
7412
Centre-Midi
1164
FRANCE
8576
8200
+
7800.
IRELAND
1
1
1
Sulcis (Sardinia)
20
ITALY
20
PORTUGAL
197
150
Scotland
North-East
Yorkshire
Nottinghamshire
---·
----·---
----·
-·---Midlands
BC Opencast
14414
Licensed mines + Opencast
3663
UNITED KINGDOM
67463
48600
47000
EUR12
158615
132731
130551
* CommiSSIOn est1mates; + Data supplied m June
1994
TABLE7B
LIGNITE PRODUCTION BY AREA
5112194
(In thousands ofmetric
tons)1993
1994
1995
Rheinland
102100
101600
101000
Helmstedt
3900
3740
3950
----~---