This is a repository copy of
What is the relevant population? Considerations for the
computation of likelihood ratios in forensic voice comparison
.
White Rose Research Online URL for this paper:
http://eprints.whiterose.ac.uk/117387/
Proceedings Paper:
Hughes, Vincent orcid.org/0000-0002-4660-979X and Foulkes, Paul
orcid.org/0000-0001-9481-1004 (Accepted: 2017) What is the relevant population?
Considerations for the computation of likelihood ratios in forensic voice comparison. In:
Proceedings of Interspeech 2017. , Stockholm, Sweden . (In Press)
[email protected]
https://eprints.whiterose.ac.uk/
Reuse
Items deposited in White Rose Research Online are protected by copyright, with all rights reserved unless
indicated otherwise. They may be downloaded and/or printed for private study, or other acts as permitted by
national copyright laws. The publisher or other rights holders may allow further reproduction and re-use of
the full text version. This is indicated by the licence information on the White Rose Research Online record
for the item.
Takedown
If you consider content in White Rose Research Online to be in breach of UK law, please notify us by
What is the relevant population? Considerations for the computation of
likelihood ratios in forensic voice comparison
Vincent Hughes, Paul Foulkes
Department of Language and Linguistic Science, University of York, UK
{vincent.hughes|paul.foulkes}@york.ac.ukAbstract
In forensic voice comparison, it is essential to consider not only the similarity between samples, but also the typicality of the evidence in the relevantpopulation. This is explicit within the likelihood ratio (LR) framework. A significant issue, however, is the definition of the relevant population. This paper explores the complexity of population selection for voice evidence. We evaluate the effects of population specificity in terms of regional background on LR output using combinations of the F1, F2, and F3 trajectories of the diphthong /aɪ/. LRs were computed using development and reference data which were regionally matched (Standard Southern British English) and mixed (general British English) relative to the test data. These conditions reflect the paradox that without knowing who the offender is, it is not possible to know the population of which he is a member. Results show that the more specific population produced stronger evidence and better system validity than the more general definition. However, as region-specific voice features (lower formants) were removed, the difference in the output from the matched and mixed systems was reduced. This shows that the effects of population selection are dependent on the sociolinguistic constraints on the feature analysed.
Index Terms: forensic voice comparison, likelihood ratio, relevant population, regional background
1.
!
Introduction
1.1.!Likelihood ratio-based forensic voice comparison
In forensic voice comparison (FVC), the expert compares the speech patterns in recordings of an unknown offender and a known suspect. Around the world FVC is most commonly conducted using a combination of auditory and acoustic analysis of linguistic-phonetic features [1,2]. There is now widespread consensus across forensic science that the likelihood ratio (LR) is the appropriate framework for the evaluation of this type of comparison evidence. The LR is:
)
|
(
)
|
(
d p
H
E
p
H
E
p
(1)
where p is probability, E is the evidence, Hp is the prosecution
proposition, and Hd is the defence proposition. One of the key
benefits of the LR is the explicit consideration of the probability of the evidence under the competing propositions of both prosecution and defence. In practice, this means an assessment of the similarity between the suspect and offender samples (with regard to the features analysed), and, crucially, the typicality of those features in the wider, relevantpopulation [3,4]. However, a crucial question for the forensic expert is: what is the relevantpopulation?
1.2.!The relevant population
The relevant population is, in principle, determined by the defence proposition (Hd) and should apply to all evidence in the case. For example, if the defence were to claim that the suspect did not commit the crime but that his brother did, the relevant population would necessarily consist solely of the suspectÕs brother. In most cases, however, the definition of Hd is extremely problematic. This is because the defence often offer a non-specific alternative proposition such as: it was not the defendant who committed the crime, it was someone else. In many cases, there may be no alternative proposition at all (for more discussion see [3,5,6]). Therefore, it is necessary for the expert to make pragmatic decisions about the defence proposition. It has been argued that such decisions should be based on the concept of the suspect population [7,8]; i.e. the population of people who could have committed the crime, which is defined by characteristics of the offender. Following this approach, assumptions about the alternative proposition may be based on factors which define the speech community; that is, sociolinguistic groups within the population at large of which the offender is a member, defined by e.g. region, age, and sex. In FVC, this involves a similar process to speaker profiling. (For an alternative approach based on speaker-similarity judged by lay listeners see [9], and a critique of this method in [6].)
1.3.!The complexity of the speech community
in multilingual situations [2,14].
1.4.!Considerations for the relevant population
Given the complexity of systematic between-speaker variation, we suggest there are four considerations that the FVC expert needs to address in defining the relevant population:
1.4.1.! Factors to control
The expert needs to consider which regional and social factors to use to define the relevant population. The factors controlled will necessarily affect LR output to some extent. In [15], we examined the effects of controls over age and socio-economic class in defining the relevant population on the outcome of numerical LR-based testing using New Zealand English speakers. System validity and strength of evidence were marginally better when controlling for class and age, showing that controlling for purely language and sex in FVC may be inappropriate. Predicting the potential magnitude and direction of the effects of different decisions relies on an understanding of the sociolinguistic forces of variation in a given variety. However, there is now also considerable debate about whether the expert should use the evidence (i.e. speaker profile of the offender sample) to define the defence proposition [16,17]. The danger is that the conditioning information may constitute evidence itself; e.g. is it of evidential value that variety of English being spoken is Liverpool English?
1.4.2.! Specificity
The expert also needs to consider the degree of specificity in defining the population with regard to the factors controlled. For instance, regional background can be defined on a very broad level, such as ÔBritish EnglishÕ. But it may be evident (even to lay listeners) that the offender is from the North of England, or more specifically from the North West of England, or more specifically again a speaker of Liverpool English. Leaving aside the issues in [16,17], the background information in the case may also narrow down the relevant population to a very specific regional area.
1.4.3.! Error
In making pragmatic decisions about the relevant population, there is of course a possibility that the expert makes errors. As highlighted in 1.3, this is because it may be difficult to extract regional or social information from the speech signal. The results in [15] highlight that LR output is substantially affected by using a narrow incorrect definition of the population, producing system validity which was considerably worse that that based on a non-specific alternative.
1.4.4.! Certainty
There is uncertainty associated with the subjective decisions made by an expert in defining the relevant population. This is, to some extent, related to specificity such that there will likely be greater uncertainty associated with more specific definitions. As highlighted in [18], to ensure the subjective decisions in FVC are made in a fully Bayesian way, the expert may incorporate uncertainty into the LR computation, such that the greater the uncertainty the more the value of the LR is scaled towards one (i.e. the evidence provides equal support for both propositions, and is of no probative value). This is separate from the threshold-based error consideration (1.4.3), since it is
possible for the expert to be very certain but incorrect about the offenderÕs speech community and vice versa.
1.5.!This study
In this study, we address the issue of the specificity of the relevant population in terms of regional background using a linguistic-phonetic feature as input: the diphthong /aɪ/ parameterised using F1, F2, and F3 trajectories. For a set of test speakers of standard southern British English (SSBE), calibrated LRs were computed using a non-specific population (i.e. representative of British English in general) made up of a mixture of SSBE, Derby, Manchester, and Newcastle speakers, and a tailored population made up exclusively of SSBE speakers. These results were compared in terms of the strength of evidence produced and system validity, evaluated using equal error rate (EER) and the log LR cost function (Cllr [19]).
As highlighted in [15], this experiment reflects the pragmatic decisions that the expert may make in FVC cases. The paradox is that without knowing who the offender is, it is not possible to ascertain the population of which he is a member. Thus, it is not unrealistic for the FVC expert to use, as a means of exercising caution in the analysis, a more general definition of the relevant population, as used here.
2.
!
Method
2.1.!Speakers
A total of 121 speakers from four regional varieties of British English were analysed. The data included 72 speakers of SSBE chosen at random from the DyViS corpus [20] and three datasets each containing eight speakers from Manchester [21], Derby, and Newcastle [22]. All speakers were matched in terms of sex (male) and age (18-30). The Manchester, Derby, and Newcastle samples were all collected for sociolinguistic purposes and so only a single sample per speaker was available. This necessarily limits the estimate of intra-speaker variation, which is real forensic casework would typically come from two non-contemporaneous samples. However, the recordings contained spontaneous speech and were well matched for style.
2.2.!Input feature
The formant trajectories of F1, F2, and F3 from the diphthong /aɪ/ were used as input data. The dynamics of formant trajectories are very useful features in FVC and have been shown to carry considerably more speaker-specific information than traditional static midpoint formant measures [23]. This is because they capture not only information about absolute frequency, but temporal variation. /aɪ/ was chosen because it has received considerable attention in FVC [11,23]. It occurs in high frequency words that are likely to occur even in short FVC samples (e.g. hi, bye), and for most varieties of English displays considerable movement within acoustic space [24].
2.3.!Data extraction
a range of 0-5kHz. Heuristics were applied to remove obvious measurement error. This involved removing statistical outliers and imposing upper and lower accept-reject thresholds for considering values as errors. Each formant trajectory was fitted with a cubic polynomial curve. The four polynomial coefficients per formant were used as input for computing numerical LRs. Cubic polynomials were used over other representations based on pre-testing of system performance using the SSBE data (see [6]). For each speaker between 10 and 43 tokens were available for analysis.
2.4.!LR computation, calibration, and evaluation
The same testing procedures as in [15] were followed. This involved using a set of homogeneous speakers as test data to act as the suspects and offenders for same- (SS) and different-speaker (DS) comparisons analysed in FVC casework. The definition of the relevant population was then used to determine the system data for both the feature-to-score (typicality) and score-to-LR (calibration) stages (see [27] for more).
From the 72 SSBE speakers, 40 were chosen at random to function as test data. The remaining 32 speakers were used as matched system data (development and reference speakers). The matched condition reflected the defence proposition that the voice in the offender sample does not belong to the defendant, but to another male speaker of SSBE. From these 32 speakers, eight were chosen at random and combined with the Manchester, Derby, and Newcastle speakers to form a 32 speaker mixed system dataset. The mixed condition reflected the more general defence proposition that the voices in the offender sample does not belong to the defendant, but to another male speaker of British English.
Cross-validated multivariate kernel density (MVKD [28,29]) SS and DS scores were initially computed using the matched speakers and mixed speakers separately. Given that only one sample per speaker was available, data for each speaker was divided in half to allow SS comparisons. Based on these scores, logistic regression calibration coefficients were calculated for each condition (matched and mixed) [30]. MVKD scores were then computed for the test data (again using the two halves of each speakerÕs data) using the matched and mixed speakers as separate sets of reference data. These scores were calibrated using the coefficients generated from the appropriate set. This produced two parallel sets of log10 LRs (LLRs) for the same 40 SS and 1560 DS comparisons processed using the matched and mixed systems. LR output from the two systems was evaluated based on the strength of the evidence produced and measures of system validity Ð which determine how well the system separates SS and DS pairs (EER and Cllr; [19]).
The experiment was run using all three formants, F2 and F3, and F3 only as input, to test predictions about the speaker- and region-specific information encoded in different formants. Lower formants (particularly F1 and F2) are associated with the maintenance of contrast and are, as such, more closely tied to accent/dialect. Higher formants, however, have been shown to carry much more speaker-specific information. Therefore, LR output should be most sensitive to changes in population definition using lower formants than higher formants.
As highlighted above, the data used in this study are not forensically realistic in that the comparisons are contemporaneous, based on data extracted from the same session. There is also no technical or style mismatch between the samples used for comparisons. This means that within-speaker variability is likely to be underestimated relative to real
FVC cases, and system performance will therefore be overly optimistic. However, the choice of corpora was a pragmatic decision, since forensically realistic datasets are not available with sufficient coverage of the complex regional and social variation found in British English necessary to address the research question of population specificity.
3.
!
Results
The distributions of LLRs are firstly considered for each combination of formants. The comparative performance of the matched and mixed systems is then considered.
[image:4.595.347.492.310.438.2]3.1.!F1, F2, and F3
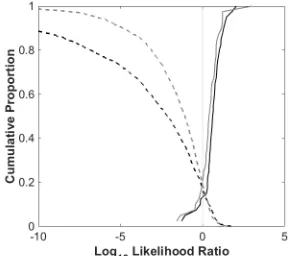
Figure 1 displays the Tippett plot of LLRs (see [31]) produced by the matched and mixed systems using all formants as input. There was considerable similarity in the SS LLRs for both systems with most SS comparisons producing LLRs within range of +1 to +2. However, the proportion of contrary-to-fact SS LLRs (SS comparisons producing DS evidence) was higher for the matched system (15%) than the mixed system (5%).
Figure 1: Tippett plot of SS (bold) and DS (dashed) LLRs for F1, F2, and F3 input using matched (black)
and mixed (grey) system data.
Marked differences, however, were found for DS comparisons. The strength of DS evidence was considerably greater using the matched system compared with the mixed system. On average this was equivalent to a difference of four orders of log10 magnitude. The proportion and magnitude of contrary-to-fact DS LLRs was also considerably higher for the mixed system.
3.2.!F2 and F3
The output based on F2 and F3 was evaluated to recreate the common forensic scenario in which F1 is not usable due to both technical and speaker effects related to telephone transmission. The same patterns as in 3.1 were found when F1 was removed. However, the difference between the systems was reduced somewhat. The distributions of matched and mixed SS LLRs overlapped considerably, and the difference in the proportion of contrary-to-fact SS LLRs reduced from 10% to 2.5%. Although the DS LLRs were still stronger using the matched system, the average difference with the mixed system was reduced to three orders of log10 magnitude.
3.3.!F3 only
with 3.2, the removal of F2 further reduced the strength of the LLRs, offering evidence to suggest that F1 and F2 are carriers of speaker-specific information for this vowel in these varieties. The removal of F2 also further minimised the effects of using mixed system data compared with the matched system. The distributions of matched and mixed SS LLRs were extremely similar. While the matched DS LLRs were still generally stronger, the average difference with the mixed system was just one order of log10 magnitude. The proportions of contrary-to-fact DS comparisons were also very similar.
Figure 2: Tippett plot of SS (bold) and DS (dashed) LLRs for F3 input using matched (black) and mixed
(grey) system data.
3.4.!System validity
[image:5.595.87.252.486.562.2]Table 1 shows the validity of the matched and mixed systems based on different input. Across all three combinations of formants, EER was worse for the mixed system than for the matched system. With the exception of F3 only input, the EER differences were relatively small (c. 1%). For F3 only input EER was markedly higher using the mixed system (by c. 7%).
Table 1: Validity (EER and Cllr) of the matched and
mixed systems using combinations of formants.
matched mixed
EER (%) F1,F2,F3 9.94 10.54 F2,F3 14.87 15.35 F3 12.53 19.42 Cllr F1,F2,F3 0.325 0.396 F2,F3 0.475 0.572 F3 0.511 0.646
Across both the matched and mixed systems, Cllr increased as the amount of acoustic input data was reduced. As with EER, Cllr was also consistently higher (i.e. worse) using the mixed system. Interestingly, the smallest Cllr difference between the systems was found using all three formants as input. The difference between the systems increased as F1 was removed, and increased again with the removal of F2.
4.
!
Discussion
The results reveal many effects of regionally matched and mixed definitions of the relevant population in system testing using the diphthong /aɪ/. The distributions of SS LLRs were generally comparable across the systems. However, DS LLRs were weaker by up to four orders of log10 magnitude for the mixed system (using F1, F2, and F3). Further, validity was
consistently worse (by up to 7% EER and 0.15 Cllr) when using the Mixed system compared with the Matched system.
The removal of F1 and then F2 generated lower magnitude LLRs and generally worse system validity across both systems. This confirms our prediction (see 2.4) that F1 and F2, which are known to encode phonetic contrast and systematic regional and social variation, can carry considerable speaker discriminatory information. Further, the removal of F1 and F2 reduced the divergence between the matched and mixed systems in terms of the distributions of LLRs, such that LLRs were most similar across systems when using F3-only input. These results suggest that there may be a trade-off between the speaker discriminatory potential that lower formants (F1 and F2) provide and the regional sensitivity they introduce into LR-system testing. That is, with the removal of F1 and F2, the strength of evidence and overall system performance may be lower, but the effects of regional variation, at least in terms of the magnitudes of the LLRs themselves, may be minimised.
Somewhat different patterns were revealed in terms of the matched and mixed validity across the three sets of /aɪ/ input. The EER for the mixed system was only marginally higher than that of the Matched system when using all three formants and with the removal of F1. However, the largest difference between the systems in terms of EER was found when using F3-only (c. 7%). Similarly, the smallest difference between the systems in terms of Cllr was found using F1, F2, and F3, followed by F2 and F3. As with EER, the largest Cllr difference between systems was found using F3 only (c. 0.15). This finding runs contrary to the prediction that LR output based on F3 may be most robust to different definitions of the relevant population based on the hypothesis that it encodes more information relating to the individual rather than regional and social information relating to the group [31].
These results have important implications for casework. While the more specific population produced better validity and stronger evidence, there is a greater associated risk of incorrectly defining the population. As shown in [15], this can have detrimental effects on LR output. Therefore, it may be appropriate to present a range of conclusions under different assumptions about the relevant population.
5.
!
Conclusion
This study has explored issues and considerations for the definition of the relevant population in FVC casework. Empirical testing has also shown the potentially substantial effects of population specificity, with regard to regional background, on LR output. However, this study focused on a single linguistic-phonetic feature (i.e. a phoneme) and a single source of systematic between-speaker variation. Future work should, therefore, consider more forensically realistic conditions where multiple features are analysed, and the pragmatic decision about population selection is considerably more difficult.
6.
!
Acknowledgements
7.
!
References
[1]! E. Gold and J. P. French, ÒInternational practices in forensic speaker comparison,Ó International Journal of Speech, Language and the Law vol. 18, pp. 293Ð307, 2011.
[2]! J. P. French, F. Nolan, P. Foulkes, P. Harrison, and K. McDougall, ÒThe UK position statement on forensic speaker comparison; a rejoinder to Rose and Morrison,Ó International Journal of Speech, Language and the Law vol. 17, pp. 143Ð152, 2010.
[3]! C. G. G. Aitken and F. Taroni, Statistics and the Evaluation of Evidence for Forensic Scientists (2nd edition). Chichester: Wiley,
2004.
[4]! F. Nolan, ÒSpeaker identification evidence: its forms, limitations, and roles,Ó in Proceedings of the Law and Language: Prospect and Retrospect Conference, December 12Ð15, Levi, Finland, 2001.
[5]! B. Robertson and G. A. Vignaux, Interpreting Evidence: Evaluating Forensic Science in the Courtroom. Oxford: OUP, 1995.
[6]! V. Hughes, The Definition of the Relevant Population and the Collection of Data for Likelihood Ratio-Based Forensic Voice Comparison, Unpublished PhD Thesis, University of York, UK, 2014.
[7]! R. L. Smith and R. P. Charrow, ÒUpper and lower bounds for the probability of guilt based on circumstantial evidence,Ó Journal of the American Statistical Association vol. 70, pp. 555Ð560, 1975. [8]! R. Lempert, ÒModelling relevance,Ó Michigan Law Review vol.
89, pp. 1021Ð1057, 1977.
[9]! G. S. Morrison, F. Ochoa, and T. Thiruvaran, ÒDatabase selection for forensic voice comparison,Ó in Odyssey 2012: The Language and Speaker Recognition Workshop, June 25Ð28, Singapore, Proceedings, 2012, pp. 74Ð77.
[10]!P. Rose, ÒTechnical forensic speaker identification from a Bayesian linguistÕs perspective,Ó in Odyssey 2004: The Language and Speaker Recognition Workshop, May 31ÐJune 3, Toledo, Spain, Proceedings, 2004, pp. 3Ð10.
[11]!G. S. Morrison, ÒLikelihood-ratio voice comparison using parametric representations of the formant trajectories of diphthongs,Ó Journal of the Acoustical Society of America vol. 125, pp. 2387Ð2397, 2009.
[12]!P. L. Patrick, ÒThe speech community,Ó in J. K. Chambers, P. Trudgill, and N. Schilling-Estes (Eds.), Handbook of Language Variation and Change. Oxford: Wiley-Blackwell, pp. 573Ð597, 2008.
[13]!D. Britain, ÒSpace, diffusion and mobility,Ó in J. K. Chambers and N. Schilling-Estes (Eds.), Handbook of Language Variation and Change (2nd edition). Oxford: Wiley-Blackwell, pp. 471Ð500,
2013.
[14]!P. Foulkes and J. P. French, ÒForensic speaker comparison: a linguistic-acoustic perspective,Ó in P. Tiersma and L. Solan (Eds.), Oxford Handbook of Language and the Law. Oxford: OUP, pp. 557Ð572, 2012.
[15]!V. Hughes and P. Foulkes, ÒThe relevant population in forensic voice comparison: effects of varying delimitations of social class and age,Ó Speech Communication vol. 66, pp. 218Ð230, 2015. [16]!T. Hicks, A. Biedermann, J. A. de Koeijer, F. Taroni, C.
Champod, and I. W. Evett, ÒThe importance of distinguishing informantion from evidence/observations when formulating propositions,Ó Science and Justice vol. 55, pp. 520Ð525, 2015. [17]!G. S. Morrison, E. Enzinger, and C. Zhang, ÒRefining the relevant
population in forensic voice comparison Ð a response to Hicks et alii (2015) The importance of distinguishing information from evidence/observations when formulating propositions,Ó Science and Justice vol. 56, pp. 492Ð497, 2016.
[18]!N. BrŸmmer and E. de Villiers, ÒWhat is the Ôrelevant populationÕ in Bayesian forensic inference?Ó https://arxiv.org/abs/1403.6008, 2014.
[19]!N. BrŸmmer and J. du Preez, ÒApplication-independent evaluation of speaker detection,Ó Computer Speech and Language
vol. 20, pp. 230Ð275, 2006.
[20]!F. Nolan, K. McDougall, G. de Jong, and T. Hudson, ÒThe DyViS database: style-controlled recordings of 100 homogeneous
speaker for forensic phonetic research,Ó International Journal of Speech, Language and the Law vol. 16, pp. 31Ð57, 2009. [21]!B. Haddican, ÒA comparative study of Language change in
Northern Englishes,Ó Economic and Social Research Council (ESRC) of Great Britain Grant. R061250033, 2008Ð2013. [22]!L. Milroy, J. Milroy, and G. J. Docherty, ÒPhonological variation
and change in contemporary British English,Ó Economic and Social Research Council (ESRC) of Great Britain Grant.
R000234892, 1994Ð1997.
[23]!K. McDougall, ÒSpeaker-specific formant dynamics: an experiment on Australian English /aɪ/,Ó International Journal of Speech, Language and the Law vol. 11, pp. 103Ð130, 2004. [24]!P. Rose, Y. Kinoshita, and T. Alderman, ÒRealistic extrinsic
forensic speaker discrimination with the diphthong /aɪ/,Ó in 11th
Australasian International Conference on Speech Science and Technology, December 6Ð8, Auckland, New Zealand, 2006, pp. 329Ð334.
[25]!R. Rhodes, Using /aɪ/ to Discriminate between Derby Speakers using Formant Dynamics in Spontaneous Speech, Unpublished MSc Dissertation, University of York, UK, 2009.
[26]!P. Boersma and D. Weenink, ÒPraat: doing phonetic by computer,Ó version 5.3.62, 2014.
[27]!G. S. Morrison, ÒTutorial on logistic-regression calibration and fusion: converting a score to a likelihood ratio,Ó Australian Journal of Forensic Sciences vol. 45, pp. 173Ð197, 2013. [28]!G. G. G. Aitken and D. Lucy, ÒEvaluation of trace evidence in the
form of multivariate data,Ó Applied Statistics vol. 54, pp. 109Ð 122, 2004.
[29]!G. S. Morrison, ÒMATLAB implementation of Aitken and LucyÕs (2004) forensic likelihood-ratio software using multivariate-kernel-density estimation,Ó http://geoff-morrison.net/#MVKD, 2007.
[30]!N. BrŸmmer et al., ÒFusion of Heterogeneous Speaker Recognition Systems in the STBU Submission for the NIST SRE 2006,Ó IEEE Transactions on Audio Speech and Language Processing vol. 15, pp. 2072Ð2084, 2007.
[31]!D.Meuwly, Reconnaissance de locuteurs en sciences forensiques: lÕapport dÕune approche automatique, Unpublished PhD Thesis, University of Lausanne, Switzerland, 2001.
![Figure 1 displays the Tippett plot of LLRs (see [31]) produced by the matched and mixed systems using all formants as input](https://thumb-us.123doks.com/thumbv2/123dok_us/7758260.169244/4.595.347.492.310.438/figure-displays-tippett-llrs-produced-matched-systems-formants.webp)