International Journal of Innovative Technology and Exploring Engineering (IJITEE) ISSN: 2278-3075,Volume-8, Issue-10S, August 2019
Abstract: Water distribution system is a network that supplies water to all the consumers through different means. Proper means of providing water to houses without compromising in quantity and quality is always a challenge. As it is a huge network keeping track of the utilization is difficult for the utility. Hence through this project we come up with a solution to solve this issue. Current technologies like Low Power Wide Area Networks, LoRa and sensor deployment techniques have been in research and were also tested in few rural areas but issues due to hardware deployment and large scale real time implementation was a challenge hence through this system we aim to create and simulate a real time scenario to test a sensor network model that could be implemented in large scale further. This project aims in building a wireless sensor network model for a smart water distribution system. In this system there is bidirectional communication between the consumer and the utility. Each house has a meter through which the amount of water consumed is sent to the utility board. The data has two fields containing the house ID and the data (water consumed); it is being sent to the data collection unit (DCU) which in-turn sends it to the central server so that the consumption is monitored in real time. All this is simulated using NETSIM and MATLAB.
Index Terms: water distribution system, wireless sensor network model, bi-directional communication, NETSIM, MATALB.
I. INTRODUCTION
From the outer space, the planet earth appears blue in color with approximately 71% of the surface area covered with water [1]. Only 1% of water is available in the readily usable form for various human needs. The demand for water is in steady increase and many scientists fear that the water shortage is eminent in future [2]. If statistics are to be believed then by 2030 world is going to face a severe water crisis [3]. Optimized use of water is always a challenge. Frequent occurrences of natural calamities like drought, flood, etc it has become difficult to maintain and manage the vital resources properly. According to a survey in the year 2017 by the Public Utilities Board of Singapore the demand is about 430 million gallons of water per day and per capita consumer’s consumption is around 143 litres [4].
Revised Manuscript Received on July 08, 2019.
Shruthi Venkat, Department of Electrical and Electronics Engineering, Amrita School of Engineering, Coimbatore, Amrita Vishwa Vidyapeetham, India.
R.Ranjith, Department of Electrical and Electronics Engineering, Amrita School of Engineering, Coimbatore, Amrita Vishwa Vidyapeetham, India
Ever since the inception of civilization, humans were developing infrastructure to utilize the naturally available water resource for daily needs. With the recent technological advancements in the fields of communications and automation, various systems are developed at a low cost to efficiently use the water resource. Since the amount of water being wasted every year is increasing in a large scale; finding and implementing means to monitor and control the consumption is one area which needs to be focused on. Combining the Information Technology and the water distribution system can establish a contact between the consumer and the utility in real-time. Monitoring and alerting of over consumption could help the consumers to utilize the water economically. This paper discusses about implementing automation in a typical urban water distribution system. A small scale water distribution system has been implemented in MATLAB Simulink. Automation requires communication between various components within the system. So to test the communication, NETSIM has been integrated with the water distribution model in Simulink. The data transfer between the nodes can be monitored using WIRESHARK. Remainder of the paper is organized as follows Section 2 examines the previous researches in automating water distribution system, section 3 describes the methodology, section 4 and section 5 discuss about the fault identification system and subsequent results respectively.
II. LITERATURE SURVEY
Implementation of water management system involves deployment of multiple sensor and actuator nodes throughout the water distribution system. Sensing nodes play a vital role in collection of water flow data from various parts of water distribution. This would play a vital role in keeping track of water usage and identification of faults within the system. Currently data collections are done manually along with Internet of Things (IoT) and Data Analytics for data communication and processing respectively. It includes checking water level of the tanks and sending the readings to the server via Arduino or Raspberry Pi and visualized through a web interface in Ubidots [3]. The use of Information and Communication Technology has addressed challenges faced in the urban water networks by means of continuous monitoring system
for the water distribution system [5]. Brazil’s water
A Wireless Sensor Network Model for
E-Metering and Fault Identification in Smart
Water Distribution Systems
supply system was considered as a hydraulic model and was simulated using linear predictive algorithms and servo motor controllers stating that this model could improve the efficiency [6]. Sensor network models were designed and tested to detect pipeline leakages. Underground Wireless Sensor Networks were implemented. Optimal techniques of sensor placement, leakage identification and isolation of pipeline systems were also tested but were adaptable for only large scale systems. This system was tested in Barcelona using District Metered Networks, where identification of leakage pipelines was done manually. It also proved to be an effective structural model that also helped in analyzing faults. The sensors aided in collection of real time data [7]. For a longer range of communication LoRa (Long range Radio) was used in Low Power Wide Area Networks. It also brings in IoT platforms for real time data analysis [8]. Water WiSe is a sensing platform for real time monitoring of water distribution systems which can be used by the utility. It also provides support for a sustainable water management system [9]. Smart Water Grids integrate the Information and Communication Technologies with the water management system. It is seen as a vital solution for resolving water related issues globally. It provides better management schemes and intelligent control of the water infrastructure by establishing a bi-directional communication between the utility and the customer [10]. Various concepts and technologies like data analytic tools, prediction algorithms and Artificial Intelligence techniques were proposed to detect real time pipe bursts and pressure variations in the pipelines so that leaks could be monitored and reduced. A more of statistical and probabilistic approach has been taken to monitor and analyze such scenarios [11]. A Smart Water Grid was developed to focus on implementing intelligent control flow, energy efficiency, better schematics and methods to ensure a better and quality water management system [12]. Detection algorithms for identifying faults in pipelines and events where water wastage could be possible and methods to eradicate them have also been proposed [13]. A sustainable water management technique on ground water is necessary and using IOT techniques the system is automated to develop a smart management for consumption and wastage [14]. Various techniques and concepts have been proposed for proper utilization of this vital resource. This paper focuses on simulating a small scale water distribution system in Simulink with sensing and actuating nodes. Communication between the nodes has been simulated using NETSIM software.
III. SYSTEMOVERVIEW&METHODOLOGY The Water Management System is a consumer-utility model where the water consumed by each household unit is constantly monitored with the help of existing smart meters integrated into a WSN network and control action being taken by the water management system to mitigate or increase the water supply from a main tank to each of the individual household water tanks. Consider 3 houses/consumer’s having individual water tanks denoted as
V1, V2 and V3 with smart meter’s installed and the main tank denoted as V as shown in figure 1. In addition to the electricity and gas consumed, the water consumption data is also integrated to the metering system. A wireless sensor network is deployed to handle the robust data transmission from individual smart meters. The wireless sensor network forms the backbone for all data transactions. It will comprise of nodes deployed at consumer end, a Data Collector node (DCU) and the central node at the water distribution control center. The data transmitted by the nodes at consumer will have the following fields: House ID, Current consumption (E), Water consumption (W) and the Gas consumption (G). Our primary focus will be on water consumed and it is the intelligence of the central node to determine the water consumed by each household based on House ID. For a specific region, we can consider it as ‘n’ number of households with one Data Collector Unit per region. The DCU’s receives the bulk of data, create a database of all the received data and forwards it to the central node for further processing and to take control action. The central node has the responsibility to take control action to regulate the water supply from main tank based on the water consumption data received. The nodes also have the intelligence to report any node failure and if the water consumption has crossed the threshold. The overconsumption can also be reported by a central node to the consumer to mitigate water consumed and thus there is a two-way communication between utility and the consumer as well. The overall system is modeled in two separate categories. The consumer end nodes are modeled in SIMULINK to show the actuators involved which will be the water tank, pump and pipe connections and a subsystem which will play the role of determining the volume of water consumed. With the help of MATLAB to NETSIM interface option, the sensor node data from simulation is used by the wireless sensor network modeled in NETSIM. The WSN modeled in NETSIM will highlight the packet transactions between nodes and the central node. The entire network modeled in NETSIM is termed as Water Management System (WMS). The central node takes the decision in this network for water distribution, supply and to detect leakage. The sensor node in the WMS has the intelligence to report node failure which supports central node in detecting node failures easily.
Fig.1 Block Diagram
A. Simulink model
International Journal of Innovative Technology and Exploring Engineering (IJITEE) ISSN: 2278-3075,Volume-8, Issue-10S, August 2019
consumer end nodes. Each node comprises of a tank station, pipes and a pump subsystem to regulate the water level reading. Consumer node 1 has tank station 1/water tank 1, water properties vital for pump characteristics and the pump station subsystem. In this model, 4 tanks or 4 sensor nodes which determine the volume of water level are considered. The water level readings in cubic meters of each tank are displayed as shown in the display board. The subsystem model properties allow distinguishing the water level reading by mapping it to tag names. Tag u1 for volume of water level in tank 1, Tag u2 for volume of water level in tank 2 and so on. The system is made to run 100-time units which lets the water to flow from each tank through the ports T and P of each pumping station and then to the main pipes. The volume of water level consumed is shown in the display board. This data is extracted to MATLAB workspace which thereby is used by NETSIM to simulate the WMS network. The model also depicts a node failure case where tank 2 water level reading is indefinite or undefined. For simulation, the sensor node threshold value for indefinite or undefined reading is set as 80 here. This will result in sensor node data taken by NETSIM to consider it as a failed node.
Fig. 2 Wireless sensor network model using SIMULINK
B. Netsim model
The Water Management System Network is modeled in NETSIM. WSN architecture is followed here by the WMS. NETSIM uses the SIMULINK modeled sensor node data obtained from MATLAB workspace using the NETSIM-MATLAB interface option. Each sensor data from MATLAB workspace is modeled as sensor nodes in NETSIM environment. As shown in Fig.3 the water level readings of 4 nodes are transferred to a gateway or Data Collector Unit and thereby forwarded to the Control Station Node. TANK_STATION 1 depicts sensor node 1. TANK1_READING corresponds to the SIMULINK modeled sensor node data depicting tank 1 volume level. The NETSIM tool thus allows packet tracing and establish to
model a wireless sensor network deployed for a WMS.
Fig.3 Wireless sensor network model using NETSIM
C. INTERFACING MATLAB – NETSIM
The MATLAB-NETSIM interface provides the link between SIMULINK modeled sensor node data with the NETSIM based WMS network. Each sensor node in WMS is mapped to the sensor node data modeled in SIMULINK which hereby can be accessed by NETSIM from MATLAB workspace.
The interfacing of the tools is done for showing the data exchange from the customer and utility. It follows a series of steps as shown in the Fig.4
Fig 4: Flowchart for NETSIM-MATLAB interface
The three main functions used for the interface are the init (), run (), finish (). Once the simulation runs in the NETSIM environment the init () in the Matlab_interface.c file of the application layer is called which starts the MATLAB engine. Inside the run () the SIMULINK model is invoked. The simulation runs for the specified time scale and the readings are obtained in the metrics table and in an event trace.
D. Working of the Model
The entire working of the WMS network is divided by running two simulation software’s; MATLAB to model the sensor nodes data and NETSIM to model the WMS network which mimics WSN network architecture. Both the simulations have to be run parallel to observe and understand the data transfer, control action and communication taking place in the network for a Water Management System. In this work, four nodes named TANK_STATION_1,
TANK_STATION_2, TANK_STATION_3, and
TANK_STATION_4 are created in the NETSIM environment among which CONTROL STATION node is termed as the destination node. The WMS network has 3 network components. The tank station node, the Router or DCU node and the Control Station node. The source ID’s are unique for each node and the destination ID for control node being same for all. To view the data transmissions happening between each node; enable the dynamic metrics, packet trace and event trace in NETSIM.
data of water level reading, in SIMULINK four corresponding tank nodes are modeled and simulated for 100 time units. Each node has an ID and it is associated to the nodes created in the NETSIM model in the application layer. Using the functions mentioned in the flow chart fig.4 the simulation started in NETSIM starts the MATLAB model in the background. Transfer of water level reading of each water tank modeled in SIMULINK is extracted by NETSIM created in the MATLAB workspace.
On running NETSIM we can see the packet transmission from nodes in the animation zone. The metrics table as in Fig 5, 6 , 7 and 8 shows the data packet state for link wise and sensor node level wise. Consider Fig 5, Link_1_Throughput_Graph and the Network_metric depicts the bandwidth and packets transferred by Node 1 communication link, Application_metrics depicts the data transfer at each sensor node level and also the data rate from each sensor node/water tank station depicted by TANK_1_READING_Throughput_Graph. With the help of PACKET TRACE we can export the data to an Xcel sheet to view the status of each node in more detail.fig.5 shows the tank node1 and its dynamic metrics plot. Fig.6 shows the tank 2 and its dynamic metrics. Fig.7 shows the metrics for tank 3 and Figure 8 shows the metrics for tank 4.
The results are obtained as metrics and graph in NETSIM and also individual packet transfers can be viewed using the WIRESHARK tool while simulating.
Fig.5 Tank node-1 Metrics
Fig.6 Tank node -2 Metrics
Fig.7 Tank node – 3 Metrics
Fig.8 Tank node -4 Metrics
International Journal of Innovative Technology and Exploring Engineering (IJITEE) ISSN: 2278-3075,Volume-8, Issue-10S, August 2019
Fig.9 Node failure at tank node -2
V. RESULTS
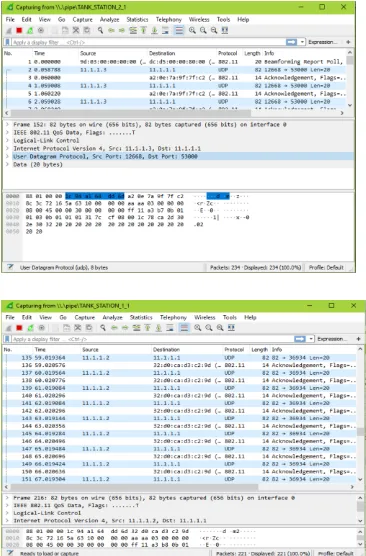
The WMS network simulated in NETSIM results in the creation of an actual WSN network with data transferred to be the water level reading from node to node. Each sensor node is provided with IP address as shown in Fig 10, 11 and 12. Eg: 11.1.1.3 corresponds to the TANK_STATION_3. The IP address and the network address details are provided in the NETSIM simulation settings. Fig 10 and 11 shows individual packet trace between each sensor nodes/tank stations to the DCU or router (11.1.1.1). This is possible with the help of WIRESHARK tool in NETSIM.
The results are obtained to showcase the wireless communication established between tank stations at each household with the DCU and finally the central node. The network simulated can be used as a model to deploy WMS network in the field. The packet data (In hex) which is the water level reading can also be observed as highlighted in Fig 10 in the WIRESHARK packet capture window.
Fig. 12 shows the packet trace at the central node (IP address: 11.2.1.2). Data packets from multiple sensor nodes are received by central node. The central node shall have the intelligence to extract data and take control action based on water level reading of a water tank. Also, each packet data received/transmitted along the WMS network can also be obtained in excel sheet generated by the NETSIM tool as shown in Fig 13.
[image:5.595.314.497.50.328.2]On interfacing, a successful communication has been established between the tanks modeled in MATLAB and the nodes created in NETSIM. This is helpful in monitoring the water consumption at different houses at the utility side. By injecting a fault a small fault identification system has been simulated. This could be proved helpful in large area level where the utility could identify the fault from the data being received
[image:5.595.57.275.50.186.2]Fig.10 WIRESHARK traces of node 1 and node 2
Fig.12 WIRESHARK trace of control node (destination node)
The figure13 shows the packet trace of the nodes in the WMS network in NETSIM. It shows the details of the data being passed from physical layer till the application layer in each sensor node. It shows the time information of each packet transfer, details regarding the destination, successful packet transfer and failure of the packet. This data sheet is obtained as an Excel data that can be exported from the NETSIM tool for further use. The data below provides each level of packet transfer details in user readable format which can be useful for monitoring and diagnosis of nodes by the user and for operating the WSM operation to detect network failures.
Fig.13 NETSIM Packet Trace.
VI. CONCLUSION
Smart water grid has the potential to save wasted water, improve water quality detection and improve water distribution infrastructure. The simulation network created here is a small scale demonstration of a real time scenario this could be implemented in a large scale over a wide area of network consisting of many more nodes. There are various methods and solutions have been proposed to build a smart water management system so that the amount of water usage can be made optimal. Preserving a vital resource is necessary. The method proposed here can be viewed via a simulation. The entire architecture of the smart water management system for a particular community or region is mimicked and designed in a network simulator and MATLAB tool. This can be demonstrated using a Node-MCU and Raspberry Pi as the central server. IoT and intelligent control algorithms to detect leakage and faults in the pipelines could be implemented so that necessary action could be taken right away and minimum wastage of water is detected. Future
research on smart water grid could benefit both the public and utility by putting up dynamic pricing based on the amount of consumption. In future a better and sustainable method to conserve and manage water resources properly could be made efficient through these various methods.
REFERENCES
1. [Online]Available at:
https://www.usgs.gov/special-topic/water-science-school/science/how-m uch-water-there-earth?qt-science_center_objects=0#qt-science_center_o bjects
2. Water Conservation Management [online] Available at:
https://www.watconman.org/introduction/
3. Mohammed Shahanas.K, Dr.Bagavathi Sivakumar P, “Framework for a
smart water management system in the context of smart city initiatives in India”, 2nd International Conference on Intelligent Computing, Communication & Convergence, 2016.
4. Singapore Water Story [Online] Available at:
https://www.pub.gov.sg/watersupply/singaporewaterstory
5. William J. Cosgrove, Daniel P. Loucks “Water Management current and
future challenges research directions”AGU Journals, Published in 20 June 2015.
6. Michele Mutchek, Eric Williams, “Moving Towards Sustainable and
Resilient Smart Water Grids”, challenges ISSN 2078-1547 www.mdpi.com/journal/challenges, 21 March 2014.
7. Eduardo Nogueira Cunha, Carlos Eduardo Trabuco Dórea, “Modeling,
simulation and control of water supply system” IEEE First International Smart Cities Conference (ISC2), 28 December 2015.
8. Ali M. Sadeghioon, Nicole Metje, David N. Chapman and Carl J. Anthony,
“Smart Pipes: Smart Wireless Sensor Networks for Leak Detection in Water Pipelines”, Journal of Sensor and Actuator Networks, 20 February 2014.
9. Albert Rosich, Fatiha Nejjari, “Optimal Sensor Placement for Leakage Detection and Isolation in Water Distribution Networks”, 8th IFAC Symposium on Fault Detection, Supervision and Safety of Technical Process, August 2012.
10. M Saravanan, Arindam Das, Vishakh Iyer, “Smart Water Grid
Management using LPWAN IoT Technology”, 2017 Global Internet of Things Summit (GIoTS), Geneva, 2017, pp. 1-6.
11. Allen, Michael, Ami Preis, Mudasser Iqbal and Andrew J. Whittle. “Case
Study: a Smart Water Grid in Singapore.” Water Practice & Technology 7, no. 4 (November 26, 2012): 1–8.
12. Seung Won Lee, Sarper Sarp, Dong Jin Jeon, Joon Ha Kim “Smart water
grid: the future water management platform” in Desalination and water treatment 55(2) • May 2014
13. M. Romano, Z. Kapelan, D. Savic “Automated detection of pipe bursts and
other events in water distribution systems” Journal of Water Resources Planning and Management,2014
14. Sreekanth Narendran, Preeja Pradeep, Maneesha Vinodini Ramesh, “An
Internet Of things (IOT) based sustainable water management” 2017 IEEE Global Humanitarian Technology Conference (GHTC), October 2017
AUTHORSPROFILE
Shruthi Venkat, Department of Electrical and Electronics Engineering, Amrita School of Engineering, Coimbatore, Amrita Vishwa Vidyapeetham, India..