---126 0
Gender Prediction of Indian and Hungarian
Students Towards ICT and Mobile Technology for
the Real-Time
Chaman Verma, Zoltán Illés, Veronika Stoffová
ABSTRACT: The present paper focused on the prediction of the university student's gender towards Information Communication Technology (ICT) and Mobile Technology (MT) in Indian and Hungary.In this paper, four experiments
were performed on dataset using three popular
classifiersnamed Support Vector Machine (SVM), Artificial Neural Network (ANN) and Random Forest (RF) with three numerous testing technique such as K-fold Cross Validation (KCV), Hold Out (HO) and Leave One Out (LOO).Three different applications named Explorer, Experimenter and KnowledgeFlow (KF) of Weka 3.9.1 are used for predictive modeling. The class balancing has been also applied using Synthetic Minority Over-Sampling (SMOTE) to enhance the prediction accuracy of each algorithm. Further, a significant difference among classifier’s accuracies has also been tested using T-test at the 0.05 confidence level. Also, CPU user time has been calculated to train each model to justify to present real-time prediction of gender towards ICT and MT.The results of the study inferred that the CPU time is significantly differed in between RF (0.18 Seconds), SVM (0.06 seconds) and ANN (4.40 seconds).Also, the RF classifier (89.4%) outperformed others with LOO method in terms of accuracy.The authors recommended these predictive models to be deployed as an online prediction for the gender of the student towards ICT and MT at both universities to track technological activities.
Keywords: Gender Prediction, Machine Learning, LOO, Prediction Accuracy, HO, KCDV, SMOTE.
I. INTRODUCTION AND RELATED WORK
To predict data pattern in educational datasets, traditionally statistical analysis was the most trending. Many investigators applied statistical techniques to predict data patterns and significant differences among variables towards ICT [1], [2], [3], [4], [5]. Now a day, Educational Data Mining (EDM) is now trending in higher educational institutions to predict data patterns accordingly. EDM is the process of analyzing hidden educational patterns of data according to different perspectives for categorization into useful information,
Revised Manuscript Received on July 25, 2019.
Chaman Verma, Zoltán Illés, Veronika Stoffová,
Faculty of Informatics,EötvösLoránd
University,Budapest,Hungary.
Faculty of Education,TrnavaUniiversity,Trnava, Slovakia.
(Corresponding author: Chaman Verma)
(Received 09July 2019, Revised 30 July 2019, Accepted 15 August 2019) (Published by Research Trend, Website: www.researchtrend.net)
which is collected and assembled in common areas, such as data warehouses, for efficient analysis,T dataT miningT algorithms,T facilitatingT businessT decisionT makingT andT otherT informationT requirementsT toT ultimatelyT cutT costsT andT increaseT revenue.PredictiveT modelingT inT theT educationalT domainT isT nowT beingT popular.T UsingT machineT learning,T identifyT theT dataT patternsT andT classificationT isT important.T SupervisedT learningT isT theT machineT learningT taskT ofT learningT aT functionT thatT mapsT anT inputT toT anT outputT basedT onT exampleT input-outputT pairs.T TheT supervisedT machineT learningT algorithmsT areT appropriateT forT predictiveT modeling.T ManyT researchersT haveT appliedT machineT learningT classifiersT onT educationalT datasets.T TheT attitudeT andT awarenessT levelT ofT studentsT towardsT ICTT andT MTT wereT predictedT [6]T [7].T Further,T theT demographicT featuresT ofT studentsT wereT alsoT predictedT usingT machineT learningT classifiersT suchT asT locality,T residenceT countryT [8]T andT stateT ofT residenceT [9].T TheT genderT ofT EuropeanT school’sT studentsT andT teachersT wereT predictedT withT bestT accuracyT [10],T [11],[12].T InT theT real-timeT predictionT ofT theT ageT groupT ofT universityT students,T machineT learningT playsT aT significantT roleT [13].Also,T theT nationalT identityT ofT studentsT [14]T andT student’sT localityT basedT onT genderT andT countryT [15]T wereT alsoT predictedT withT theT helpT ofT supervisedT machineT learningT algorithms.T TheT conceptT ofT real-timeT predictionT ofT developmentT andT availabilityT ofT ICTT andT MTT atT universityT wereT suggestedT [16].T Also,T aT smartT approachT toT automatedT genderT predictionT inT realT timeT isT alsoT providedT [17]
InT thisT paper,T theT authorsT modeledT threeT machineT learningT algorithmsT suchT asT RandomT ForestT (RF),T SupportT VectorT MachineT (SVM)T andT ArtificialT NeuralT NetworkT (ANN)T withT theT primaryT dataset.RFT isT anT ensembleT learningT methodologyT whichT isT aT collectionT ofT ClassificationT andT RegressionT TreesT (CART)T likeT treesT forT growing,T combination,T testingT andT Post-processing.T RFT isT growingT whileT trainingT onT aT sampleT obtainedT fromT theT trainingT setT viaT baggingT withoutT replacementT [18].T RandomT forestsT areT aT combinationT ofT treeT predictorsT suchT thatT eachT treeT dependsT onT theT valuesT ofT aT randomT vectorT sampledT independentlyT andT withT theT sameT distributionT forT allT treesT inT theT forestT [19].SupportT VectorT MachineT (SVM)T isT aT supervisedT learningT modelT introducedT forT binaryT classificationT inT bothT linearT andT nonlinearT versionsT [20].T AnT SVMT performsT classificationT byT constructingT anT N-dimensionalT hyperplaneT thatT optimallyT separatesT theT dataT intoT twoT categoriesT [21],T [22],T [23].ArtificialT neuralT networkT (ANN)T isT simpleT mathematicalT modelsT definingT aT functionT f:T X→YT orT distributionT overT XT or both X and Y, but sometimes models are also intimately associated with a learning algorithm or learning rule [24], [25].
---126 1
Indian university and Hungarian university. From
[image:2.595.55.284.152.304.2]Hungary, a total of 169 students from EötvösLoránd University has participated in this research study and the total 162 students belong to the Chandigarh University of India. The imbalance count of gender has been found during a survey held in the academic year 2017-2018. The total male students were 265 and the total 66 female students have participated in it.
Fig. 1: Student participation
[image:2.595.302.555.231.419.2]Before the classification of the dataset, it needs to be preprocessed dataset. Only 6 missing values are handled with RepalceMissingValue filter which replaces all missing values for nominal and numeric attributes in a dataset with the modes and means from the training data. The Normalizefilter is used to normalizesall numeric values in the given dataset apart from the class attribute which is gender. The default scale of normalization [0,1] is selected for the data uniformity. Gender has been marked as a class variable which has two values Male-01 and Female-02. The authors performed a binary class balancing operation. Hence, SMOTE algorithm which resamples a dataset by applying the Synthetic Minority Over-sampling Technique. The original dataset must fit entirely in memory. The amount of SMOTE and the number of nearest neighbors may be specified. Fig. 2 shows that initial unbalanced dataset has 66 female and 265 male students who need to be balanced for significant classification. At first run of SMOTE instances belong to a female class are enhanced by 132 and the second run of SMOTE the gender class gets significantly balanced. Now we have a total of 529 instances to be trained and tested for the prediction.
Fig. 2: Gender Class Balancing
II.EXPERIMENTS AND RESULTS
A. Experiment-1
In this experiment, the authors performed HO testing methods in which is the simplest form of k-fold cross-validation. This method randomly assigns data points to two sets named training set and the test set, respectively. If we let kbe some integer less than (or equal to) nwhere nis the sample size and we partition the sample into kunique subsamples, and in HO validation is really just 2-fold (k = 2) cross-validation.The training set is what the model is trained on, and the test set is used to see how well that model performs on unseen data.We used various training ratio such as 50:50, 60:40 and 70:30. (see in Fig. 3)
Fig. 3: Prediction Accuracy using HO Method
It can be seen from Fig. 3 that the maximum prediction accuracy (86.79%) is achieved by RF at training ratio 70:30 and worst prediction accuracy (62.87%) is provided by SVM at ratio 50:50. The prediction accuracies of RF and SVM are directly proportional to the training ratio. It is revealed that using HO method the RF classifier outperformed others.
B. Experiment-2
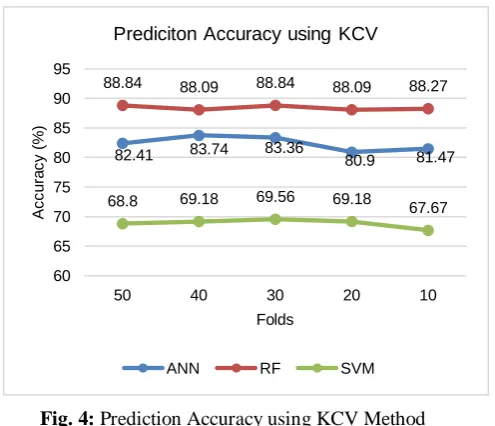
ThisT experimentshowsT thatT KCVT testingT methodsT theT originalT datasetT isT randomlyT partitionedT intoT kT equal-sizedT subsetsT andT aT singleT subsetT isT retainedT asT theT validationT dataT forT testingT theT model,T andT theT remainingT k−1T subsetsT areT usedT asT trainingT data.T TheT cross-validationT processT isT thenT repeatedT kT timesT (theT folds),T withT eachT ofT theT kT subsetsT usedT exactlyT onceT asT theT validationT data.Fig.T 4T showsT thatT theT dynamicT foldsT ofT KCVT testing.T ItT canT beT seenT thatT atT k=40,T KCVT enhancedT theT predictionT accuracyT ofT ANNT classifierT byT 0.10T andT atT k=T 50T andT k=30T theT predictionT accuracyT ofT RFT isT alsoT improvedT byT 2.05%.T
162 169
265
66
0 50 100 150 200 250 300
Indian Hungary Male Female
C
o
u
n
t
Demography
Initial Participants
0 100 200 300
Unbalanced Smote-1 Smote-2
[VALUE] [VALUE] [VALUE]
[VALUE] [VALUE]
[VALUE]
Instances
C
la
s
s
Class Balancing
Female
Male
77.2
75
83.64
84.84 84.9 86.79
62.87
68.4 68.6
60 65 70 75 80 85 90
50-50 60-40 70-30
Ac
c
u
ra
c
y
(%
)
Traning Ratio
Prediciton Accuracy using HO
[image:2.595.58.281.594.789.2][image:3.595.45.293.47.260.2]
---126 2
Fig. 4: Prediction Accuracy using KCV Method
C. Experiment-3
[image:3.595.50.274.467.626.2]In thisexperiment LOO testing method is applied with k=529 which is an enhanced version of KCV. In this, the value of k is equal to n where n is the sample size. Likewise, KCV method, LOO also splits randomly dataset but the splitting size is k=n equal-sized subsets and a single subset is retained as the validation data for testing the model, and the remaining k−1 subsets are used as training data. Fig. 5 shows that the at the static value of k=529, One hand the prediction accuracy of ANN classifier is reduced by 1.7% and another hand RF’s accuracy is improved by 0.57% and SVM’s accuracy is also enhanced by 0.94% as compared to other testing methods. Hence, LOO testing proved most significant for RF and SVM classifier as compared to the ANN classifier.
Fig. 5: Prediction Accuracy using LOO Method
D. Experiment-4
In this experiment, the statistical t-test is applied at 0.05 significant level to compare the CPU training time modeled by each classifier. For this Weka experimental environment application is used with the KCV testing method and the value of k is set to 30 and the number of iterations are set to 5. The type of the experiment is considered as classification. Fig. 5 shows the joint results obtained provided by T-test at the 0.05 confidence level.
Fig. 6: Accuracy Vs. CPU Time Training comparing using
T-test.
The symbol (*) shows a statistically significant difference among classifiers. It can be seen that T-test signifies the statistical difference between the CPU time for training ANN (function) model and SVM (func). Also, the same significant difference is found between the CPU time taken by ANN (function) and RF (tree). It is also revealed that ANN induced maximum time (4.40 seconds) as compare to others to train the gender predictive model. One hand, the T-test also found a significant difference between the accuracy of ANN's and SVM and another no significant difference is found between the accuracy of ANN and RF classifier.Accordingly, RF classifier has achieved the highest accuracy as compared to others to predict the gender of both countries.
III. PERFORMANCE MEASURES
[image:3.595.306.565.558.740.2]This section describes the experimental results with important performances measures considering binary classification. Table1 presents the seven major performance measures for each algorithm using LOO testing method with k=529. It can be seen that the RF algorithm outperformed others with prediction accuracy and it attained the lowest error rate. The excellent association of instances to predict the gender of the student is scored by RF which is kappa static having value 0.78.The average sensitivity or True Positive Rate (TPR) of male and female is calculated 0.90 by RF which is significant in gender prediction. The False Positive Rate (FPR) [9] is found very less which is 0.10 of RF. Hence, Receiver Operating characteristic area [10] of RF classifier is bigger than other classifiers which signifies the strength of gender predictive model.
Table 1: Prediction Measures.
Measures Classifier RF ANN SVM
Accuracy 89.4 82.04 70.5
Error 10.6 17.96 29.5
Kappa 0.78 0.64 0.41
TPR 0.90 0.82 0.70
FPR 0.10 0.30 0.30
ROC 0.94 0.87 0.71
F-score 0.89 0.82 0.70
As we know, the F-score is a harmonic mean of precision and recall which also states the
significance of predictive models and it is found 0.89 which is also meaningful for
82.41 83.74 83.36 80.9 81.47
88.84 88.09 88.84 88.09 88.27
68.8 69.18 69.56 69.18
67.67
60 65 70 75 80 85 90 95
50 40 30 20 10
Ac
c
u
ra
c
y
(%
)
Folds
Prediciton Accuracy using KCV
ANN RF SVM
82.04
89.41
70.5
60 65 70 75 80 85 90 95
ANN RF SVM
Ac
c
u
ra
c
y
(%
)
k=529
---126 3
[image:4.595.321.550.51.231.2]the prediction.
Fig. 6: Prediction Count using LOO Method with k=529.
[image:4.595.46.284.66.246.2]Data from Fig. 6 infers that the out of total 529, the cumulative (male and female) maximum accurate prediction count 473 is achieved by RF classifier and lowest accurate count is given by SVM classifier. Hence, it is concluded that LOO testing methods significantly boosted the prediction count as compared to others.
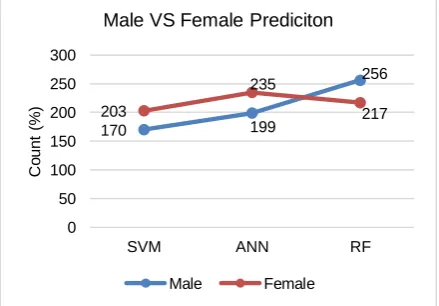
Fig. 7: Accurate gender wise Prediction Count using
LOO Method with k=529.
Data from Fig. 7 shows that the maximum right male count of prediction is 256 and the accurate female student count is 217 calculated by RF. The SVM classifier performed insignificant in the prediction of gender ascompared to others.
IV. VALIDATION
To validate each model, Total 8 componentsof KF are used. TheCSVLoader is used to load the balanced dataset in a Comma Separated File (CSV). The ClassAssigner is used to set a target variable named the gender as a class variable.First time male class is picked using the ClassValuePickerand second time female class.The CrossvalidationFoldMaker is used to select LOO
method with set
[image:4.595.52.272.352.505.2]k=529.TheModelPerfromanceChartareusedtoprintthe cumulative ROCcurve.
Fig. 8: ROC of gender predictive model.
Data from Fig. 8shows the cumulative ROC curve for each class separately produced using KFE for validating the predictive model which compared the sensitivity with 1-specificity of the real-time model at various thresholds for the student's gender prediction. The ROC shows the sensitivity with 1-specificity for both classes male and female at varying cutoffs and compared each classifier on the dataset.It can have been seen from ROC that RF model is sensing from 0.80 and ends to 0.99 with updating thresholds. Also, can be seen at thresholds 0.5 the sensitivity is high 0.99 and the FP rate is 0.01 which reveals the significance of the real-time genderprediction. Hence, the RF model outperformed others in gender prediction towards ICT and MT.
V. CONCLUSIONS AND FUTURE SCOPE
In this present study, predictive modeling of the gender of Indian and Hungarian students has been performed with three machine learning classifiers (RF, ANN, and SVM) on the primary dataset. In addition to class balancing, this dataset is trained and tested using three different testing methods to enhance the prediction accuracy of each classifier. It is concluded thatusing LOO method accuracy of each classifier are improved. Also, in the prediction of gender, RF classifier outperformed others.The results of the study also proved that there is a significant difference between RF, SVM, and ANN classifier. The authors recommended these predictive models to be deployed as an online prediction for the gender of a student towards ICT and MT at both universities to track technological activities. Further, T-test also found a major difference between the accuracy of ANN’s and SVM.
The future work is suggested to apply feature filtering with RGBoost and Deep learning models to boost the prediction accuracy of the RF model. Further, the authors also recommended applying ensemble learning such as bagging, adaptive boosting, and stacking with SVM, RF and ANN classifier to make the predictive model more reliable and accurate. Future, researchers can deploy this predictive model on any other type of survey in any field to identify gender. Also, ICT coordinator of target university may implement this model to track the academic activities of students towards technology. For this, they may develop the real-time web site with a specified deadline of the time to predict the student’ gender.
473
434
373
56
95
156
0 50 100 150 200 250 300 350 400 450 500
RF ANN SVM
C
o
u
n
t
Predicition Count
Accurate Prediction Inaccurate Prediction
170 199
256
203
235
217
0 50 100 150 200 250 300
SVM ANN RF
C
o
u
n
t
(%
)
Male VS Female Prediciton
---126 4
ACKNOWLEDGMENT
The first author thanks Tempus Public foundation of Hungary to sponsoring his Ph.D. study related to this research work. Also, this paper is sponsored by the Hungarian Government and Co-financed by the European Social Fund under the project “Talent Management in Autonomous Vehicle Control Technologies (EFOP-3.6.3-VEKOP-16-2017-00001)”.
REFERENCES
[1]. Chaman Verma and Sanjay Dahiya (2016). Gender
difference towards information and communication
technology awareness in Indian universities. SpringerPlus,
5:1–7.
[2]. Chaman Verma, SanjayT DahiyaT andT DeepakT MehtaT
(2016).T AnT analyticalT approachT toT investigateT stateT
diversityT towardsT ICT:T AT studyT ofT sixT universitiesT ofT
PunjabT andT Haryana.T IndianT JournalT ofT ScienceT andT
Technology,9T (31):T 1–5.
[3]. ChamanT Verma,T VeronikaStoffováT andT ZoltánIllésT
(2018).T PerceptionT differenceT ofT IndianT studentsT towardsT
informationT andT communicationT technologyT inT contextT
ofT universityT affiliation.T AsianT JournalT ofT ContemporaryT Education,T 2T (1):T 36-42.
[4]. ChamanT VermaT (2017).T EducationalT dataT miningT toT
examineT mindsetT ofT educatorsT towardsT ICTT knowledge.T
Int.T J.T DataT Min.T Emerg.T Technol.,7T (1):T 53-60.
[5]. ChamanT Verma,T VeronikaStoffováT andT ZoltánIllésT
(2018).T AnalysisT ofT SituationT ofT IntegratingT InformationT
andT CommunicationT TechnologyT inT IndianT HigherT
Education.T InternationalT JournalT ofT InformationT andT
CommunicationT TechnologiesT inT Education,T 7T (1):T 24-29.
[6]. ChamanT VermaT andT ZoltánIllésT (2019).T AttitudeT
PredictionT TowardsT ICTT andT MobileT TechnologyT forT
TheT Real-Time:T AnT ExperimentalT StudyT UsingT MachineT
Learning.T In:T ProceedingsT ofT TheT 15thT InternationalT
ScientificT ConferenceT eLearningT andT SoftwareT forT
Education,T 3,T pp.T 247–254.
[7]. ChamanT Verma,T VeronikaStoffováT andT ZoltánIllésT
(2019).T PredictionT ofT students’T awarenessT levelT towardsT
ICTT andT mobileT technologyT inT IndianT andT HungarianT
UniversityT forT theT real-time:T preliminaryT results.T
Heliyon,T Elsevier,T 5T (6):T 1-9.
[8]. ChamanT Verma,T VeronikaStoffováT andT ZoltánIllésT
(2019).T PredictionT ofT ResidenceT CountryT ofT StudentT
towardsT Information,T CommunicationT andT MobileT
TechnologyT forT Real-Time:T PreliminaryT Results.T
ProcediaT ComputerT Science,T ElsevierT :1-11.
[9]. ChamanT Verma,T AhmadT S.T Trananweh,T
VeronikaStoffováT andT Zoltán.T IllésT (2018).T ForecastingT
residenceT stateT ofT IndianT studentT basedT onT responsesT
towardsT informationT andT communicationT technologyT
awareness:T AT primarilyT outcomesT usingT machineT
learning.T In:T ProceedingsT ofT IEEET InternationalT
ConferenceT onT InnovationsT inT Engineering,T TechnologyT
andT Sciences,T InT Press.
[10]. ChamanT Verma,T AhmadT S.T Trananweh,T
VeronikaStoffová,T Zoltán.T IllésT andT SanjayT DahiyaT
(2018).T GenderT predictionT ofT theT EuropeanT school’sT
teachersT usingT machineT learning:T PreliminaryT results.T In:T
ProceedingsT ofT IEEET InternationalT AdvanceT ComputingT
Conference,T pp.T 213–220.
[11]. ChamanT Verma,T VeronikaStoffová,T ZoltánIllésT (2018).T
AnT ensembleT approachT toT identifyingT theT studentT
genderT towardsT informationT andT communicationT
technologyT awarenessT inT europeanT schoolsT usingT
machineT learning.T InternationalT JournalT ofT EngineeringT andT
Technology,T 7T (4):T 3392–3396.
[12]. ChamanT Verma,T VeronikaStoffová,T ZoltánIllésT andT SanjayT
DahiyaT (2018).T BinaryT logisticT regressionT classifyingT theT genderT ofT studentT towardsT ComputerT LearningT inT EuropeanT schools.T In:T
ProceedingsT ofT THET 11thT ConferenceT ofT Ph.DT studentsT inT
computerT science,T pp.T 45.T SzegedT University,T 2018.
[13]. ChamanT Verma,T VeronikaStoffová,T ZoltánIllésT (2019).T AgeT
groupT predictiveT modelsT forT theT realT timeT predictionT ofT theT universityT studentsT usingT machineT learning:T PreliminaryT results.T
In:T ProceedingsT ofT IEEET InternationalT ConferenceT onT Electrical,T
ComputerT andT Communication,T InT Press.
[14]. ChamanT Verma,T AhmadT S.T Trananweh,T VeronikaStoffová,T
Zoltán.T IllésT andT MandeepT SinghT (2019).T NationalT identityT
predictiveT modelsT forT theT realT timeT predictionT ofT EuropeanT
schoolsT students:T preliminaryT results.T In:T ProceedingsT ofT IEEET
InternationalT ConferenceT onT Automation,T ComputationalT andT
TechnologyT Management,T UK.T InT Press.
[15]. ChamanT Verma,T VeronikaStoffová,T ZoltánIllésT (2019).T PredictionT
ofT LocalityT StatusT ofT theT studentT basedT onT genderT andT countryT
towardsT ICTT andT MobileT TechnologyT forT theT realT time.T In:T
ProceedingsT ofT XXXII-DIDMATTECH,T Slovakia,T InT Press.
[16]. ChamanT Verma,T ZoltánIllés,T VeronikaStoffováT (2019).T Real-timeT
predictionT ofT developmentT andT availabilityT ofT ICTT andT MobileT
TechnologyT inT IndianT andT HungarianT University.T In:T
ProceedingsT ofT InternationalConferenceT onT RecentT InnovationsT inT Computing,T Springer,T InT Press.
[17]. YatishBathla,T ChamanT VermaT andT NeerendraT Kumar,T “SmartT
ApproachT forT RealT TimeT GenderT PredictionT ofT EuropeanT
School'sT PrincipalT UsingT MachineT Learning,”T In:T ProceedingsT ofT
InternationalT ConferenceT onT RecentT InnovationsT inT Computing,T
Springer,T InT Press.
[18]. G.PriyaT andT N.VenkatesanT (2015).T AT studyT ofT randomT forestT
algorithmT withT implementationT usingT weka.T InternationalT JournalT
ofT InnovativeT ResearchT inT ComputerT ScienceT andT
Engineering,1(6):T 156-162.T
[19]. SushilkumarT RameshT pantT KalmeghT (2015).T ComparativeT
analysisT ofT wekaT dataT miningT algorithmT randomT forest,T randomT
treeT andT ladT treeT forT classificationT ofT indigenousT newsT data.T
InternationalT JournalT ofT EmergingT TechnologyT andT AdvancedT
Engineering,T 5(1):T 507-517.
[20]. Chih-WeiT Hsu,T Chih-ChungT ChangT andT Chih-JenT LinT (2003).T AT
practicalT guideT toT supportT vectorT classification.T
[21]. Ali.ST (2005).T AutomatedT SupportT VectorT LearningT Algorithms.T
PhDT dissertation,T MonashT University,T Australia.T
[22]. ChristopherT JCT BurgesT (1998).T AT tutorialT onT supportT vectorT
machinesT forT patternT recognition.T DataT miningT andT knowledgeT
discovery,T 2T (2):T 121-167.T
[23]. RueyT LongT Cheu,T DiptiT Srinivasan,T andT EngT TianT TheT (2003).T
SupportT vectorT machineT modelsT forT freewayT incidentT detection.T
In:T ProceedingsT ofT IEEET IntelligentT TransportationT Systems,T vol.T 1,T pp.T 238-243.T
[24]. MarvinT MinskyT andT SeymourT APapertT (2017).T Perceptrons:T AnT
introductionT toT computational geometry. MIT press, 2017.