International Journal of Innovative Technology and Exploring Engineering (IJITEE) ISSN: 2278-3075, Volume-8 Issue-9, July 2019
Abstract: Automatic detection of blocks in the angiographic images is a challenging task. The features such as contrast and gradient of the vessels and the background image are playing a vital role in the detection of the blocks in the X-Ray angiograms. Nowadays, doctors manually identify blocks in the coronary vessels. The automation tool is necessary to identify the blocks in the blood vessels of the heart to help the doctors in the diagnosing process. Spatiotemporal nature of the angiography sequences is used to isolate the coronary artery tree. The coronary artery segment is tracked and in each image frame by frame and the arterial width surface is detected. The stenosis identification is done by using coronary vessel surface’s persistent minima and blob analysis. The proposed method is experimented on 42 patients’ dataset. The performance of the proposed method was evaluated by comparing the blocks identified by the algorithm with the hand-labelled ground truth images given by the experts. The proposed method provides an accuracy of 95.5% on 42 patients with a total of 60 image runs.
Index Terms: angiography, blob analysis, coronary vessel, stenosis.
I. INTRODUCTION
X-ray angiography helps to find out the presence of blocks in blood vessels of the coronary arteries. The blockages are often called as stenosis. It is nothing but the narrowing of vessels in various positions of the artery. It is difficult for the doctors to diagnose the blocks in the vessels due to the properties of the image like nonuniform intensity distribution. If more dye is injected into the vessels then the clarity will be more, but it causes serious side effects to the patients. The portion is detected as stenosis if block remains in all the frames of the image sequence through time. sAll images in the image sequence are filtered to visualize the coronary vessels properly and the coronary arteries are aligned with filtered images with the help of reference frame. For the image sequence the mean filtered image is created by warping the individual images into the reference image and coronary vessels are separately identified and merged back to the original image space. At last surface for coronary vessel is formed from each distinct vessel segment. The stenosis is found with the help of persistent minima of this surface. The doctor’s diagnosis report and the stenosis algorithm identification algorithm are compared for the entire sequence of images.
Revised Manuscript Received on July 09, 2019
Sambath M, Assistant Professor, Department of CSE, Hindustan Institute of Technology and Science, Chennai, TamilNadu, INDIA
Dr. D. John aravindhar, Professor, Department of CSE, Hindustan Institute of Technology and Science, Chennai, TamilNadu, INDIA
Dr. Pradeep G Nayar, Director-Cardiology, Chettinad Healthcity, Chennai, TamilNadu, INDIA
Identification and quantification of stenosis is the most important task in X-ray angiography. Evaluating the degree of stenosis is imperative for doctors to decide the seriousness of a stenosis. There are numerous procedures for measuring the degree of stenosis but nothing is fully automated. Extra work has concentrated on division techniques for separating the vessels in X-ray angiography. These strategies again require some manual selection of a seed point to construct the coronary artery tree. After segmentation there are numerous techniques for coronary tree extraction from images. The other techniques for stenosis detection utilizes 3D CT angiography information. The 2D X-ray angiograms can’t employ these techniques directly.
The main objective of this paper is to identify the blocks in the vessels using the blob analysis and the persistent minima of the coronary artery surface. The blob analysis is done based on the similarity of blob objects to the blood vessels. This is done on an image sequences. It gives a clear indication of stenosis than regular single frame analysis method. Algorithm for coronary tree identification is presented by using the blob analysis and spatio-temporal analysis. This is the main end-to-end framework for stenosis detection in coronary vessels of X-ray angiography.
II. LITERATURE SURVEY
[1] Nayana mohan et. al., proposed stenosis detection method which involves diffusion filter for image enhancement and morphological operation for filtration in the coronary vessels. It gives an accuracy of 86.67% in the detection of coronary stenosis. [2] Y. Chi et. al., employed a panoramic maximum intensity projection (MIP) technique to for the detection of stenosis in CT angiography. It helps the radiologist in locating exact position of abnormalities in coronary vessels in practice. It provides an accuracy of 89%. [3]Franz von Ziegler et al developed cardiac MDCTA (multidetector computed tomography angiography) technique for the detection and quantification of stenosis in CT angiogaphy. This technique employs a segment based analysis and it provides an accuracy of 93.7% .[4] Jongin Park et al., invented a method which uses ultrasonic technique based on the principle of coronary Doppler vibrometry (CDV). The stenosis is detected by passing the ultrasonic waves. The vibrations in the coronary vessel walls indicate the stenosed portions of the vessels. The limitation of this method is the long examination time. [5] Colin B. Compas et. al., exploit the spatiotemporal nature of the X-ray angiography images for creation of coronary vessel tree from the angiogram. This method gives 86% of sensitivity and 97% of specificity. This is far better than36% of sensitivity and 82% of specificity obtained in case of single frame method.[6] J.
Stenosis Detection Algorithm for Coronary
Angiograms
Stenosis Detection Algorithm for Coronary Angiograms
Matthias Kerl et. al., compared conventional X-ray angiography and CT angiography in the process of stenosis detection. The interpretation of stenosis in both cases are not different.[7] P. Mirunalini et.al., proposed a method for stenosis detection by taking the 2D images obtained from CTA. The various techniques like image smoothing, vessel enhancement, localized threshold and connected components were used in this method. This method gives 97% of recall measure. [8] Wei-Hua Yin et.al., used ECG-triggered high-pitch spiral CT acquisition technique to evaluate the diagnostic accuracy of submilliSievert (mSv) coronary CT angiography (cCTA). It is combined with iterative image reconstruction. It gives sensitivity of 95.7% and specificity of 94.1%. [9] Katharina Anders et al., proposed a CT angiography based stenosis detection in coronary vessels using automation tool. It produces sensitivity and specificity of 89% and 79%. Also it gives 74 % and 92% of positive predictive value and negative predictive value. [10] Abolfazl khedmati et al., detected and evaluated using patient based analysis and segment based analysis. In patient based analysis, positive predictive value(PPV) of 88.89% and sensitivity of 88.89% is achieved and in segment based analysis PPV of 34.27% and sensitivity of 44.2% are obtained. [11] Ankur Sharma et al., detected blocks in the coronary vessels with the help of fuzzy system and gradient feature of image. The fuzzy system is used for segmentation of vessels and gradient of the image is used for the stenosis detection.
III. CORONARY TREE EXTRACTION
This work focuses on the construction of coronary artery tree followed by blob analysis for the stenosis detection. Coronary artery tree extraction is done by employing several steps in image processing including adaptive thresholding, and skeletonization to detect blood vessel intersections. Gradient shifting [12]was utilized because of its capacity to feature coronary corridors, counting minor fragments, while suppressing noise. Test pictures for each preparing venture can be extracted. The past examination, be that as it may, was connected to a solitary picture of a grouping called the key casing. Depending on a single casing can be dangerous for stenosis discovery since the course tree may seem divided or the stenosis may not be evident. Moreover, if the stenosis is serious the edge picture frequently indicates holes that are hard to connect during skeletonization.
A.Vessel Extraction using Mean Image
All images in the image sequence are aligned to calculate the mean vessel image. This image is used for extracting arteries from individual images. Optical flow method is used to integrate spatio-temporal information using the technique of inter-frame motion[13]. The flow field is computed between consecutive frames. The mean vessel image is calculated by aligning the images. Displacement is computed with respect to the reference image rather than tracking frame by frame. Key frame is chosen as reference image. multiscale optical flow method is used to record large motions between frames. A gradient image has the ability to distinguish the vessels properly. Optical flow tracking was performed on these images rather than gray level images. Because of the consistency in image intensities for homogenous images in shape, the optical flow constraint remains. The extracted vessels are again warped back into the original image using
the offset for alignment. The output obtained in this case is better than the single frame analysis method.
B.Extracting the coronary vessel tree
To extract the vessels from the x-ray angiographic images the boundary pixels on both sides of the vessels are considered in the direction normal to the each point along the vessels. Each coronary artery Ci is represented by a set of points
{x,y,a1,a2, } where (x,y) belongs to Si is a vessel pixel on the
vessel artery passing through the vessel segment. a1 and a2 are
the units along the surface normal theta to the vessel boundary point. The width of the artery segments is given by wi= a2i - a1i .This is calculated as the distance between the
intersection of normal to the surface and the centerpoint in the artery.
IV. STENOSIS DETECTION
For the coronary segment at time t the stenosis is represented by sampling the points (x,y,t) along the vessel and width is calculated by w(s) at such point. By having this knowledge about the stenosis point the next point is found as (x’,y’,t’) at time t’. The width values along the vessels are calculated for each frame in the in the X-ray angiogram. The gradient of an image is calculated at any point in an image is given by
where m is the ratio of change in the y direction to change in x direction.
ALGORITHM – Stenosis detection
i. Read the input x-ray angiogram in the form of Dicom image D
ii. Extract the image sequences D1,D2,... Dn from D iii. Find out the key frames in the image sequence. iv. Find out the mean image for each image sequence.
v. Pass the Mean image I to the stenosis algorithm Steno(I)
Steno(I)
a. Read the mean image I
b. Apply blob analysis on the image to detect the thickness of the vessels in each point
c. The surface function for blob is
where
and parameter T is specified threshold. d. Calculate the width of the vessel at each point. e. Gradient of the vessel portion is calculated. f. Based on the gradient and vessel thickness the
point on the vessel is marked as stenosis g. Divide the image into equal portions having
32x32 pixels
h. Calculate the slope for each portion of the image
i. If slope m<=1 measure the vessel thickness by calculating the pixels in the vessel horizontally. j. if slope m>1 measure the vessel thickness by
International Journal of Innovative Technology and Exploring Engineering (IJITEE) ISSN: 2278-3075, Volume-8 Issue-9, July 2019
k. If the thickness in the successive lines gradually decreases or increases then there is no stenosis. l. If the vessel thickness drops suddenly in the consecutive line then that is marked as stenosis.
A. Segmented images
[image:3.595.355.537.47.415.2]The segmented images of 42 patients are given as input to the algorithm. The coronary tree extracted from the x-ray angiograms are given in in Fig 1. It acts as input to the algorithm.
Fig 1 Coronary tree extracted from x-ray angiograms B. Image division
The algorithm is executed on the images by dividing into different number of blocks. There are three sizes in which the image is splitted into blocks such as 64x64 pixels, 32x32 pixels and 16x16 pixels block. The image into 64 equal portions of pixels block as shown in Fig 2.
Img = im2double(Img); [m,n] = size(Img); Blocks = cell(m/64,n/64); counti = 0;
for i = 1:64:m-63 counti = counti + 1; countj = 0;
for j = 1:64:n-63 countj = countj + 1;
Blocks{counti,countj} = Img(i:i+63,j:j+63); end
end
Fig 2. Dividing the image into 64x64 pixels block Slope calculation
To calculate the thickness of the vessels the vessel direction has to be identified like whether the vessel flows in horizontal or vertical or diagonally. To identify the vessel direction the slope of the vessel line has to be calculated. The detailed vessel potions are given in fig 3. There are 3 cases of vessel directions as given. The vessels flowing in horizontal, vertical or diagonal direction are approximated by a straight line in fig 4 to facilitate the calculation of slope.
The slope is calculated by the formulae
[image:3.595.48.266.174.377.2]Stenosis Detection Algorithm for Coronary Angiograms
Fig 3 Detailed vessel portions
Fig 4. Approximation of vessels by a straight line C. Vessel thickness measurement
The slope measured in the previous step is used for the calculation of vessel thickness.
Case i : If slope m<=1 calculate the vessel thickness by counting the pixels in the vessel region horizontally.
Case ii : if slope m >1 calculate the vessel thickness by counting the pixels in the vessel region vertically.
Step 1. vesthick=0;
Step 2. while (image[i]==1) 2.1 vesthick=vesthick+1;
Step 3. Repeat step 2 for each line in the vessel portion and store it in a separate array
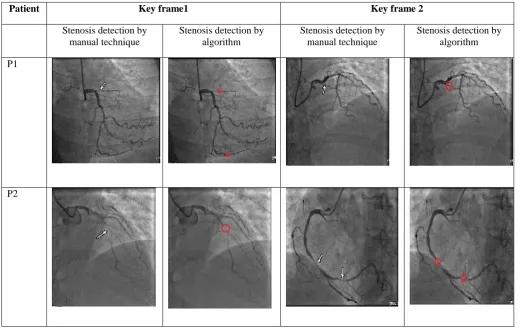
Patient Key frame1 Key frame 2
Stenosis detection by manual technique
Stenosis detection by algorithm
Stenosis detection by manual technique
Stenosis detection by algorithm
P1
P2
[image:4.595.36.559.400.728.2]Stenosis Detection Algorithm for Coronary Angiograms
D.Stenosis Detection
The vessel thickness in each line of vessel potion is stored in a separate array in the form of number of pixels. The thickness in each line is compared with the thickness of the previous line. If there is a sudden decrease in the thickness of the vessel then that is considered as stenosis and the corresponding position is marked.
for each line i in the image k=0; if(abs(vesthick[i]-vesthickness[i+1]))<=5) continue; else stenosis[k]=i; k++;
The coordinate positions of the stenosis are recorded in an array called stenosis. These coordinates are used to mark the stenosis positions in the input image. The stenosis marked images are given in fig 5.
V. RESULTS AND DISCUSSION
[image:5.595.313.544.215.364.2]A stenosis was detected using the proposed algorithm in the 42 patients dataset provided by large hospital in Chennai. It is compared with the manually detected images provided by the experts from the same hospital. The True positive, false positive and false negative values are recorded in Table I,II and III and sensitivity is calculated.
Table I Stenosis detection in case of 64x64 pixels block size Patie nt No. of ste nos is Corre ctly identif ied (True positiv e) Misse d out (False negati ve) Incor rectly identi fied (Fals e positi ve) Sensitivi ty
P1 4 4 0 1 100
P2 5 4 1 2 80
P3 7 7 0 1 100
P4 3 3 0 2 100
P5 2 2 0 0 100
P6 0 0 0 1 0
P7 1 1 0 1 100
P8 0 0 0 0 0
P9 6 6 0 0 100
P10 8 8 0 2 100
P11 0 0 0 1 0
P12 0 0
0 2 0
P13 3 3 0 1 100
P14 4 3 1 1 75
[image:5.595.52.287.254.575.2]Average 95.5%
Table II Stenosis detection in case of 32x32 pixels block size Patie nt No. of sten osis Corre ctly identif ied (True positiv e) Misse d out (Fals e negat ive) Incorre ctly identifi ed (False positive ) Sensiti vity
P1 4 3 1 3 75
P2 5 3 2 2 60
P3 7 4 3 1 57.14
P4 3 0 3 2 0
P5 2 1 1 2 50
P6 0 0 0 1 0
P7 1 0 1 1 0
P8 0 0 0 0 0
P9 6 4 2 0 66.66
P10 8 6 2 2 75
P11 0 0 0 1 0
P12 0 0 0 2 0
P13 3 2 1 1 66.66
P14 4 3 1 1 75
[image:5.595.305.550.399.713.2]Average 52.54 %
Table III Stenosis detection in case of 16x16 pixels block size Patie nt No. of steno sis Correc tly identifi ed (True positiv e) Misse d out (False negati ve) Incorre ctly identifie d (False positive ) Sensiti vity
P1 4 1 3 3 25
P2 5 2 3 2 40
P3 7 3 4 1 42.85
P4 3 1 2 2 33.33
P5 2 1 1 2 50
P6 0 0 0 1 0
P7 1 0 1 1 0
P8 0 0 0 0 0
P9 6 3 3 0 50
P10 8 3 5 2 37.5
P11 0 0 0 1 0
P12 0 0
0 2 0
P13 3 1 2 1 33.33
P14 4 1 3 1 25
Average 33.7%
From the above three tables it is clear that the proposed algorithm gives more sensitivity when block size is 64x64 pixels. Sensitivity is
calculated as the ratio of
International Journal of Innovative Technology and Exploring Engineering (IJITEE) ISSN: 2278-3075, Volume-8 Issue-9, July 2019
identification to the total number of stenosis. The sensitivity obtained is 95.5%, 52.54% and 33.7% in case of 64x64 pixels block size, 32x32 pixels block size and 16x16 pixels block size respectively. The algorithm produces better results compared to the manual detection technique when the block size is of 64x64 pixels block.
ACKNOWLEDGMENT
We would like to thank Chettinad HealthCity, Chennai for providing dataset to perform the successful research.
REFERENCES
1. Nayana mohan, Vishnu kumar S, “Detection and Localization of Coronary Artery Stenotic segments using Image Processing”, IEEE International conference on Emerging Technological Trends(ICETT), 2016.
2. Y. Chi, W. Huang, J. Zhou, K. K. Toe, J-M Zhang, P. Wong, S.T. Lim, R. S. Tan, and L. Zhong, “Stenosis Detection and Quantification on Cardiac CTCA using Panoramic MIP of Coronary Arteries”, Engineering in Medicine and Biology Society (EMBC), 2017 39th Annual International Conference of the IEEE.
3. Franz von Ziegler et al, “Detection of significant coronary artery stenosis with 64-slice computed tomography in heart transplant recipients: a comparative study with conventional coronary angiography”, Int J Cardiovasc Imaging (2009) 25:91–100, Springer Science+Business Media, B.V. 2008
4. Jongin Park et al., “Fast Coronary Doppler Vibrometry to Detect Myocardial Vibration Associated with Coronary Artery Stenosis Using Flash Imaging”, Ultrasonics Symposium (IUS), 2013 IEEE International
5. Colin B. Compas et. al., Automatic Detection Of Coronary Stenosis In X-Ray Angiography Through Spatio-Temporal Tracking, 2014 IEEE 11th International Symposium on Biomedical Imaging (ISBI). 6. J. Matthias Kerl et. Al., “Accuracy of coronary artery stenosis
detection with CT versus conventional coronary angiography compared with composite findings from both tests as an enhanced reference standard”, Eur Radiol (2011) 21:1895–1903, Springer. 7. P. Mirunalini et.al., “Automatic Segmentation of Coronary Arteries
and Detection of Stenosis”, TENCON 2013 - 2013 IEEE Region 10 Conference (31194).
8. Wei-Hua Yin, “Detection of coronary artery stenosis with sub-milliSievert radiation dose by prospectively ECG-triggered high-pitch spiral CT angiography and iterative reconstruction”, European Society of Radiology 2013, Springer.
9. Katharina Anders et al.,“Accuracy of automated software-guided detection of significant coronary artery stenosis by CT angiography: comparison with invasive catheterization”, European Radiology, (2013) 23:1218–1225, Springer
10.Abolfazl khedmati et al., “Semi-automatic detection of coronary artery stenosis in 3D CTA”, IET Image Processing, 2016.
11.Ankur Sharma et al., “Analysis and Interpretation of Coronary Artery Blockage using Soft Computing Techniques”, IOSR Journal of Computer Engineering,Volume 18, Issue 5, Ver. II, PP 74-80. 12.T Syeda-Mahmood, F Wang, R Kumar, D Beymer, Y Zhang, R
Lundstrom, and E McNulty, “Finding similar 2d x-ray coronary angiograms,” pp. 501–508, 2012.
13.M.Sambath, Dr.D.John Aravindhar, Dr.Pradeep G Nayar, “Coronary Vessel Extraction Algorithm for Block Detection in Angiograms”, International Journal of Pharmaceutical Research, April- June 2019, Vol 11, Issue 2.
AUTHORS PROFILE
Mr. M. Sambath is graduated in Computer Science & Engineering in the year 2001 and obtained his Master degree in Computer Science & Engineering from Anna University in the year 2008 and currently pursuing his Ph.D. in the area of Image Processing at Hindustan Institute of Technology and Science, Chennai, India. His area of interest includes Image processing, Algorithms, Operating systems.
Dr.D.Johnaravindhar is graduated in Electrical & Electronics Engineering in the year 1999 and obtained his Master degree in Computer Science & Engineering from Anna University in the year 2003 and completed his Ph.D. in the area of Data mining at Hindustan Institute of Technology and Science, Chennai, India. He is currently working as Associate Professor in Hindustan Institute of Technology and Science, Chennai, India. His area of interest includes Data mining and Data warehousing, Database management systems, Image mining, Bigdata and IOT.