Abstract.--- Topology Optimization is an effective method of minimising waste and optimising the structural design of the objects. 3D printing is one of the modern manufacturing technologies that can be significantly improved by implementing the topology optimization of printed objects. Geometry optimization in manufacturing technologies can eliminate the unnecessary parts of the 3D printed objects that are not affected by loads, stresses and strains. Therefore, implementing this technique can result in a significant reduction of waste materials and production costs. In this paper, shape optimization by the Layer-by-Layer (LbL) method and shape optimization by Homogenization of composite materials are discussed. The computational analysis was conducted by specifically designing specimens for the tensile load and obtaining the optimized shape for each design. These flat plates have similar shapes, but different compositions. The first method proposes the development of a composite structure by the Layer-by-Layer method and then applies the topology optimization process. The second method focuses on the development of a homogeneous composite structure by the computation of mechanical properties, which is then followed by implementing the topology optimization method based on ANSYS simulation. The main aim of this work is to compare and select the best shape optimization technique for the reduction of materials used in 3D printing.
Keywords: Additive manufacturing, Layer-by-Layer (LbL), Shape optimization, Topology optimization.
I. INTRODUCTION
Topology optimization is derived from mechanics, mathematical programming and calculus of variations concepts [1]. It is a technique that has a constant development and an expanding interest among engineers and manufacturers in the research field and industry of additive manufacturing. The first paper devoted to the analysis of topology optimization was published by Michelle in 1904 [2]. In this study, there were defined optimality criteria for creating the trusses with the least weight layout. In 1988, Bendsoe and Kikuchi presented the Homogenization Based Topology Optimization (HBTO) method that laid the foundations in the topology optimization method and specified cavities to achieve optimal porosities in a model of material [3]. Sigmund demonstrated MATLAB code for topology optimization that is based on compliance minimization utilizing optimality criteria determined by the sensitivity of the objective
Revised Manuscript Received on April 15, 2019.
Md. Hazrat Ali1, Department of Mechanical Engineering, School of Engineering Nazarbayev University, 010000 Astana, Kazakhstan. (email: [email protected])
Gaziz Yerbolat, Department of Mechanical Engineering, School of Engineering Nazarbayev University, 010000 Astana, Kazakhstan.
Gulzhahan Islam, Department of Mechanical Engineering, School of Engineering Nazarbayev University, 010000 Astana, Kazakhstan.
Shynggys Amangeldi, Department of Mechanical Engineering, School of Engineering Nazarbayev University, 010000 Astana, Kazakhstan.
M.Y. Zhao, Department of Mechanical Engineering, School of
function [4]. The practical applications of this structural optimization method can be demonstrated in the automotive and aerospace industries [5]. It has been widely agreed that topology optimization can result in a considerable reduction in material waste of the 3D printed objects. Many research works are devoted to investigating different techniques used to enhance the performance of 3D printed products. Jankovics et al. presented the customized ANSYS APDL topology optimization method that eliminates the production of support structures for additive manufacturing [6]. Topology optimization based on numerical modeling of optimized structures was presented by Nguyen, Tran, and Nguyen in their research [7]. ParetoWorks plug-in of the Solidworks software was developed by their researchers to reduce the volume of any object to the most cost-effective shape [8]. The program estimates the optimal shape and topology after the user provides the specification of the constraints of space, loads scenario and other manufacturing constraints. In this research paper, analysis of two shape optimization techniques of composite materials based on ANSYS Mechanical Topology Optimization tool is discussed. ANSYS Topology Optimization tool allows users to lower the loads on moving parts and increase durability, and eliminate extra weight and materials from the specimens in the software [9]. The first method is the Layer-by-Layer topology optimization process, where composite materials are deposited in a layer structure with corresponding material for each layer. In this method, an appropriate number of layers with material combinations are defined, and then topology optimization is performed. The second method is the shape optimization of the homogenized composite. The uniqueness of this method is that the mechanical property of the composite materials is calculated in the previous study [10], and then the topology optimization is performed considering the specimen as one material.
II. TOPOLOGY OPTIMIZATION ALGORITHM
The science of topology is the study which considers the properties of space that are invariant under any continuous deformation [11]. It is the fundamental principle of topology optimization which minimizes the geometry and mass according to the mechanical constraints applied on it [12]. The working principle of topology optimization is used in this research in the placement of materials according to its classification into the void and solid elements by a finite element discretization. The placement of material points in topology optimization can be explained by material
Shape Optimization for Composite Polymers
in 3D printing
interpolation, and mathematically it can be expressed as in equation (1) and (2).
( ) (1)
{
(2)
The Ein equation (1)is a local stiffness tensor formulated by density vector which contains elemental densities [13]. Here, is an available domain which is according to formula (3):
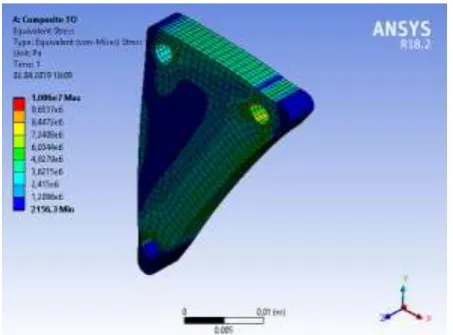
[image:2.595.56.283.558.725.2]∫ ( ) (3) where V is initial volume constraint specifies by , and if it is equal to 1, then it is considered to be filled; otherwise, it is considered to be void and can be extracted. In addition, to parametrize the topology of the geometry, boundary variation and density-based methods can be applied. These methods depend on the gradient-based or non-gradient based on the algorithm in FEA. Boundary variation is comparatively easier as it generates a clear contour of the geometry and it considers boundary conditions applied to parametrize the geometry [12]. Therefore, the same approach is used for this study as it considers solid composite shapes under mechanical stresses. The elements which experience comparatively lower loads and less stress are considered as void elements, and the stress is transferred to filled elements which are the critical material points in the geometry. The void elements are extracted from the geometry during the topology optimization process. Topology optimization used in this research can be defined as the method that identifies the most effective distribution of materials of the specimen by considering mechanical constraints on given geometry. Fig.1 demonstrates the equivalent stress of the specimen under the load, applied on the cylindrical hole at the right corner of the specimen. As can be seen, blue regions experienced the least value of stress, and therefore, when the topology optimization tool is performed on this specimen, blue regions are extracted first. However, after the elimination of the regions with the least stress, the stress experienced by the remaining regions will considerably grow.
Fig 1. Stress distribution of triangular specimen under load.
The mathematical equation which describes the topology optimization tool according to equilibrium at u and displacement v, where optimal stiffness tensor is derived is shown in equation (4) [14].
( ) ∫ ( ) ( ) ( ) (4) From this equation, previously described equations (2) and (3) are derived.
III. MATERIALS USED
Computational simulations demonstrated in this study are based on the usage of three different materials: Nylon 6, Nylon 12 and Nylon 6 Flame retardant. The main advantage of selecting nylon plastic material is that it is available in the market as well as applicable to a wide range of additive manufacturing technologies, including FFF (Fused Filament Fabrication)/FDM (Fused Deposition Modeling), SLS (Selective Laser Sintering) and SLA (Stereolithography) printing [15]. Nylon is frequently used to achieve both the strength and flexibility of the product. It is hygroscopic and can absorb liquids, thus easy to change its color. These materials as mentioned earlier differ from each other by their mechanical properties. The fibers of Nylon 6 are tough and exhibit high tensile strength, elasticity, and luster [16]. This material is wrinkle proof, abrasive and chemical resistant, including alkalis and acids. The hygroscopic property of Nylon 6 causes the fibers to absorb up to 2.4% of water. However, at the same time moisture acts as a plasticizer, thus lowering the performance of the tensile strength and stiffness, while increasing elongation [17]. The melting point of the Nylon 6 is 215 °C, and it can withstand heat up to 150 °C. This material is used in applications that require high toughness, wear-resistance, and lubricity, such as gear wheels [18]. Nylon 6 Flame Retardant has similar mechanical properties of the Nylon 6 while being flame retardant [19]. The mechanical properties of Nylon 12 are between short chain aliphatic nylons (e.g., Nylon 66 and Nylon 6) and polyolefin. The melting point of this material is the lowest among other significant polyamides, ranging from 178 °C to 180 °C. However, it should be noted that it exhibits the same tensile strength and resistance to abrasion as Nylon 6. Nylon 12 has low water absorption and dimensional stability due to its relatively long hydrocarbon chain length [20]. The content of the moisture does not affect its shock resistance. Nylon 12 is low-temperature resistant and has low friction coefficient [21]. This material is also resistant to chemicals and insensitive to stress cracking [20]. It is widely used in the food industry for food packaging and in the medical field for providing sterilized films.
IV. SHAPE OPTIMIZATION OF THE
COMPOSITE STRUCTURE BY THE LAYER-BY-LAYER (LBL) METHOD
[22]. For instance, desired stiffness and toughness were obtained by bio-inspired natural shell composite [23]. Multilayered composite interface demonstrates better stress distribution, which is critical in shape optimization processes [22]. Topology optimization is performed by removing the regions with no or less stress and increasing those with more stress in critical regions. The important point here is to determine the maximum stress that a material can withstand. Therefore, in ANSYS a set of parameters such as density, tensile and compressive yield strengths, isotropic elasticity and ultimate tensile strength were defined for each material. The material properties defined in ANSYS are shown in Table 1. The idea of shape optimization by layered structures of composites comes from Additive Manufacturing (AM) principle, which is also the same as FDM printer’s Layer-by-Layer printing method. This idea solves the problem of recreating realistic composite structures in design software, such as in ANSYS. It is difficult to construct composite materials and perform FEA without computational software.
Additionally, it can be implemented in other types of printing technologies, as the layered structure of composites imitates the homogenization of materials, which is used in SLS and SLA printing techniques. To obtain the most effective shape optimization, in the layered structure of a composite polymer, the number of layers with thickness, as well as material order should be analyzed. All the analysis is performed in ANSYS 18a software with ISE geometry, static structural and topology optimization functions.
Table 1.Mechanical properties of the selected materials Nylon
PA12
Nylon PA6
Nylon PA6 Flame Retardant
Density[ ] 0.95 1.14 1.18
Young`s Modulus [MPa]
1892,5 2280 2540
Poisson ration [MPa]
0.393 0.372 0.372
Tensile Yield Strength [MPa]
44.2 62.8 64.5
Compressive Yield Strength [MPa]
69.7 44.5 74.2
Tensile Ultimate Strength [MPa]
76.1 67.6 70.1
A. The selected number of layers in specimens
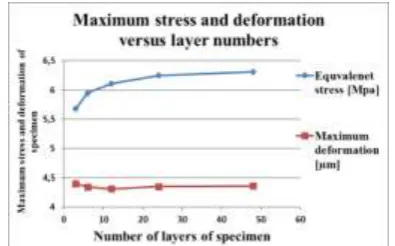
The first thing that should be considered for the analysis of the composite specimen is the number of layers because this factor is closely related to the correctness and reliability of computational results. It is important to recreate realistic composite material and apply the shape optimization technique so that there will be minimum errors in the obtained results. In this study recreation of the realistic composite was accomplished by increasing the number of layers in the composite. There were considered three, six, twelve and twenty-four layered composites as shown in Fig. 2. These multi-layered specimens were analyzed in the structural analysis platform to obtain their equivalent stress values under the applied load. Each layer of the composite is made of individual material with its distinct mechanical
[image:3.595.323.527.174.331.2]properties. For the specimens with more than three layers, the materials’ orders are repeated. In the structural analysis of each specimen, the same tensile computation is performed. As a result, the equivalent stresses and deformations of the specimens are obtained. The objective is to define how numbers of layers influence the stress and deformation values of the specimen under the load. This information can be then used to identify the optimal number of layers for further analyses of the study.
Fig.2. Specimens with a different number of layers. Fig. 3 shows the obtained results of the equivalent stress and deformation. As can be seen, equivalent stress changes exponentially, whereas the deformation trend has almost the same pattern, except for the three-layer composite which has slightly higher stress and deformation. The higher number of layers might provide more accurate data. However, the major limitation of this analysis is high computational complexity. According to the test results, the six-layered composite is the most effective and appropriate for further computational analysis. It provides quite accurate results without increasing the computational complexity of the process.
Fig.3. Equivalent stress and deformation change versus specimen number of layers.
B. Composite polymer
[image:3.595.327.525.505.628.2]that stress distribution on composite materials depends on mechanical properties and order of the materials [22]. Therefore, the following analysis is investigated in ANSYS as shown in Fig. 4. In this figure, “PA6 FR” denotes “Nylon Polyamide 6 Flame-retardant” whereas “PA6” and “PA12” are abbreviations of “Nylon Polyamide 6 unreinforced” and “Nylon Polyamide 12”, respectively. Three identical specimens with different material orders are designed. Then the bending load is applied to the materials as shown in Fig. 5. Afterwards, the topology optimization process is implemented for the created specimens.
Fig.4. Specimens with a different order of materials. (a) PA12- PA6-PA6 FR, (b) PA12-PA6 FR-PA6 and (c) PA6
[image:4.595.61.274.194.355.2]FR-PA12-PA6
Fig 5. Mechanical analysis performed on specimens with a different order of materials.
The force is applied simultaneously to three materials downwards; therefore, there is no need to consider the impact of stress on the materials located at the top and bottom sides. This measure decreased the number of combinations for simulations. ANSYS topology optimization investigated the maximum shape and material of the specimens that can be optimized. The point here is to define in what order the maximum shape can be optimized from the specimen with the applied bending or tensile force.
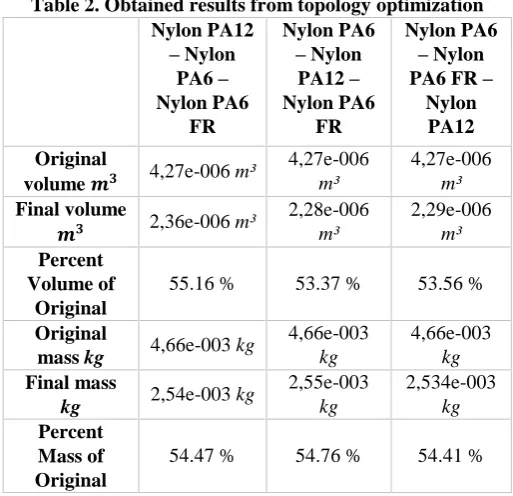
Table 2. Obtained results from topology optimization Nylon PA12
– Nylon PA6 – Nylon PA6
FR
Nylon PA6 – Nylon
PA12 – Nylon PA6
FR
Nylon PA6 – Nylon PA6 FR –
Nylon PA12 Original
volume 4,27e-006 m³
4,27e-006 m³
4,27e-006 m³ Final volume
2,36e-006 m³ 2,28e-006 m³
2,29e-006 m³ Percent
Volume of Original
55.16 % 53.37 % 53.56 %
Original
mass kg 4,66e-003 kg
4,66e-003 kg
4,66e-003 kg Final mass
kg 2,54e-003 kg
2,55e-003 kg
2,534e-003 kg Percent
Mass of Original
54.47 % 54.76 % 54.41 %
[image:4.595.62.280.416.564.2]Fig 6. The optimization of specimens with (a) PA12-PA6-PA6 FR, (b) PA12-PA6-PA6-PA12-PA12-PA6-PA6 FR and (c) PA12-PA6-PA6-PA12-PA6-PA6
FR-PA12 combination of materials.
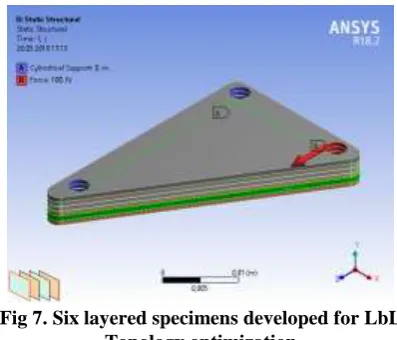
C. The key concept behind the Layer-by-layer topology optimization method
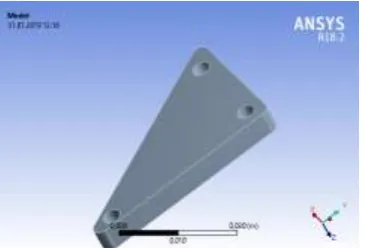
[image:5.595.68.267.225.395.2]The Layer-by-Layer method of material optimization is examined further by using a new specimen, as shown in Fig. 8. The load applied and cylindrical supports also illustrated. It is a six-layered triangular specimen with three holes, two for cylindrical support and one for the load. This specimen was selected for the analysis since it has ineffective parts with no or negligible stresses during application of loads and thus it can be optimized.
Fig 7. Six layered specimens developed for LbL Topology optimization
[image:5.595.332.521.382.697.2]Topology optimization process for this particular specimen is considered by defining the load applied to the specimen, obtaining the stress and deformation results of the simulation, and implementing the topology optimization process for all the bodies excluding the regions of support and load applied to the specimen. The maximum shape and mass optimization are obtained after specifying a maximum number of iterations and defining optimization response constraints. The final optimized shape is shown in Fig. 8. The results demonstrate the effectiveness of Layer-by-Layer topology optimization method. The absence of significant difference in mechanical properties of materials allows distributed and smooth shape optimization of the specimen. This fact demonstrates the importance of the correlation between the materials mechanical properties.
Fig 8. Optimized Layer-by-Layer composite structure`s final optimized figure.
V. SHAPE OPTIMIZATION BY
HOMOGENIZATION OF COMPOSITE MATERIALS
The second method of shape optimization presented in this paper considers the analysis and implementation of ANSYS topology optimization tools on homogenized materials. Mechanical properties of the homogenized materials were calculated by using the computational technique, based on the Rule of Mixture and Monte Carlo simulation [10]. The advantage of this technique is that it defines the multi-material specimen as one material in design software; therefore, the optimization process is easier, and the optimization error is decreased. However, during the study performed in [10], there is a possibility of considerable error during the calculation of mechanical properties as the Monte Carlo simulation is based on the probability distribution. In this homogenization technique, mechanical properties of the composite materials are defined by inserting the mechanical properties inside the developed special GUI platform as shown in Fig. 9. The Rule-of-Mixtures and Monte Carlo Simulation allow distribution of the three materials to produce one layered homogenized material. Next, the new composite polymer material is used for further study in ANSYS and mechanical properties of the composite are imported into ANSYS to perform the static structural and the topology optimization simulations.
Fig.9. GUI for Calculation of composite materials properties (a) Materials selection, and (b) Material
[image:5.595.68.272.598.730.2]Fig.10. The homogenous composite model developed for topology optimization
[image:6.595.79.260.335.457.2]The geometry developed for the second optimization method was the same as in the Layer-by-Layer optimization case. However, it has only one layer, the thickness of which is equal to the summation of the thickness of all six layers of the Layer-by-Layer composite, as shown in Fig. 10. As in the previous simulations with the first shape optimization method, ANSYS topology optimization tool is applied to the model. Redundant materials are removed, and the optimized shape of the object is created as shown in Fig. 11.]
Fig.11. The specimen after the topology optimization was performed
VI. RESULTS
The simulation results of the topology optimization for both the techniques are obtained and shown in Table 3. The result demonstrates an effective method of shape optimization for composite polymers and shows the possibility of optimization for composite materials.
Table 3. Shape optimization of both techniques Shape
optimization of the composite
structure by LbL method
Shape optimization by homogenization
composite method Original volume 2,12e-006 m³ 2,12e-006 m³
Final volume 6,64e-007 m³ 7,07e-007 m³ Percentage Volume
of the Original
31,28 % 33,31 %
Original mass kg 2,31e-003 kg 1,67e-002 kg Final mass kg 7,27e-004 kg 5,55e-003 kg Percentage Mass of
the Original
31,43% 33,31 %
However, there is a slight difference between the results which might have a significant effect on production cost. According to the results, Layer-by-Layer optimization demonstrates better results compared to the homogenization method. Considering each layer separately as shown in Layer-by-Layer topology optimization method, proves to be effective and accurate by the computational simulation methods. However, the main disadvantage of the Layer-by-layer method is the complexity of the physical algorithm, whereas the homogenization method executes faster and obtains the results in a short time. Nevertheless, the major disadvantage of the homogenization method is that it generates more errors compared to the first method as indicated in the previous study [10].
Topology Optimization is becoming an extensive subject to discuss among researchers, engineers and manufacturers. This technological advance is capable of eliminating extra mass, weight and volume and at the same time increasing the efficiency of the structures. Research of topology optimization is in the constant development and improvement since the publication in the year 1904. At present, there are numerous software and computational programs that allow conducting comprehensive topology optimization of the structures.
In this study, two shape optimization methods for composite polymers were proposed and analyzed. The obtained results of these two methods were based on the operation principle of the ANSYS Mechanical Topology Optimization tool. The first study was the shape optimization by the Layer-by-Layer method and the second one was the shape optimization by homogenization of the composite method. Even though both methods demonstrate effective optimization, the Layer-by-Layer method proves to be more reliable, effective in terms of material removal and cost. However, the homogenization method was proved to require less computational time. This issue is related to the fact that specimens analyzed by Layer-by-Layer method have several distinct layers with individual mechanical properties. At the same time, the homogenization method involves computational analysis of single layer, material properties of which was already determined by combining several individual materials in MATLAB using Monte Carlo simulation and Rule-of-Mixtures method.
According to the obtained results, there is a difference in the volume and thickness of adjacent individual layers of the specimen provided by Layer-by-Layer method. In an ideal case scenario, topology optimization evenly and proportionally reduces the volume of the adjacent layers. Therefore, this issue obtained from Layer-by-Layer topology optimization method should be analyzed further in the future work. In addition, as a recommendation to this project, it is required to decrease the errors of the homogenization method by improving the algorithm in MATLAB program and Monte Carlo simulation.
VII. CONCLUSION
more reliable and effective results with high time complexity as compared to the homogenization method. In future, the algorithms can be improved in the MATLAB platform for both the homogenization method and topology optimization approach for Layer-by-Layer method.
REFERENCES
1. Rodrigues, H., Herskovits, J., Soares, C., Guedes, ., Ara jo, A., Folgado, J., Moleiro, F., Madeira J., (2014). Engineering optimization IV. ISBN: 1138027251
2. Michell, A. G. M. (1904) The limits of economy of material in frame-structures, Philosophical Magazine, Vol. 8(47), p. 589-597.
3. Bendsoe, M., Kikuchi, N., (1988/11)."Generating optimal topologies in structural design using a homogenization method." Computer Methods in Applied Mechanics and Engineering 71(2): 197-224.
4. Sigmund, O., "A 99 line topology optimization code written in Matlab", Struct. Multidisc. Optim. 21, pp 120– 127, Springer-Verlag, 2001.
5. Fanni, M., Alkalla, M. and Shabara, N., (2013) A Comparison
Between Different Topology Optimization Methods,
Engineering Journal
6. Jankovics, D., Gohari, H., Tayefeh, M., &Barari, A. (2018).
Developing Topology Optimization with Additive
Manufacturing Constraints in ANSYS®. IFAC-Papers online, 51(11), 1359-1364. doi: 10.1016/j.ifacol.2018.08.340 7. Nguyen, K., Tran, P., & Nguyen, H. (2019). Multi-material
topology optimization for additive manufacturing using
polytree-based adaptive polygonal finite elements.
Automation In Construction, 99, 79-90. doi:
10.1016/j.autcon.2018.12.005
8. Solidworks, Paretoworks, Retrieved from
https://www.solidworks.com/partner-product/paretoworks. 9. Topology Optimization Software | ANSYS. (2019). Retrieved
from https://www.ansys.com/products/structures/topology-optimization
10. Yerbolat, G., Amangeldi, S., Ali, M. H., Badanova, N., Ashirbeok, A., & Islam, G. (2018, November). Composite Materials Property Determination by Rule of Mixture and Monte Carlo Simulation. In 2018 IEEE International
Conference on Advanced Manufacturing (ICAM) (pp.
384-387). IEEE.
11. What is Topology? (2015, October 19). Retrieved February 05, 2019, from https://uwaterloo.ca/pure-mathematics/about-pure-math/what-is-pure-math/what-is-topology
12. Ranaivomiarana, N., Irisarri, F. X., Bettebghor, D., & Desmorat, B. (2018). Concurrent optimization of material spatial distribution and material anisotropy repartition for
two-dimensional structures. Continuum Mechanics and
Thermodynamics, 1-14.
13. Larsson, R. O. B. I. N. (2016). Methodology for Topology and Shape Optimization: Application to a Rear Lower Control
Arm. Department of Applied Mechanics CHALMERS
UNIVERSITY OF TECHNOLOGY, Goteborg.
14. Jensen, F. (2018). Topology Optimization of Turbine Manifold in the Rocket Engine Demonstrator Prometheus. 15. Ahmed, R. (2019). All You Need to Know About Nylon
Printing - 3D Printing. Retrieved from
https://3dprinting.com/filament/3d-print-nylon-filament-tips/.
16. Stratasys. (2019). FDM Nylon 6. Retrieved from:
https://www.forecast3d.com/wp-content/uploads/2018/07/FDM_Nylon-6.pdf
17. Textile Engineering. (2016). Polyamide Fiber Physical and
Chemical Properties of Nylon 6, Retrieved from
textilefashionstudy.com.
18. RTP Company. (2019). Nylon 6 (PA)- Polyamide 6,
Retrieved from:
https://www.rtpcompany.com/products/product-guide/nylon-19. PAR Group. (2019). Nylon 6 Sheet - Flame Retardant, Retrieved from: https://www.par-group.co.uk/engineering- plastics/plastic-sheet/nylon-6-sheet-availability/nylon-6-sheet-flame-retardant/
20. Mark, James E. (1999). Polymer Data Handbook. Oxford University Press, Inc. ISBN 978-0195181012.
21. Plastem Engineering Plastics. (2019). Nylon 12, Retrieved from: http://plastim.co.uk/nylon-12
22. Zhang, X., Xu, Y., Zhang, X., Wu, H., Shen, J., Chen, R., ... & Guo, S. (2018). Progress on the layer-by-layer assembly of multilayered polymer composites: strategy, structural control, and applications. Progress in Polymer Science.