International Journal of Innovative Technology and Exploring Engineering (IJITEE) ISSN: 2278-3075, Volume-8 Issue-12, October 2019
Optimization of Nigerian Power System
Distribution using Distributed Generation
Ilo, Frederick Udebunu
,
Anumaka, Michael Chukwukadibia.,
Akwukwargbu, Isdore Onyema
Abstract : The main aim of this paper is to enhance the performance of power system distribution in Enugu State Nigeria using distributed Generation System. The main function of power system distribution is to transfer electrical energy to the consumers, while maintaining an acceptable reliability and voltage quality to all customers. It is sad to know that such services is lacking from the Electrical distribution company at Enugu State Nigeria. This paper proposed to setup a centralized plants distributing electricity within the state through Distributed Generation (DG). The implemented DG was abletoreducethe Power Loss from the transmissiona n d distribution stations within the state and also improve voltage profile. The author was able to optimize the power generationfrom wind Energy source to the Distribution network and the DG system was able tostabilize the network by normalizing the fluctuating voltage profile at the distribution end of power system. In order to achieve that, the power system network wasmodeled and simulated using MATLAB/SIMULINK software. The results of the simulation with DG system and without DG system were compared. The result from power Network without DG shows instability of per-unit voltage between 0 to 5 seconds and while that from DG system shows stabilization per-unit voltage between 5 to 10 seconds. The total power system Loss without DG system was 2350KW while the power loss with DG system was 1883KW. Hence, the percentage of power system improvement was 11.03%. Therefore from the results, there is reduction of power Loss when DG is applied in the power system.
Keywords: Optimization, Distributed Generation, Power system, MATLAB, Power System.
I. INTRODUCTION
The need for steady and quality power supply in Nigeria was the main motivation to this paper. Federal Government of Nigeria had spent billions of Nigeria in Power sector but it seems as giving ingestion to a dead person. Unsteady power supply has crippled economic activates in the country, so researcher should provide alternative ways to solve the problem. From the review of other works, several definition and suggestions were made on power system.The electric power system basically comprises of the generating stations, the transmission stations, the distribution stations and the load centers. They are all connected in such a way that electrical power can be transmitted from the generation unit to the end users, while ensuring the operational requirements of the system are not violated in order the provide a reliable service to the customers. The
Revised Manuscript Received on October 05, 2019
Ilo, Frederick Udebunu, Department of Electrical and Electronic and Engineering Enugu State University of Science & Technology, Enugu, Nigeria
Anumaka, Michael Chukwukadibia., Department of Electrical and Electro
Akwukwargbu, Isdore Onyema, Department of Electrical and Electronic and Engineering, Federal University of Technology, Owerri, Nigeria
conventional power system was designed to transfer electrical power from the generating unit to other parts of the power system in a radial configuration via long transmission and distribution networks. Many of these generating units are found at large power plants and are majorly thermoelectric and hydro dependent, which are usually isolated from load centers (Kashem, Tas, Le, Negnevitsky & Ledwich, 2006).Since electricity is generated to be consumed at the same time it is demanded due to the fact that it cannot be stored efficiently in large amounts, power system operators must balance power generation and demand constantly without violating the active and reactive power constraints (Horowitz and Phadke, 2016). As distribution systems were designed for radial operation the presence of generation units at distribution level was not considered in the design. This in itself does not mean that distributed generation will cause problems but it does lead to a serious fear among many power system operators that the reliability and quality of the supply can no longer be guaranteed. This change in structure demands the coordination of the operation of a large number of systems and the electricity networks (Anderson et al, 2005; Abu-Mouti, 2011). Thus, the importance of information and communication technology for energy systems will further increase. Several potential problems have been reported in literature, with voltage control being widely considered the most serious one Marimuthu, Gnanambal, Eswari and Pavinthra, 2016, often leading to blackouts and ultimately system collapse.A major blackout occurs when a large area, or a complete area of a power system, collapses. The main cause of a major blackout is a succession of cascading failures that trip a transmission line or some generation units.These failures or faults are called contingencies. A partial blackout may start with a severe contingency which can cause a large variation in power flow and bus bar voltage which, in turn, can cause the outage of generation units or transmission lines. This certainly causes an imbalance in the demand for and generation of power. This process can be the beginning of a major blackout when it spreads uncontrollably throughout the power system IEEE Standard, 2003; Brown, 2008).
II. DISTRIBUTED GENERATION
Distributed generation (DG) are sources integrated with the distribution systems to offer various means of energy production and conversion in contrast to the vast generators which are connected to the transmission systems. These alternative sources of energy like the wind turbines, diesel power generators, gas turbines, photovoltaic cells and other renewable energy technologies require converters to make them useful to the distribution
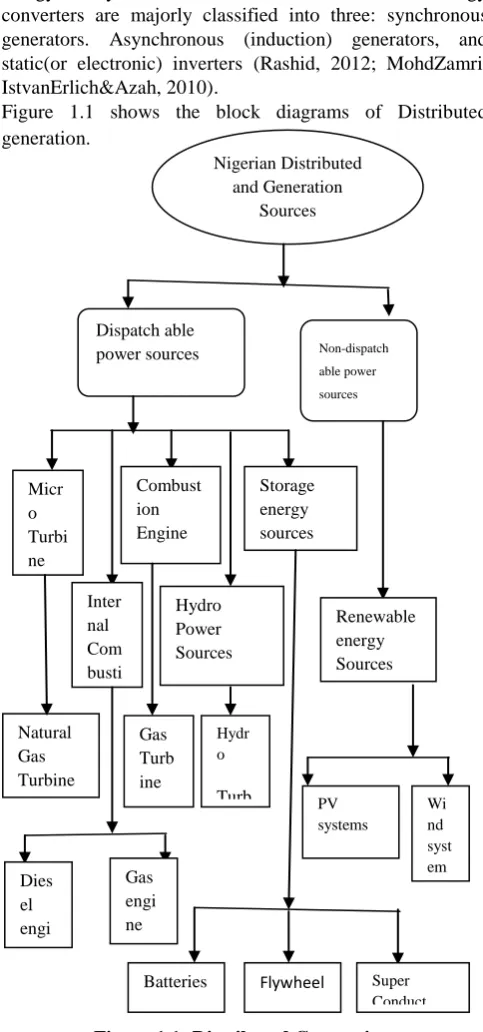
& Das, 2016). These alternative sources of energy however have their peculiar characteristics which majorly depend on their means of conversion in order to synchronise with the energy utility at the distribution end. Electrical energy converters are majorly classified into three: synchronous generators. Asynchronous (induction) generators, and static(or electronic) inverters (Rashid, 2012; MohdZamri, IstvanErlich&Azah, 2010).
Figure 1.1 shows the block diagrams of Distributed generation.
Figure 1.1: Distributed Generation.
DG units are usually of lesser sizes compared to the central generators and can be located near the customers owing to the fact they may be attached to any voltage level. This reduces transmission losses hence, improving the efficiency of the entire power system. Distributed generation (DG) units vary in capacity ranging from a few kVA values to hundreds of MVA and they employ varying technologies for generation. Load-following DG units often utilize synchronous generators (Roberto, 2009).
III. WIND TURBINES
A wind turbine is a machine which traps and changes the kinetic energy of the wind into mechanical energy and then
to electrical energy by means of an AC induction generator. The availability of wind appears stochastic, hence making it almost impossible to forecast the wind speed and the wind power production more than few hours before time. It is also important to forecast correctly the time when wind speed would be sufficient enough to drive the turbines so that wind generating stations may be able to participate in electric power generation. The annual quantity of electrical energy generated by the wind turbine is greatly influenced by the location of the turbine. Wind turbines are majorly located with regards to adequate wind availability and condition rather than being located in favor of the grid. Wind energy is one of the most used DG source across the globe. Group of wind turbines installed and operated in a place is referred to as a wind farm. The most appropriate place to locate the wind farm is a windy environment, because the degree of availability of wind determines the amount of electrical energy generated(CIGRE, 2000; Johnson, 2006; Slootweg, 2005).
IV. MATERIALS AND METHODOLOGY
This study analyzed the New-haven 33/11kv substation system with impact of DG for optimization of active and reactive power using Simulink model. The load flow analysis was programmed in MATLAB/Simulink.
The method adopted while doing load flow analysis was Newton Raphson technique. The Newton -Raphson method is very effectiveness to achieve visual iterative solutions to the power flow analyses because it depends on the selection of suitable initial values for state variables involved in the study. The power flow solution started with voltage magnitudes of 1pu at all PQ buses. The slack, PV and PVT buses are given their specified values, which remain constant throughout the iterative solution if no generator reactive power limits are violated. The initial voltage phase angles were selected to be 0 at all buses.
(a) Newton-Raphson power flow Analysis The Newton-Raphson solution is a set of nonlinear power flow equation which occurs between voltage and power in a 3 phase AC power system. The equations (1) and (2) were applied to analyze 3-phase AC power system at New Heaven Enugu State, Nigeria
Nn kn k n in n i
ii i
k
V
G
Y
V
V
Cos
P
1
2
(1)
Nn kn k n in n i
ii i
k
V
B
Y
V
V
Sin
Q
1
2
(2)
The newton-Raphson solution for the power flow equation was represented by the Jacobian matrix in equation (3).
Nigerian Distributed and Generation
Sources
Dispatch able
power sources Non-dispatch
able power sources
Micr o Turbi ne
Inter nal Com busti on Engi ne
Combust ion Engine
Hydro Power Sources
Storage energy sources
Natural Gas Turbine
Hydr o
Turb ine Gas
Turb ine
Dies el engi ne
Gas engi ne
Renewable energy Sources
PV systems
Wi nd syst em
Batteries Flywheel
s
Super Conduct
[image:2.595.46.288.97.614.2]International Journal of Innovative Technology and Exploring Engineering (IJITEE) ISSN: 2278-3075, Volume-8 Issue-12, October 2019
∆𝑃𝑚
∆𝑃𝑙
∆𝑄𝑚
∆𝑄𝑙
= 𝜕 𝑃𝑚
𝜕𝛿𝑚
𝜕𝑃𝑚
𝜕𝛿𝑙
𝜕𝑃𝑚
𝜕𝑉𝑚𝑉𝑚
𝜕𝑃𝑚
𝜕𝛿𝑙 𝑉𝑙 𝜕𝑃𝑙
𝜕𝛿𝑚
𝜕𝑃𝑙
𝜕𝛿𝑙
𝜕𝑃𝑙
𝜕𝑉𝑚𝑉𝑚
𝜕𝑃𝑙
𝜕𝛿𝑙𝑉𝑙
𝜕𝑄𝑚
𝜕𝛿𝑚
𝜕𝑄𝑚
𝜕𝛿𝑙
𝜕𝑄𝑚
𝜕𝑉𝑚𝑉𝑚
𝜕 𝑄𝑚
𝜕𝛿𝑙 𝑉𝑙
𝜕 𝑄𝑙
𝜕𝛿𝑚
𝜕𝑄𝑙
𝜕𝛿𝑙
𝜕𝑄𝑙
𝜕𝑉𝑚𝑉𝑚
𝜕𝑄𝑙
𝜕𝛿𝑙𝑉𝑙
∆𝛿𝑚
∆𝛿𝑙
∆𝑉𝑚
𝑉𝑚
∆𝑉𝑙
𝑉𝑙
(3)
The state variables m, 𝛅l, Vm and Vl with correction values
Δ𝛅 and ΔV were added for each iteration. The derivative of P and Q forms the Jacobian matrix‟s element. Iterations was started with initial estimates of state variables. The new voltage profile at bus m was given in equations (4) and (5). Figure 1.2 shows the 11KV distribution network.
𝑉𝑚
(𝑖) = 𝑉𝑚
(𝑖−1) + ΔV𝑚
(𝑖)
(4)
δ𝑚(𝑖)
= δ𝑚(𝑖−1) + Δδ𝑚(𝑖) (5)
Where „i' is the number of iteration
Figure1.2: An 11KV Distribution Network With DG Connection Horowitz &Phadke, 2003)
The items are composed with constraints to obtain the proper objective functions. The main constraints are: (a) Load Losses
Before installing DG to power grid, there should be more power losses in the system and after the installation there should be lesser power loss ieLoss with DG ≤ Loss without DG
(b) Voltage constraint
V bus min ≤ V bus ≤ V bus max
The objective function, with constraints and goals, was determined as following:
(6)
withoutDG withDG
Voltage
i
i
Voltage
R
%
%
(7)
mi
withDG
withoutDG
Pi
Pi
T
1 (8)
mi
withDG
withoutDG
Qi
Qi
W
1 (9)
First term in this expression, related to difference between average voltage profile percentage in base case and other cases according to DG‟s locations. By so doing, summation of active and reactive power losses and difference are computed to enable the objective function to be established. Maximum operator was used for enforcing the constraints. The parameters are stated below:
withDG
i
voltage
%
: Voltage Percent in ith bus with DGresource.
withoutDG
i
voltage
%
: Voltage Percent in ith buswithout DG resource.
withDG
Pi
: Active Power Losses in jth branch with DGresource.
withoutDG
Pi
: Active Power Losses in jth branch withoutDG resource.
withDG
Qi
: Reactive Power Losses in jth branch withDG resource.
withoutDG
Qi
: Reactive Power Losses in jth branchwithout DG resource.
K1,k2, k3: Emphasis or penalty factors
n: Number of Buses
m: Number of Branches.
In case that voltage limits are violated, Pand Q loads are modified as:
𝑃𝑘 =
−𝑃𝐿𝑘𝑉2𝑘
𝑉𝑙𝑖𝑚𝑘 2
(10)
𝑄𝑘 =
−𝑄𝐿𝑘𝑉2𝑘
𝑉𝑙𝑖𝑚𝑘 2 (11)
Where 𝑉𝐿𝑙𝑖𝑚 is dependent on the case 𝑉𝐿𝑚𝑎𝑥o𝑟 𝑉𝐿𝑚𝑖𝑛. The overall efficiency of the Wind was between 20-40% of the distributed generation and its power rating varies between 0.3 to 7 MW in order to avoid waste in the system. Wind turbine mechanical output power= 1.4MW
Base power of electrical generator=1.6MVA Base wind speed=12m/s
Maximum power at wind speed =0.73p.u Base rotational speed=1.2p.u
V. DISCUSSION OF RESULT
The simulation results are presented after the optimization of Power system without DG
without DG and with DG were done. The New-haven 33/11KV substation data was collected in order to ascertain the effect of DG in the substation. Figure1.3 shows the SIMULINK design for optimization of power system with DG. Figure 1.4 shows the Voltage stability of power system without DG. This insinuate that after the Load flow analysis of 30 buses, the faulty buses that do not fall between ranges of 0.9 to 1.05 and per-unit voltages are bus1, bus2,bus3,bus9,bus10, bus11, bus12, bus13, bus16 and1.16p.u,1.09p.u,1.069p.u,1.065p.u,1.060p.u,1.082p.u,1.0 72p.u,1.071p.u and 1.06p.u respectively. Figure1.5 shows Per-Unit Voltage of power system with DG. This result shows that the optimization of per-unit voltage power system and faulty buses with DG are 1.046p.u, 0.9829p.u, 0.9639p.u, 0.9603p.u, 0.9558p.u, 0.9757p.u, 0.9666p.u, 0.9657p.u, 0.9558p.u and bus1, bus2,bus3, bus9, bus10, bus11, bus12, bus13, bus16 respectively. Figure1.6: Comparison of per-unit Voltage with and without DG. This shows the comparison of per-unit faulty voltage without DG and with DG. The per-unit faulty voltages without DG and with DG are 1.16p.u, 1.09p.u, 1.069p.u, 1.065p.u, 1.060p.u, 1.082p.u, 1.072p.u, 1.071p.u, 1.06p.u and 1.046p.u, 0.9829p.u, 0.9639p.u, 0.9603p.u, 0.9558p.u, 0.9757p.u, 0.9666p.u, 0.9657p.u, 0.9558p.u respectively. Finally per-voltage faullty power system stabilizes when DG is applied. Figure1.7 shows the Comparison of power Loss with and without DG. The relationship between power loss in power system without DG and with DG are 400KW, 350KW, 380KW, 390KW, 280KW, 178KW, 122KW, 100KW, 150KW and 315KW, 300KW, 340KW, 309KW, 217KW, 120KW, 83KW, 74KW,125KW respectively. therefore from the results, there is reduction of power Loss when DG is applied in the power system. The total power system Loss without and with DG are 2350KW and 1883KW. Hence, the percentage of power system improvement is 11.03%. Figure1.8 shows the Voltage stability of power system with DG. The result shows the per-unit voltage stability with time of operation. The per-unit faulty voltages with DG are1.046p.u, 0.9829p.u, 0.9639p.u, 0.9603p.u, 0.9558p.u, 0.9757p.u, 0.9666p.u, 0.9657p.u, 0.9558p.u. Thus, there was instability of per-unit voltage between 0 to 5 seconds and system stabilizes the per-unit voltage between 5 to 10 seconds.
Figure1.3: SIMULINK Model of Power System with Distributed generation
Figure1.4: shows the Voltage stability of power system without Distributed generation.
Figure1.5: Per-Unit Voltage of power system with Distributed generation
CB1 45KW
OPTIMIZATION OF POWER SYSTEM DISTRIBUTION USING DG
powergui Continuous
VOLTAGE Measurement 6
i +
-simout3
simout 2
To Workspace1 simout1
simout
Three -Phase Source
A B C
A B C a b c
A B C
a b c Vabc Iabc A B C
a b c Vabc
Iabc A
B
C a b
c Three -Phase
Transformer (Two Windings )
A B C
a b c
A
B
C Subsystem1
T
R
IP
Subsystem
In1 Out1 Out2 Out3 Out4 Out5 Out6 Out7 Out8 Out9
Scope 1
Scope
Result of affected buses 1.046
0.9829
0.9639
0.9603
0.9558
0.9757
0.9666
0.9657
0.9558
OPTIMIZED SUBSYSTEM
e
FAULT VOLTAGES
In1 In2
Out1 Out2 Out3 Out4 Out5 Out6 Out7 Out8 Out9
Divide
DG Wind Turbine
Generator speed (pu) Pitch angle (deg) Wind speed (m/s)
Tm (pu) i + -i + -i + -i
+ -i + -i +
-AFFECTED BUSES 1
2
3
9
10
11
12
1 2 3 9 10 11 12 13 16
0 0.2 0.4 0.6 0.8 1 1.2 1.4
Bus Number
V
o
lt
a
g
e
(
P
.U
)
without DG
1 2 3 9 10 11 12 13 16
0 0.2 0.4 0.6 0.8 1 1.2 1.4
Bus Number
V
ol
ta
ge
(
P
.U
)
International Journal of Innovative Technology and Exploring Engineering (IJITEE) ISSN: 2278-3075, Volume-8 Issue-12, October 2019
Figure1.6: Comparison of per-unit Voltage with and without Distributed generation
Figure1.7: Comparison of power Loss with and without Distributed generation
Figure1.8: Voltage stability of power system with Distributed generation
VI. CONCLUSION
This paper discussed the use of Distribution Generation (DG) to optimize the power system at New Haven 33/11KV
substation. The model of DG power system using
MATLAB/SIMULINK to improve Power system
performance was done by comparing the faulty per-unit voltage with and without DG system. From the result of the comparison, it wasobserved theinstability of per-unit voltage between 0 to 5 seconds and system stabilizes the per-unit voltage between 5 to 10 seconds. Therefore from the results, there was reduction of power Loss when DG was applied in the power system. The total power system Loss without and with DG are 2350KW and 1883KW respectively. Hence, the percentage of power system improvement was 11.03%. from the results, it was deduced that there was decrease in power Loss when DG was applied in the system model. Hence power system was improved when DG was introduced into the system.
REFERENCES
1. Abu-Mouti,El-Hawary,M.E. (2011) Heuristiccurve-fittedtechniquefordistributedgenerationoptimisationin
radialdistributionfeedersystems,Generation,Transmission&Distributio n,IET,vol.5(2), pp.172-180.
2. Anderson G., et al (2005). Causes of 2003 Major Grid Blackouts in North America and Europe, and Recommendation Means to Improve System Dynamic Performance.IEEE Transactions on Power System, Vol 20(4)
3. Bollen, M., Y. etal (2008).Integration of distributed generation in the power system - a power quality approach.IEEE.
4. Brown, R.L. (2008). Electric power distribution reliability, CRC press:s 2008.
5. CIGRE, (2000).CIGRE Technical Brochure on Modelling New Forms of Generation and Storage," CIGRE TF 38.01.10, November 2000. 6. Horowitz, S.H., Phadke, R.H. (2003). Power System Relaying, 2nd Ed.
Baldock: Research Studies Press Ltd, 2003.
7. IEEES ltd (2003). IEEE Standard for Interconnecting Distributed Resources with Electric Power Systems.
8. Johnson, G.L. (2006) Wind Energy Systems: Manhattan, 2006. 9. Kashem, M.A., Tas H., Le, A.D.T., Negnevitsky, M. &Ledwich, G.
(2006) “Distributed generation for minimization of power losses in distribution systems,” Power EngineeringSociety General Meeting, 2006. IEEE.
10. Marimuthu, A., Gnanambal, K., Eswari, R.P. &Pavithra, P. (2016).Optimal Location and sizing of DG units to improve the voltage stability in the Distribution system using particle swarm optimization Algorithm with time varying Acceleration coefficient;
Global Research and Development journal for Engineering, international conference on innovation in Engineering and Technology,2016
11. MohdZamri, C.W., IstvanErlich, &Azah M. (2010).Intelligent Management of Distributed Generators Reactive Power for Loss Minimization and Voltage Control," MELECON 2010 - 2010 15th IEEE Mediterranean Electro technical Conference, pp. 685-690, 2010. 12. Rashid, A. (2012) Voltage Stability Analysis with High Distributed
Generation (DG) Penetration. A thesis presented to the University of Waterloo in fulfilment of the thesis requirement for the degree of Doctor of Philosophy in Electrical and Computer Engineering Waterloo, Ontario, Canada.
13. Ricardo D. (2003).Generation with high penetration of renewable energy sources.Final public report. 2016
14. Roberto V. R. (2009) Probabilistic modeling in normal operation and the control of distribution systems with renewable source based DG units. PhD thesis, UPC, 2009.
15. Slootweg J. G. (2005) Wind Power in Power Systems.Wiley, 2005. 16. Tah, A. & Das, D. (2016).Novel Analytical method for the
placement and sizing of distributed generation unit on distribution networks with and without considering P and PQV buses,
International Journal of Electrical Power and Energy Systems, vol.78, pp.401-413.
1 2 3 9 10 11 12 13 16 0
0.2 0.4 0.6 0.8 1 1.2 1.4
Bus Number
V
o
lt
a
g
e
(
P
.U
)
without DG with DG
1 2 3 9 10 11 12 13 16
0 50 100 150 200 250 300 350 400
Bus Number
P
o
w
e
r
L
o
s
s
(K
W
)
without DG with DG
0 1 2 3 4 5 6 7 8 9 10 0
0.2 0.4 0.6 0.8 1 1.2 1.4
TIME(S)
V
o
lt
a
g
e
(P
.U