Research on the Risk Measurement for the Futures Market
of Bulk Commodity
–
Taking the silver futures as the
example
Yating Du
School of Economics, Shanghai University, Shanghai, 200122, China
Abstract. The futures transaction of bulk commodity has played an important role since China became the global manufacturing center. Taking the commodity futures market in Shanghai as the research objective, this article selects the price of silver futures, uses GARCH-VaR and Stress Testing to measure the risk tolerance of the market. The research result shows the silver price is fluctuated within the scope specified by the market and won't influence the stable operation of futures market.
Keywords. commodity futures, risk measurement; VaR; Stress Testing
With the economic development, China has become the global manufacturing center. The trade volume of bulk commodity in China is increasing on a daily basis, and the status of Chinese futures market is growing rapidly in the global futures market. Futures market, similar to other financial market (such as stock market and foreign exchange market), faces a huge market risk. The key to study the dynamic risk transaction effect of the futures exchange lies in the ability to accurately measure the risks in the futures market. Therefore, we will explore the risk measurement for the futures market of bulk commodity in China. Currently, the financial risk measurement mostly uses VaR (Value at Risk) method produced by J.P.Morgan to estimate the risks.
1 Overview of VaR model
VaR refers to a method for an overall measurement of the market risks that takes the probability and mathematical statistics as the measurement basis and takes the actual market factors into account. VaR is a relatively complete, systematic and highly prospective method for risk measurement.
VaR method originates from a significant financial disaster in 1990s. In 1993, G30 Group issued a report named Practice and Rules of Derivatives based on the research on derivative varieties, and proposed a VaR model for market risk measurement. Jorion’s(1996) standard definition of VaR was: giving the worst expected loss of assets in a certain confidence interval in a holding period. It is presented in a mathematic expression as:
9D5
(
DOI: 10.1051/ C
Owned by the authors, published by EDP Sciences, 2015
/2 01
shsconf 51 010157
Where
E
˄
˅
means the expected value of assets; the ending value of assets portfolio; the minimum ending value of assets portfolio in the confidence level . If the starting value of assets is 0; the yield rate of assets in the holding period isr
; andr
is the minimum yield rate in the confidence level , VaR may also be presented as:>
@
(
U
U
9D5
According to the formula (2), if the
r
in the confidence level can be calculated, the VaR value of this assets portfolio can be consequently obtained. So the key to calculate VaR comesdown to the way of calculating the
E
(
r
)
andr
in the holding period.In a simple situation, we assume the yield rate of assets in the holding period complies with the normal distribution:
r
~N (,
). Calculated by using the confidence level of normal distribution and the relative hardness of quantile, the VaR value of this portfolio equals to the product of the standard deviation of the yield rate of portfolio and the quantile in the corresponding confidence level.9D5
>
]
@
]
The VaR value with holding period t is:
9D5
]
W
Therefore, the VaR can be easily calculated in the normal distribution hypothesis as long as we know the fluctuation rate of the yield rate in the holding period. The normal distribution VaR is relatively easy to be calculated, and the assets risk may be presented using the quantitative currency price, making it convenient for regular investors to control the risk. It became popular once it was released. But the normal distribution VaR is only applicable for the rough management of assets risks.
2 GARCH model
In reality, the yield rate of futures has a “tipping peak and thick tail”feature and always disagrees with the normal distribution. The yield rate of futures is a kind of heteroscedasticity sequence in conditional distribution with the “tipping peak and thick tail”feature, which makes it hard to be described by the random walk model of normal distribution. So introducting the VaR method of ARCH model can fit the features of those financial data in a better way. In the actual application, to reach a better fitting effect, we often need the lag order of a larger error term, which will increase the number of parameters to be estimated and reduce the efficiency of parameters estimation. For that, the GARCH model is introduced. Compared to ARCH (p) model, the GARCH (p,q) model has many advantages, for example, q number of auto-regression items are added in this model, and we may use the low-order GARCH model to represent the high-order ARCH model, thus to solve the inherent features of AR CH model, greatly reduce the number of parameters to be estimated and increase the accuracy.
3 Data selection and statistical inspection
transaction, the open interest and transaction volume will be jointly used to judge a most liquid contract. Statistically, some natures of the price sequence, such as non-stability, makes the model calculation harder. By comparison, the price change sequence and returen sequence have a better statistical nature.
(1) Yield rate calculation. It is generally calculated according to the current market price, par value, coupon rate and the time from the expiry date. This article uses the formulas in Excel to calculate the daily yield rate based on the daily data.
5
W
OQ
3
WOQ
3
Wwhere
r
t means the daily yield rate at tth day;p
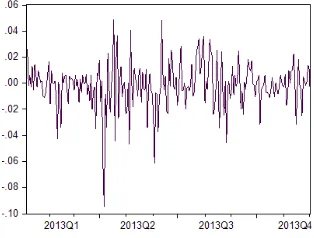
t is the closing price at tth day. The sequence chart of yield rate is as shown in Figure1: [image:3.482.171.328.208.327.2]
Figure 1.The sequence chart of yield rate
(2) Inspection of data normality the distribution of time sequence of daily yield rate is very important to calculate the VaR, and the distribution feature of time sequence depends largely on the model selection. In the VaR method, we generally assume the yield rate of financial assets complies with normal distribution, so it is necessary to inspect the normality of yield rate, and it's also one of the important methods to assess the efficiency of VaR model.
a. First, we used software to draw a distribution histogram of yield rate as shown in Figure 2, where we could see the yield rate has similar features as the normal distribution. Then an inspection would follow.
Figure 2.Descriptive statistics of time sequence of daily yield rate for the silver futures.
b. There are many methods to inspect the normal distribution, and the simplest one will be the inspection of skewness and kurtosis. The skewness and kurtosis of normal distribution equals respectively to 0 and 3. The skewness of all the symmetrical distribution is 0. The distribution curve with skewness not equal to 0 is inclined, and the kurtosis of thick tail distribution is over 3.
[image:3.482.112.371.442.556.2]c. Use matlab to conduct J-Btest inspection and the result is as follows:
Table 1. J-Btest of the time sequence RAg
Variable h p Value of Jbstat Value of Cv
RAg 1 0 184.9894 5.9915
As a test result, at significance level 0.05, h=1 for the silver, indicating the daily return of silver is not compliant with normal distribution. P value is a probability when the hypothesis would be accepted. If p value is closer to 0, we can refuse the normal distribution to be the original hypothesis.
(3) Inspection of data stability. Use unit root method to inspect the stability of time sequence. Through ADF inspection of time sequence of daily yield rate for the silver futures, the result is obtained as follows:
Table 2. Unit root inspection of the time sequence RAg
Varia ble
ADF Count
5% Critical value
1% Critical value
AIC SC
Inspection method (c, t, k)
Conclusion
Horizontal inspection result
RAgt -13.5199 -1.9422 -2.5748 -5.2504 -5.2357 (c, 0, 0) Stable
Eviews software is used in the above inspection. As shown in Form 2, through the horizontal unit root inspection, the time sequence for the silver is stable.
(4) Establish a GARCH model. As shown from above, R sequence has a certain accumulative effect which GRACH model can fit well, so we establish a GARCH model.
Estimate the RAg with GARCH (1,1) normal distribution model, and we get the following three sets of mean and variance equations after regression:
Mean equation:
5$J
W5$J
WH
WVariance equation
WH
WW
According to the obtained equations, we calculate the estimated value of conditional variance, extract its root to obtain the estimated value of conditional standard deviation, use the formula
1
Z
tP
tVaR
to calculate the daily value of VaR, and select0
.
05
andZ
1
.
65
there of.(5) Calculation of VaR value for futures income and inspection of its result. According to the obtained conditional variance equations, we calculate the estimated value of conditional variance, extract its root to obtain the estimated value of conditional standard deviation, use the formula
1
Z
tP
tVaR
to calculate the daily value of VaR, and select andZ
1
.
65
thereof. As a result, the VaR value of silver is: 188.80 yuan/kg.
Table 3. Inspection of VaR value for futures income
Number of time sequence
Expected days of failure
Actual days of
failure Frequency of failure
Silver 238 12 25 10.5%
From the inspection, we can see the failure frequency of VaR risk management for the silver futures in the 95% of confidence level is 10.5%. It means GARCH-VaR can be used to efficiently indicate the risks in the futures market.
The result estimated by GARCH-VaR model can quantize the risks various financial derivatives and portfolio face to make the market participators directly determine the risk situation that the position of held assets face. Many participators in the Chinese futures market can use GARCH-VaR model to estimate the possible loss in the transaction process, and the intermediate institution and supervisory department can also take it as a basis to adjust the guarantee level and alter the specific supervisory rules. For example, if the upcoming loss may be significant after analyzing the estimated result of VaR, the futures company and exchange shall appropriately increase the guarantee level to prevent the breaching risk from happening; or if the loss may be little according to the analysis on the estimated result, they may properly reduce the guarantee level to keep the guarantee level and risk in a dynamic balanced status.
4 Stress testing for silver main contract
Stress Testing means to put a financial institution or assets portfolio in a particular (subjectively imagined) extreme market conditions, for example, we imagine the market interest rate suddenly rises by 100 basic points, or the exchange rate of some currency is depreciated suddenly by 30%, or the stock index in the securities market reduces sharply by 10%, or other abnormal market change. In such case, it tests whether the financial institution or assets portfolio can withstand such sudden changes of market as great and abrupt changes in the key market variables. The procedure of this Stress Testing includes three steps:
(1). Risk identification stage. This is the first stage of Stress Testing. Identified by the practical experience and current reference, the risks in futures market include systematic and non-systematic risk. Then, some extreme scenarios will be constructed to measure the risks in futures market.
(2). Construct a scenario Through statistical analysis, the maximum daily increase of silver price during the whole year of 2013 was 4.76%, the maximum daily decrease was -9.91% and average increase and decrease were respectively 1.08% and -1.33%. The Stress Testing here will mainly inspect whether the scale of customer deposit of the settlement system in the exchange can withstand the shock from the risks and satisfy the security requirement of the exchange in an extreme condition.
Table 4. Price fluctuations in an extreme condition
Maximum decrease % (3 days) Maximum increase % (3 days) Silver -9.91, -6.39, -6.34 4.76, 4.66, 3.99
Note: calculated according to the yield rate of daily closing price
The maximum price fluctuation in a single day is calculated according to the daily settlement price in the exchange, and they are discrete rather than continuous. When we set a scenario, we assume there’s an extreme and continuous condition.
[image:5.482.74.408.531.572.2]limits. In 2013, the amplitude of three silver daily limits were respectively 6%, 9% and 12%. So the above transaction is within the normality. According to Table 4, the extreme condition for either a single or continuous days is within normality and the scope of daily limits specified by the exchange, and the scale of customer deposit can completely cover the loss induced by the increase and decrease of the price.
Table 5. VaR value for each silver contract
Unit of the contract Unit VaR VaR value for the contract
Silver 15kg/lot 188.80 yuan/kg 2,832 yuan/lot
Note: VaR value in a confidence level below 95%
From the above research, we can see that, according to the analysis on VaR, the risk value possibly produced in the confidence level of 95% also lies in the scope acceptable to the client, and the client guarantee can completely compensate for the loss induced by the price increase and decrease, so it will not influence the stable transaction in the futures market.
References
1. Li, C.Z., Li, W.L., Jiang, T.J. Research on the Risk Rate in Futures Market and Its Application, Mathematical Statistics and Management, 2000.
2. Xu, G.X., Quantity Limit of Guarantee in Futures Market and Daily Limits and Its Empirical Research, Statistical Research, 1999.
3. Li., Y.Z., Li, G.Z. Research on the Minimum Guarantee Rate and Maximum Open Interest in Futures Transaction, Journal of Central South Industrial University, 2000.
4. Xiao, C. Systematic Research on the Risk Control Rule and System of Transaction in CME GROUP, Reflection on the Development of Chinese Futures Market, China Financial & Economic Publishing House, 2012(11).
5. Hou, J. Research on the Guarantee Setting of Chinese Futures Market, Tianjin University Press, 2012(6).
6. Liu, Q.F., Research on the Fluctuation and Risk Control in Chinese Futures Market, Shanghai Financial & Economic University Publishing House, 2007(10).
7. Peter Norman, translator: Liang, W.L., global expert in risk control: Central Counter Party Liquidation, China Financial Publishing House, 2013.