International Journal of Innovative Technology and Exploring Engineering (IJITEE) ISSN: 2278-3075, Volume-8 Issue-8S2, June 2019
Convenience features and performances are required to meet the diverse and sophisticated requirements of consumers including technological advances. We classified the seating positions into the normal seating typically preferred by the driver, right sitting, and lying seating position through subjective evaluation, and tested with the same person depending on the different seating positions. For the test equipment, constant temperature and humidity chamber were used to reproduce the environmental conditions. As a result, it was found that the driver’s sitting position affects the flow loss. The average temperature was less than Cush 0.7℃/Back 0.3℃, and the normal sitting position showed relatively high performance. Consequently, it was confirmed that the seat surface temperature with no driver was influenced by the ambient temperature of the chamber even when the ventilation system was turned on.
Keywords: Body pressure Distribution, Body Pressure Ratio, Vehicle seat, Ventilation system, Thermal Electronic Device
I. INTRODUCTION
The car seat for the driver plays a crucial role in providing basic safety and convenience [1]. Convenience features and performances are required to meet the diverse and sophisticated requirements of consumers including technological advances [2-3]. Recent technologies for seats are being developed focused on human-friendly products which apply the artificial intelligence or health care functions. The safety of the automobile is secured through the electronic control [4]. The research development of the enhancement for the convenience function and the emotional quality are being carried out. The functions of the car seat are changing from a manual method, which the driver operates manually, to a powerful method driven by the motors [5][6]. The power seat also tends to be applied to subcompact cars and compact cars. It is applied to the rear seats as well as the front seats [7]. Memory seat functions, that automatically adjusting the sitting position to the driver's setting for maximum comfort, are also being applied. Apart from the heater and the air conditioning function of the automobile, embedded heating coil or ventilation device is applied to the seat in accordance with the seasons [8][9]. The ventilation function, which is in not only to luxury cars but also to
Revised Manuscript Received on May 22, 2019.
Kyungtae Lee, Researcher, Department of Mechanical Engineering, Graduate School, Kongju National University, Chungnam, 31080, Korea
Dooseuk Choi, Professor, Division of Mechanical & Automotive Engineering, Kongju National University, Chungnam, 31080, Korea
medium/compact vehicles, is also attracting attention since it maintains comfortable temperature for drivers [10]. Ultimately, in this comparative study, we are trying to check the ventilation flow loss according to the seating position of the driver whilst the structural part or performance of the seat is set to the same condition for the flow loss of the ventilation performance.
II. TESTEQUIPMENTANDMETHOD A. Body Pressure Test
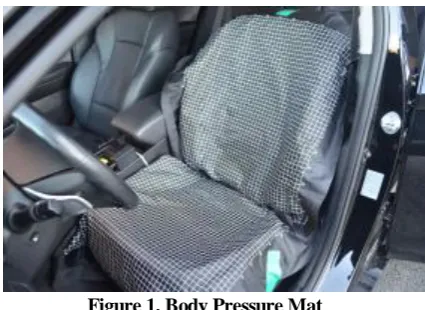
[image:1.595.324.537.508.663.2]A typical seating position preferred by the driver was classified through subjective assessment as normal on seating, A/rest on seating, and lay down on seating. In order to confirm the tendency of applied driver's weight to the seat, the body pressure measurement test was carried out based on the three classified preferred sitting positions. From the measured pressure data, it was possible to confirm the extent which the driver deviates from the position of the ventilation holes when seated. The test was carried out using the same seat and same tester who is 75 kg man at the height of 177 cm. As shown in Fig. 1, the body pressure mat was installed and measured after reenacting the classified three seating positions.
Figure 1. Body Pressure Mat B. Ventilation Performance Test
A difference in load applied to the seat cushion and the bag may occur depending on the driver's preferred seating position and a ventilation performance test was conducted in order to check the flow loss accordingly. The ventilation system used in
this comparative study uses a blower fan to suck in the air inside the vehicle and
Comparative Study on the Ventilation Flow Loss
and Influence according to Seating Position in
Car Seat
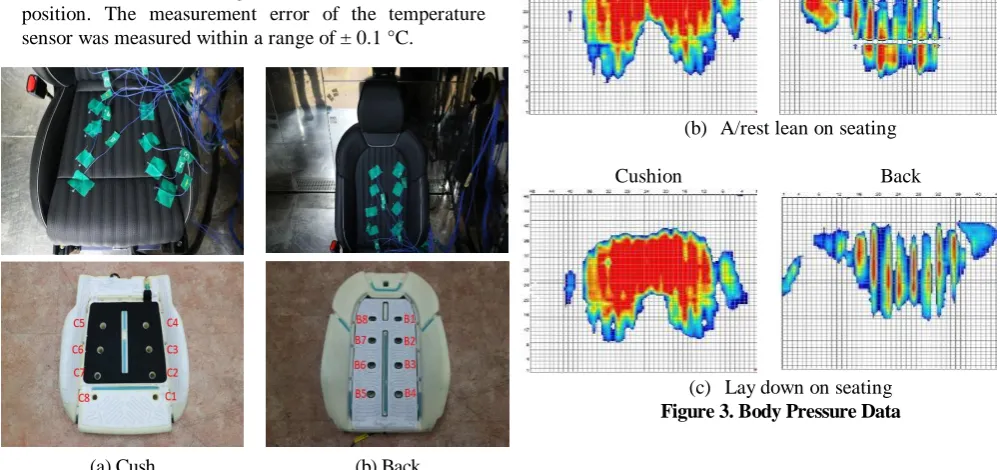
blow it into the seat cushion and the back surface through the duct. Data were measured every 1 second. Leather material was used for testing seat’s coverage. Seat position setting for Slide and Height were both middle and Recliner was positioned as the design standard. As shown in Fig 2. eight temperature sensors were attached to each Cush and Back on coverage surface of ventilation holes position. The measurement error of the temperature sensor was measured within a range of ± 0.1 °C.
[image:2.595.41.540.134.369.2](a) Cush (b) Back
Figure 2. Attached Temperature Sensor Position III. RESULTS AND DISCUSSION
A. Body Pressure Test
Fig. 3 is the body pressure distribution data measured by reproducing the classified preferred sitting position. The body pressure was measured according to the weight applied to the cushion and back according to the driver's seating position. As a result of the measured data, it was confirmed that Normal on Seating was uniformly distributed in all positions of the ventilation holes. Weight was also evenly distributed on A/rest lean on seating, but with leaning to the right, weight for each CUSH and BACK were different. Lay down on seating position was confirmed that the sensor positions of the seat Cush end parts C4, C5 and the Back-bottom parts B4, B5 were distributed out of the ventilation holes. Since the driver's feeling of cool temperature is evaluated by the passenger's skin temperature and the amount of decrease in humidity with respect to the seat on which the flow rate is emitted and the contact surface of the driver, the driver's seating posture may affect the ventilation performance.
Cushion Back
(a) Normal on seating
Cushion Back
(b) A/rest lean on seating
Cushion Back
(c) Lay down on seating
Figure 3. Body Pressure Data
[image:2.595.45.315.165.372.2]B. Ventilation Performance Test
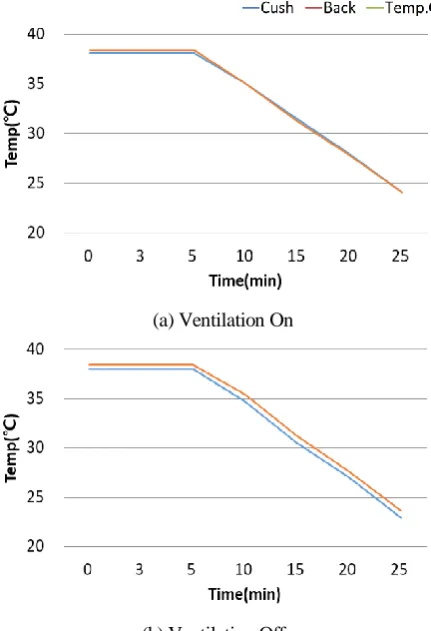
[image:2.595.45.554.634.826.2]Table 1 shows the temperature change data according to the presence or absence of the power supply of the ventilation system measured by the eight temperature sensors attached to the Cush/Back without the driver sitting, and Fig. 4 shows the graph. The x-axis shows time and the y-axis shows temperature. Since the temperature sensor is attached to the seat covering surface, it was necessary to obtain reference data as to when the tester leaves the ventilation holes during the seating. The test was conducted under the condition that the seat was exposed for three hours at the same room temperature of 38 °C, and the tester was not seated. First test was conducted while the ventilation cooling system was turned on and second test was conducted without turning on the power. After the test, it was confirmed how the ambient temperature and the operation of the ventilation system affected the temperature change of the measured sensor.
Table 1. Ventilation On / Off Data
Unit : [℃]
Part On Off
Cush Back Cush Back
5 min 38.1 38.4 38.0 38.4
10 min 35.0 35.0 34.7 35.4
15 min 31.4 31.2 30.5 31.2
20 min 27.9 27.8 27.0 27.6
25 min 24.1 24.1 22.9 23.6
International Journal of Innovative Technology and Exploring Engineering (IJITEE) ISSN: 2278-3075, Volume-8 Issue-8S2, June 2019
temperature measured by the sensor showed a slight difference between Cush 0.68 ℃ and Back 0.3 ℃. This is caused by the ventilation system which uses the blower fan to suck indoor air, and it is considered that it cannot reduce the surface temperature of the seat and just changes the air flow. In conclusion, it has been confirmed that the ambient temperature has a high influence on the seat surface temperature change.
(a) Ventilation On
[image:3.595.62.278.171.487.2](b) Ventilation Off
Figure 4. Ventilation On / Off Data
Table 2 shows the average ventilation performance data measured by reproducing the three preferred positions, and Fig. 5 shows the graph. X-axis shows the measuring time and Y-axis shows temperature. The general tendency by checking the measured data every five minutes, the average sitting temperature out of the three sitting conditions was lower than Cush 0.7 ° C / Back 0.3 ° C. This data is averaged over the ventilation holes, including data subject to ambient temperature without being affected by the body temperature of the tester.
In conclusion, the normal on seating is temperature measured when tester’s body was evenly distributed, and it seems to be influenced highly by human body temperature. A/rest Lean on seating shows relatively even distribution of body pressure but has tendency that more weight is added to the right. The influence of the flow supply was confirmed by the degree of weight applied to the seat. In the case of Lay down on seating, it was confirmed that the position of the Cush end C4, C5 and Back bottom B4, B5 of the cushion were distributed outside the ventilation holes when tester was seated. This
is due to the fact that temperature change at the off-site is influenced by the ambient temperature and since this may affect the average data, the analysis was conducted separately.
Table 2. Ventilation Performance Average Data
Unit : [℃]
Part Normal on A/rest lean on Lay down on
Cush Back Cush Back Cush Back
5 min 34.4 37.4 35.9 38.0 36.4 37.8
10 min 31.8 32.7 32.5 32.9 32.8 33.0
15 min 30.5 31.3 31.0 31.5 30.9 31.6
20 min 28.5 29.5 29.0 30.1 28.6 30.1
25 min 26.3 27.7 26.7 28.1 26.0 26.5
(a) Normal On Seating
(b) A/rest Lean On Seating
[image:3.595.309.546.244.830.2](c)Lay Down On Seating
C. Performance Comparison of No Seating and Normal on Seating
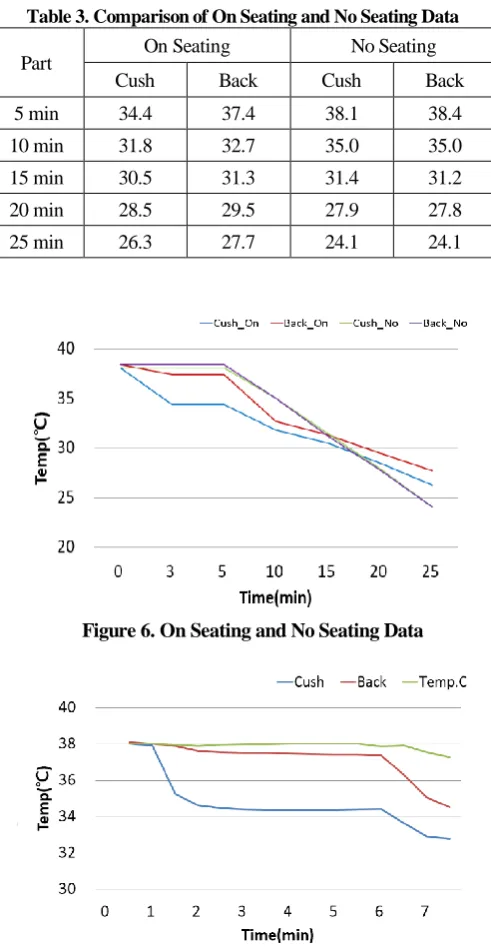
Table 3 shows comparative data of normal on-seating in which the driver’s weight is evenly distributed, and when driver is not seated in order to check the effects of human body temperature on the seat surface. Fig 6. shows graphs, X-axis shows measuring time and Y-axis shows temperature. In this result, the influence of human body temperature and ambient temperature on ventilation cooling performance was analyzed. As shown in Fig. 7, the average temperature measured at the surface of the seat when tester was seated for 5 minutes was found to be lowered by Cush 3.4℃ / Back 1.7℃ at the ambient temperature of 38 ℃. This seems caused by the influence of the body temperature at the same time the test is seated, even when the ventilation system is not switched on.
Table 3. Comparison of On Seating and No Seating Data
Part On Seating No Seating
Cush Back Cush Back
5 min 34.4 37.4 38.1 38.4
10 min 31.8 32.7 35.0 35.0
15 min 30.5 31.3 31.4 31.2
20 min 28.5 29.5 27.9 27.8
[image:4.595.47.293.302.776.2]25 min 26.3 27.7 24.1 24.1
Figure 6. On Seating and No Seating Data
Figure 7. On Seating Data (During 5 min)
IV. CONCLUSION
In this comparative study, the ventilation flow loss caused by driver’s seat occupancy was examined and it led to following conclusions.
The most preferred sitting position was A / rest lean on seating, followed by normal on seating and lay down on seating through the subjective testing by the tester. For each seating position, after measuring the temperature drop after 25 minutes of ventilation test at ambient temperature of 38 ℃, the normal seating position showed relatively high performance with Cush 11.7 ℃ / Back 10.3 ℃ changed. In order to confirm the influence of the human body temperature or the ambient temperature on the seat surface, the data of the normal sitting position and the position without the driver were compared. As a result, it was confirmed that the seat surface temperature with no driver was influenced by the ambient temperature of the chamber even when the ventilation system was turned on. In addition, when checking the influence of body temperature while tester is seated, seat surface temperature was not dropped affected by body temperature even though ambient temperature was dropped after ventilation system was operating for a while. The influence of the difference in weight distribution on the seat cushion or back on the ventilation performance was checked. As a result, in case of A / rest lean on seating, the weight distribution on both sides was different according to the sitting weight tilted to the right. The average temperature measured at the right side was higher than that of the left part by Cush 1.4 ℃ / Back 0.6 ℃, and it was confirmed that the load distribution affected the Cush than Back.
ACKNOWLEDGMENT
This work(Grants No. S2602082) was supported by Business for Cooperative R&D between Industry, Academy, and Research Institute funded Korea Small and Medium Business Administration in 2018.
REFERENCES
1. J.S. Solaz, R. Porcar, M. Lopez and B. Mateo, “A Methodological Approach to the Determination of the Cause Relations in Automotive Seating Comfort,” SAE Paper No. 2005-05-1009.
2. S.Park, “Auto Journal, KSEA, Vol. 31, No 4, pp. 26-33, 2009. 3. D.Y. Jang “A study on seat in automotive air-conditioning ventilation
control for high-performance, low noise optimal design alternatives.” Department of Electronic Engineering, Graduate School, Hanyang University 2014.
4. H.S. Choi, Y.S. Kim, C.H. Jeon, S.K. Yun, “Hot and Cool Temperature Control of the Car-Seat Utilizing the Thermoelectric Device.” Vol. 28. No.5, pp. 518-525, 2004.
5. Tulin Gunduz Cengiz. Fatih C. Babalik, “An on the road experiment into the thermal comfort of car seats.”, Applied Ergonomics 38. pp. 337-347, 2007.
International Journal of Innovative Technology and Exploring Engineering (IJITEE) ISSN: 2278-3075, Volume-8 Issue-8S2, June 2019
1092~1099, 2007.
7. Y.M. Kim, S.M. Choi and S. J. Lee “Permeability Evaluation for Ventilation and Climate Control
seat.” KSAE, pp. 2030-2036, 2013.
8. Ned Wolfe, Xiaoxia Mu, Linjie Huang and Prasad Kadle,
“Cooling with Augmented Heated and Cooled Seats.” SAE 2007-01-1993, 2007
9. Y.M. Kim, S.M. Choi, S.J. Lee, “Permeability Evaluation and Climate Control Seat.” KSAE fall Conference pp. 2030-2036, 2013. 10. H. H Lee, T. K Kim, G. J. Lee “Estimation of Air Flow Rate in
Automotive Ventilated Seat.” JKAIS Vol. 17, No. 12 pp. 34-40, 2016.
AUTHORSPROFILE
Kyungtae Lee is a Ph. D. candidate at Department of Mechanical Engineering, Graduate School, Kongju National University, Cheonan, Korea. His research interests are focused in Vehicle seat test, Human body Engineering, Vehicle Seat Comfort, Control Engineering and Mechanical Engineering.