DYNAMICS OF NITROGEN AND CARBON CYCLING
ASSOCIATED WITH GREENHOUSE GAS
EMISSIONS IN THE SALT-AFFECTED SOILS
by
DANG DUY MINH
Submitted in fulfilment of the requirements for the degree of Doctor of Philosophy
Candidate's Declaration
This thesis contains no material which has been accepted for the award of any other degree or diploma in any university. To the best of the author’s knowledge, it contains no material previously published or written by another person, except where due reference is made in the text.
Acknowledgements
First and foremost, I sincerely thank my primary supervisor, Dr Ben Macdonald, for his invaluable guidance and support throughout my study in for. Ben has always given me valuable feedback, comments and suggestions from the initial development of the work to the manuscript preparation. Ben has helped me understand how to achieve better quality work in scientific studies. His scientific knowledge and valuable advice have been invaluable for my scientific pathway in the future.
I am most grateful to Dr Craig Strong for accepting the position of chairman of my supervisory panel. The good advice and support from Dr Strong has been valuable on an academic level, for which I am greatly thankful. I would also like to thank Professor Ian White and Dr Soeren Warneke for being co-supervisors for my PhD study and for their useful comments and feedback.
Special thanks to Dr Andrew Bissett from the molecular laboratory in CSIRO-Crace for his suggestions and guidance throughout my work on genetics in his laboratory.
Thank you to CSIRO research technicians, Dr Shamsul Hoque and Mrs. Seija Tuomi from CSIRO - Agriculture & Food (Canberra) for all your lab assistance when I performed the experiments and sample analyses in the lab.
I would like to acknowledge Ms. Amy Chen for her administrative help in The Fenner School of Environment and Society. I also thank Ms Gina Abarquez, Rozana Muir, and Elaine Ee for their special help from the Australia Awards Liaison team at ANU.
I appreciate Dr Susanne Holzknecht formerly of the Fenner School for copy-editing my thesis.
I am really thankful to Australia Awards John Allwright Fellowship for financial support. Thanks to this support, I had the opportunity to achieve a successful study program and to enjoy a stimulating time in Australia.
Abstract
Salinity is one of the most severe environmental factors limiting the productivity of aquaculture and agriculture. The worldwide area of salt-affected soils is predicted to become even more widespread in the future due to climate change and sea-level rise. However, the soil nitrogen and carbon dynamics associated with soil-induced gas emissions under salinity are not well understood. The main objective of this study was to investigate changes of soil carbon and nitrogen cycling associated with greenhouse gas emissions, plant growth and fertilizer recovery under effects of different salinity levels. This study addressed research issues with the following main objectives. The main aim of the study reported in Chapter 2 was to analyse greenhouse gas production from different soils with different times of lid closure and to assess the effects of different activation time on gas emissions from soils. The results showed that the 20-min sampling interval at the closure time of maximum 80 minutes had good results with less variance either for soil types or monitored gases. Lengthening activation times for the incubation study may affect emission rates due to differences in soil properties. The study in Chapter 3 examined the effects of salinity and additional sources of nitrogen and carbon on soil nitrogen and carbon cycling in an acid sulphate soil (ASS) and an alluvial soil. The findings of this study demonstrated that salinity significantly decreased N2O
emissions from the acid sulphate soil but did not affect emissions from the alluvial soil. The addition of glucose and nitrate enhanced N2O production in both salt-affected soils.
This investigation indicated that salinity altered the carbon and nitrogen cycles in the acid sulphate soil; it recommends that future fertiliser and crop management will need to account for the changed nutrient cycling caused by saline water intrusion and climate change. The objective of the study reported in Chapter 4 was to identify a relationship between induced-soil gas emissions and the abundance of denitrification genes in a salt-affected soil. Increased salinity caused a decrease in both flux and cumulation of the N2O-N production and soil respiration from the incubated soil. The study result also
showed that elevated salinity increased the denitrifying genes in the incubated acid sulphate soil. Abundance of the nir genes was usually high between the first and second week of incubation, while number of copies of the nosZ gene were significantly low at those times. Another study presented in Chapter 5 investigated changes in soil properties, the dynamics of N and its effects on rice growth and yield under different salinity levels by using a 15N label fertilizer technique. Flooding soils for two weeks by
Table of Contents
Candidate's Declaration ... i
Acknowledgements ... ii
Abstract ... iv
Table of Contents ... vi
List of Figures ... x
List of Tables ... xiv
List of Plates ... xv
List of Acronyms and Abbreviations ... xvi
Chapter 1: INTRODUCTION AND LITERATURE REVIEW ... 1
1.1 Introduction ... 1
1.2 Literature review ... 3
1.2.1 Salt affected soils ... 3
1.2.2 Effects of salinity on soil nitrogen cycling ... 4
1.2.3 Salinity, soil microbial activity and denitrification ... 5
1.2.4 Salinity effects on soil carbon cycling ... 6
1.2.5 Salinity stress and plant/crop growth ... 7
1.2.6 Greenhouse gas emissions induced by agricultural soils ... 8
1.2.7 Laboratory incubation and lid closure time for assessing GHG emissions from soil ... 9
1.2.8 Current research on salinity effects and soil-induced gas emissions in the Mekong Delta ... 10
1.3 Study rationale and thesis outline ... 11
1.4 Research questions and objectives of study ... 13
Chapter 2: DIFFERENT LID CLOSURE TIMES ALTER FLUXES OF GREENHOUSE GASES FROM INCUBATED SOILS ... 16
Abstract ... 16
2.1 Introduction ... 16
2.2 Materials and methods ... 18
2.2.1 Sampling sites and soil collection... 18
2.2.2 Soil extraction and analysis ... 19
2.2.3 Incubation experiment for greenhouse gas measurement ... 19
2.2.4 Data calculation and statistical analysis ... 20
2.3 Results ... 21
2.3.2 Effects of different activation time (Experiment 2) on fluxes of gas emissions
... 27
2.4 Discussion ... 32
2.4.1 Effects of closure time on soil gas fluxes ... 32
2.4.2 Effect of soil activation on gas emissions ... 32
2.4.3 Soil properties effects on gas fluxes ... 33
2.5 Conclusion ... 35
Chapter 3: AVAILABLE CARBON AND NITRATE INCREASE GREENHOUSE GAS EMISSIONS FROM SOILS AFFECTED BY SALINITY ... 38
Abstract ... 38
3.1 Introduction ... 38
3.2 Materials and methods ... 41
3.2.1 Description of sampling site ... 41
3.2.2 Soil and saline water sample collection ... 42
3.2.3 Soil extraction and analyses ... 42
3.2.4 Incubation experiment for measurement of greenhouse gases ... 42
3.2.5 Data calculation and statistical analyses ... 43
3.3 Results ... 44
3.3.1 Properties of soil samples ... 44
3.3.2 Production of N2O ... 45
3.3.3 Emission rate of N2O-N from incubated soils ... 48
3.3.4 Cumulative CO2 and CH4 emission from soil during the 4-week incubation ... 49
3.3.5 Methane and CO2 fluxes from soil during the 4-week incubation ... 52
3.4 Discussion ... 53
3.4.1 Effect of salinity on soil nitrogen and carbon processes ... 53
3.4.2 Effect of carbon and nitrogen on gas production ... 54
3.4.3 Implications ... 55
3.5 Conclusions ... 56
Acknowledgement ... 56
Chapter 4: QUANTIFYING GAS EMISSIONS AND DENITRIFYING GENES IN A SALT-AFFECTED SOIL ... 59
Abstract ... 59
4.1 Introduction ... 59
4.2 Materials and methods ... 61
4.2.1 Sampling sites and soil collection... 61
4.2.3 Incubation experiment for measurement of greenhouse gases ... 62
4.2.4 Gas sampling and analysis ... 63
4.2.5 Soil microbial gene analysis ... 63
4.2.6 Data calculation and statistical analysis ... 65
4.3 Results ... 66
4.3.1 Soil properties ... 66
4.3.2 Gas fluxes ... 67
4.3.3 Soil microbial genes ... 71
4.4 Discussion ... 75
4.4.1 Effects of salinity on soil gas fluxes ... 75
4.4.2 Effect of salinity on soil microbial genes ... 76
5. Conclusion ... 77
Acknowledgements ... 78
Chapter 5: SALINITY EFFECTS ON SOIL CHARACTERISTICS, NITROGEN RECOVERY AND RICE GROWTH ON TWO PADDY SOILS IN THE MEKONG DELTA ... 81
Abstract ... 81
5.1. Introduction ... 81
5.2 Materials and methods ... 83
5.2.1 Soil and saline water collection ... 83
5.2.2 Experiment design ... 86
5.2.3 Data collection and variables measurement ... 87
5.2.4 Data statistical analysis ... 87
5.3 Results ... 88
5.3.1 Soil and water chemical attributes at rice planting ... 88
5.3.2 Effects of salinity on rice growth performance, yield and yield components ... 91
5.3.3 Nitrogen recovery efficiency ... 95
5.4 Discussion ... 95
5.4.1 Effects of salinity on soil properties and nitrogen recovery of rice ... 95
5.4.2 Effect of salinity and soils on rice physiology ... 97
5.4.3 Effects of salinity on the rice yields and components ... 97
5.5 Conclusions ... 98
Acknowledgement ... 98
Chapter 6: CONCLUSION AND FUTURE WORK ... 99
6.1 Synthesis and conclusion ... 99
Appendix 1: Linear regression for N2O fluxes in the ASS (a), Red Dermosol (b), and
Vertosol (c). ... 106
List of Figures
Figure 1.1 Effects of salinity and sodicity on plant growth. ... 7 Figure 1.2 Relative crop yield in response to various salinity levels and degree of salt
tolerance. ... 8 Figure 2.1 Fluxes of N2O from acid sulphate (a), Red Dermosol (b) and Vertosol (c) soils
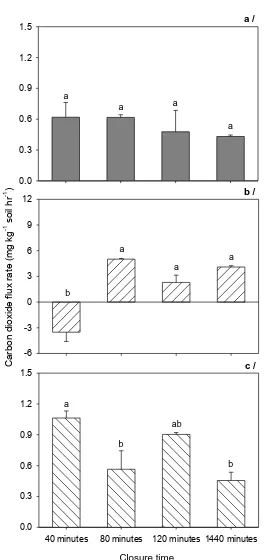
for closure times 40, 80, 120 and 1440min. Error bars represent standard error and different letters on the bars show significant difference at P < 0.05, n = 3. ... 22 Figure 2.2 Fluxes of CO2 measured from treatments for closure times 40, 80, 120 and
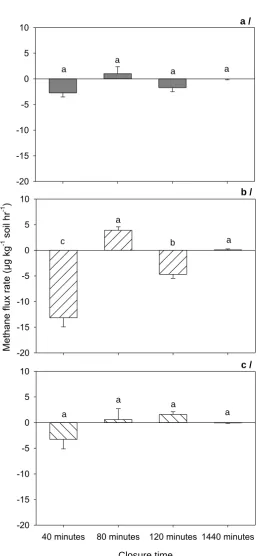
1440min in acid sulphate (a), Red Dermosol (b) and Vertosol (c) soils. Error bars represent standard error and different letters on the bars show significant difference at P < 0.05, n = 3. ... 24 Figure 2.3 Fluxes of CH4 in acid sulphate (a), Red Dermosol (b) and Vertosol (c) soils
for closure times 40, 80, 120 and 1440min. Error bars represent standard error and different letters on the bars show significant difference at P < 0.05, n = 3. ... 26 Figure 2.4 N2O fluxes at 10-min intervals from different treatments of activation time (i.e.
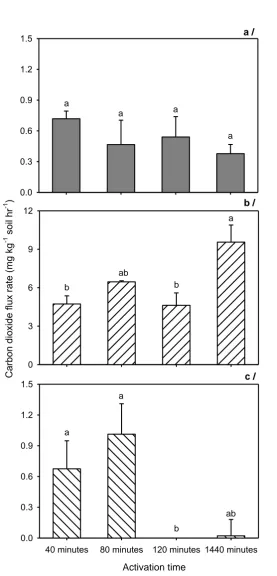
different durations of soil activation) with the addition of glucose and nitrate. Fluxes of N2O from acid sulphate (a), Red Dermosol (b) and Vertosol (c) soils. Error bars represent standard errors and different letters on the bars show significant difference at P < 0.05, n = 3. ... 28 Figure 2.5 Fluxes of CO2 sampled at 10-min intervals from different treatments of
activation time (i.e. different durations of soil activation) with the addition of glucose and nitrate. Fluxes of CO2 are shown for acid sulphate (a), Red
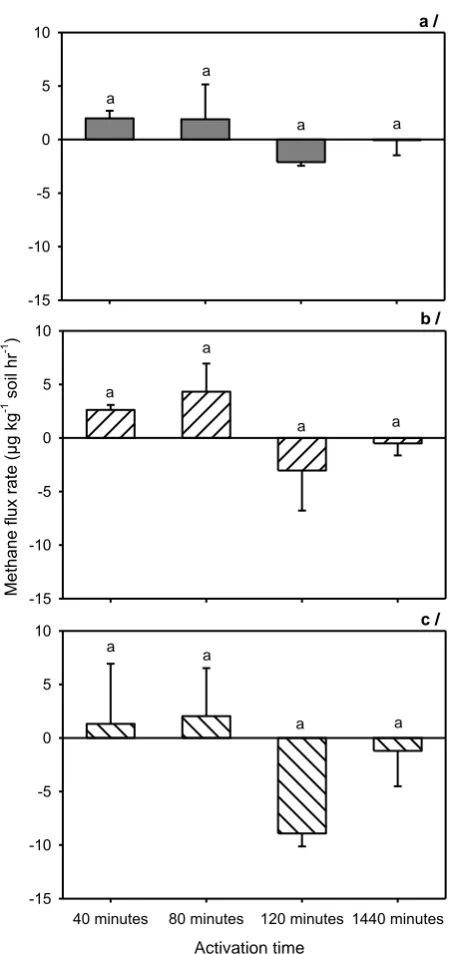
Dermosol (b) and Vertosol (c) soils. Error bars represent standard error and different letters on the bars show significant difference at P < 0.05, n = 3. . 30 Figure 2.6 Effects of different activation times (i.e. different durations of soil activation)
with the addition of glucose and nitrate on fluxes of CH4 in acid sulphate (a),
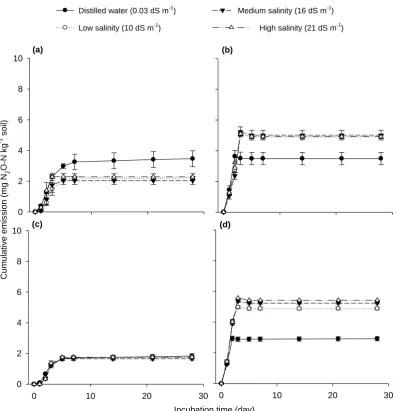
Red Dermosol (b) and Vertosol (c) soils. Error bars represent standard error and different letters on the bars show significant difference at P < 0.05, n = 3. ... 31 Figure 3.1 Cumulative N2O-N emission during four-week incubation of four salinity levels
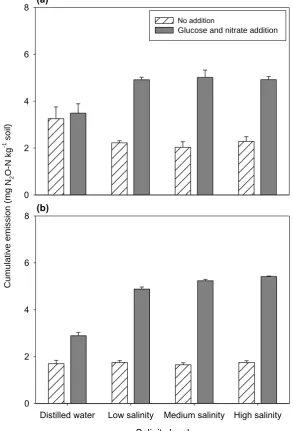
Figure 3.2 Effects of different salinity levels, nutrient addition and soils on total cumulative N2
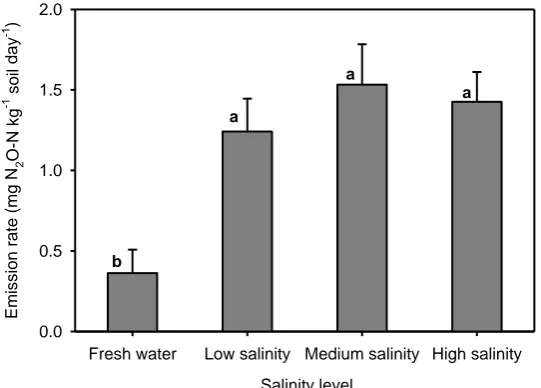
O-N emission in the first-week incubation. Graphs are average emissions on acid sulphate soil (a) and alluvial soil (b). Error bars represent standard errors of means (n = 3). ... 47 Figure 3.3 Fluxes of nitrous oxide emissions from salt-affected soil on the third day of
incubation. Letters on the bars show statistical significances between treatment means and error bars represent standard errors of means (F = 7.095, P < 0.001, n = 12). ... 48 Figure 3.4 Effects of available carbon and nitrogen on the flux of nitrous oxide emission
from salt-affected soil on the third day of the incubation. Error bars indicate standard errors of means (n = 6). ... 48 Figure 3.5 Cumulative CO2 emissions during four-week incubation of four salinity levels
applied to two soils: acid sulphate soil without (a) and with (b) glucose and nitrate addition; alluvial soil without (c) and with both the addition of nutrients. Bars indicate standard errors of means (n=3). ... 50 Figure 3.6 CO2 fluxes during four-week incubation of four salinity levels applied to two
soils: acid sulphate soil without (a) and with (b) glucose and nitrate addition; alluvial soil without (c) and with both the addition of nutrients. Bars indicate standard errors of means (n=3). ... 52 Figure 3.7 Methane fluxes during four-week incubation of four salinity levels applied to
two soils: acid sulphate soil without (a) and with (b) glucose and nitrate addition; alluvial soil without (c) and with both the addition of nutrients. Vertical bars indicate standard errors of means (n=3). ... 53 Figure 4.1 Fluxes of N2O-N emission from soils treated with different salinity during the
three-week incubation. Capped lines are standard errors of means (n = 3), which are not always visible because the standard error is smaller than the symbol. ... 67 Figure 4.2 Cumulative N2O-N emission from soils treated with different salinity during the
three-week incubation. Capped lines are standard errors of means (n = 3), which are not always visible due to the small data set. ... 68 Figure 4.3 Fluxes of CO2-C emission from soils treated with different salinity during the
three-week incubation. Capped lines are standard errors of means (n = 3), which are not always visible because the standard error is smaller than the symbol. ... 69 Figure 4.4 Cumulative CO2-C emission from soils treated with different salinity during the
Figure 4.5 Abundance of nirK gene (copies g-1 dried soil) from soils treated with different
salinity over the three-week incubation. Capped lines are standard errors of means (n = 3), which are not always visible due to the small data set. ... 71 Figure 4.6 Abundance of nirS gene (copies g-1 dried soil) from soils treated with different
salinity over the three-week incubation. Capped lines are standard errors of means (n = 3), which are not always visible due to the small data set. ... 72 Figure 4.7 Abundance of nosZ gene (copies g-1 dried soil) from soils treated with different
salinity over the three-week incubation. Capped lines are standard errors of means (n = 3), which are not always visible due to the small data set. ... 73 Figure 4.8 Linkages between N2O fluxes (mg N2O-N kg-1 soil day-1) and nir / nosZ ratio
as a function of soil salinity over the three-week incubation. Graph (a) presents for the treatment of distilled water; (b) for the treatment of low salinity; (c) for the treatment of medium salinity; and (d) for the treatment of high salinity. Linear regression statistics are reported in text. ... 74 Figure 5.1 Changes of surface water pH (a) and EC (b) in the experiment pots over 90
days after seeding. ASS and Alluvial in the legend mean acid sulphate soil and alluvial soil, respectively. Number and text in legend brackets show different salinity treatments. Data presents mean and standard error of mean (error bar, n = 3). ... 88 Figure 5.2 Total soil N in pots from the 0-10 cm layer of ASS and alluvial soils at the
beginning of the experiment (a) and at harvest (b) and at 10-20 cm for the sampling times (c) and (d), respectively. The presented data are means of total N, and the error bars represent standard errors of means (n = 3). Different letters on bars show a significant difference between means of total soil N. ... 88 Figure 5.3 Soil inorganic nitrogen as a total content of NH4+ - N and NO3- - N (mg kg-1)
over stages of rice growth. The four upper graphs show the results of inorganic nitrogen in soil samples at 0 – 10 cm depth. The lower four graphs show results of inorganic nitrogen in soil samples at 10 – 20 cm depth. Soil nitrate is extremely low (< 0.1 mg kg-1) and invisible on bars. A name of a
treatment includes soil types (ASS and alluvial soils) and salinity level in brackets. The height of a stacked bar presents total ammonium and nitrate nitrogen extracted by KCl 2M in the same treatment (n=3). ... 90 Figure 5.4 Rice height (a), number of tillers per hill (b), and tillers in pots (c) from the
Figure 5.5 Means of number of rice tillers at harvesting time (98 DAS). Different lowercase on bars shows a significant difference in the mean of unproductive tillers. Bars with different capital letters show significant difference in means of productive tillers (P < 0.05) as analysed by two-way ANOVA (n = 3). .... 93 Figure 6.1 An integrated model of the agricultural floodplain undergoing salinity changes.
List of Tables
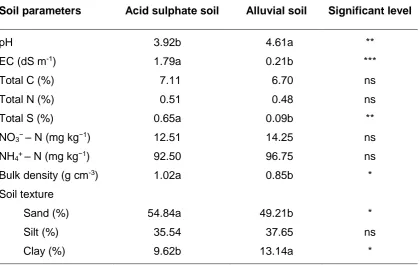
Table 1.1 Global distribution of salt-affected soils (million ha) ... 3 Table 1.2 Generalized classification of salt-affected soils ... 4 Table 2.1 Basic characteristics of incubated soil samples (0 – 10 cm) ... 19 Table 3.1 Characteristics of field soil samples (0 – 15 cm) from the field located in Nowra.
Means in the same row followed by the different letters are significant. For t-test analysis between two soils: (*) P <0.05; (**) P < 0.01; (***) P <0.001; (ns) not significant. ... 45 Table 3.2 Cumulative CH4 emission during four-week incubation of four salinity levels
applied to two soils: acid sulphate soil and alluvial soil without and with addition of carbon and nitrate. Numbers in brackets are standard errors of means. ... 51 Table 4.1 Specific primer sets used for gene amplification in qPCR assays. ... 64 Table 4.2 Characteristics of the experimental sample (0–15 cm). Data are means (n = 3)
followed by standard errors of means. ... 66 Table 5.1 Characteristics of soil samples used in the pot experiment. Different
superscript letters along a row indicate significant differences between means of soil samples based on a one-way ANOVA (P-value < 0.001, n = 3)... 85 Table 5.2 Changes in soil pH and EC in the pot experiment (0 – 10 cm). Values are
means ± standard error, n = 3 per treatment group. Different superscript letters in a column indicate significant differences between treatment groups, according to a two-way ANOVA (p < 0.05). ... 87 Table 5.3. Rice yield and yield components (mean ± standard error of mean) in the pot
experiment. Different letters in a column indicate significant differences between treatments as analysed by two-way ANOVA and the TUKEY test (p < 0.05). ... 94 Table 5.4 Nitrogen recovery and balance (%) in the rice pot experiment at harvesting
List of Plates
Plate 3.1 Acid sulphate soil with a jarosite layer 50 cm below soil surface ... 41 Plate 4.1 Soil with different salinity level was incubated in jars at constant temperature
(25oC). The photo was taken before sampling headspace gas. ... 63
List of Acronyms and Abbreviations
ACIAR Australian Centre for International Agricultural Research
ANCA Automated Nitrogen Carbon Analysis
ANOVA Analysis of variance
ASS Acid sulphate soil
CEC Cation exchange capacity
CH4 Methane gas
CLRRI Cuu Long Delta Rice Research Institute
CLUES Climate Change affecting Land Use in the Mekong Delta: Adaptation of Rice-based Cropping Systems.
CO2 Carbon dioxide gas
DAS Days after seeding
EC Electrical conductivity
ECD Electron capture detector
ECe Electrical conductivity of saturation extract
ESP Exchangeable sodium percentage
FAO Food and Agriculture Organisation
GC Gas chromatograph
GHG Greenhouse gas
HSD Honest significant difference
IPCC Intergovernmental Panel on Climate Change
IRMS Isotope Ratio Mass Spectrometer
MD The Mekong River Delta
MONRE Ministry of Natural Resources and Environment
N2O Nitrous oxide gas
NRE Nitrogen recovery efficiency
PCR Polymerase Chain Reaction
qPCR Quantitative real-time PCR
SAR Sodium adsorption ratio
SLR Sea-level rise
SOM Soil organic matter
US-EPA United States Environmental Protection Agency
Chapter 1: INTRODUCTION AND LITERATURE REVIEW
1.1 Introduction
Climate change, one of the most serious problems facing the world today, will cause increased frequency and intensity of drought and floods, more storms and rising sea levels plus the extinction of species and the loss of whole ecosystems (Truong et al., 2011). An increase in future global temperatures, accelerated melting of ice sheets and glaciers, would cause further sea-level rise (SLR) (Smajgl et al., 2015). Sea-level rise exacerbated by climate change has already begun, severely affecting coasts and river estuaries in low-income countries (Vineis and Khan, 2012). Coastal lowlands less than a metre above sea level will be flooded by the end of the 21st century and delta areas
that are at risk of flooding will increase by 50% (Syvitski et al., 2009; Giosan et al., 2014). Most impacts of climate change will be transferred to human and ecological communities through sea level rise, storms, flooding, and drought (Truong et al., 2011). Sea-level rise will flood and inundate occupied lands much more rapidly and much more extensively and alter hydrology leading to salinization of fresh water aquifers and agricultural land (Oliver-Smith, 2009). Rising sea-levels will also affect natural systems by wetland loss, erosion, saltwater intrusion into surface waters and groundwater and rising water tables (Nicholls and Tol, 2006). Therefore, this issue requires more empirical research that will inform better management of land and water resources in which human communities are adapting to climate change (Truong et al., 2011).
The rise of sea level will cause soil salinization through seawater intrusion into surface water, particularly irrigation water (IPCC, 2007a; Pereira et al., 2015). Seawater is mostly constituted by free ions of sodium (31%) and chloride (55%); the addition of these ions to soil alters the soil chemistry, water holding properties and ultimately plant productivity (Wang and Li, 2013). Saline soils are often recognized by the presence of white salt encrustations on the surface and predominant chlorides and sulphates of Na, Ca, and Mg. Saline soils usually have a saturation paste of pH < 8.2, an electrical conductivity of saturation extracts (ECe) > 4 dS m- 1 at 25°C and a sodium adsorption ratio (SAR) of the
Salinity is one of the most severe environmental factors limiting the productivity of aquaculture and agriculture. For example, changes in salinity in aquatic environments represent major ecological disturbances in tropical fish farming (Ahmadi et al., 2016). In agriculture, most crops are sensitive to salinity due to the effects of the high concentrations of salts in the soil and irrigated water (Pitman and Läuchli, 2002). The growth and development of rice are affected when the soil EC > 3 dS m-1 due to Na+
toxicity. High content of salt in the soil also affects rice yield components and the production of perennial trees such as citrus, amongst the most susceptible of all trees to salt stress (Ahmadi et al., 2016). Crop productivity and production losses caused by salinization have a considerable impact on farm and irrigation system economics (Zinck and Metternicht, 2008). The cost of salinity impact to agriculture is globally estimated be about $US 12 billion per year and profitability loss is expected to increase as soils are continually affected (Ghassemi et al., 1995; Pitman and Läuchli, 2002).
Climate change and sea level rise have recently emerged as serious challenges facing Vietnam’s low-lying aquaculture and agricultural regions. Mekong Delta (MD) communities are located in one of the most globally vulnerable deltas, exposed to the combined effects of rising sea levels, salinity intrusion and an increased frequency of extreme climate events such as tropical storms (Smajgl et al., 2015). Sea level has been predicted to rise by up to 1 m by the end of the 21st century and would inundate 40% of
1.2 Literature review
1.2.1 Salt affected soils
Global distribution of salt-affected soils
Soil salinity and alkalinity problems occur in many regions of the world, with over 900 million hectares of land suffering from salinization and alkalinisation (Table 1.1) (Zinck and Metternicht, 2008; Carrow and Duncan, 2012). Causes of soil salinization include primary or natural salinization that naturally occurs or secondary salinization which is a result of human activities (Duncan et al., 2009).
Table 1.1 Global distribution of salt-affected soils (million ha)
Area Saline soil Sodic soil Total Total (%)
Australasia Asia America Africa Europe
17.6 194.7 77.6 53.5 7.8
340.0 121.9 69.3 26.9 22.9
357.6 316.5 146.9 80.4 30.8
38.4 33.9 15.8 8.6 3.3
World 351.2 581.0 932.2 100.0
Source: Adapted from Carrow and Duncan (2012); and Zinck and Metternicht (2008)
Primary salinization is associated with the accumulation of salts in the soil over long periods from weathering of salt-laden parent materials (Pannell and Ewing, 2006). Intrusion of seawater into soils of coastal lands can result in salt accumulation (Rengasamy, 2010b). Salt movement into the root zone from a naturally high saline water table in coastal swamps or marshes also causes salinization (Carrow and Duncan, 2012). Secondary or human-induced salinization involves human activities such as irrigation and drainage practices. Poor practices of irrigation and drainage in areas with high evaporation rates are the main causes of secondary salinization (Lambers, 2003). Understanding the causes of secondary salinization is important to indicate preventative measures that can minimize adverse effects (Carrow and Duncan, 2012).
Classification and characteristics of salt-affected soils
cations (sodium, calcium, and magnesium) and anions (chloride, sulphate, carbonate, and bicarbonate) in a soil solution (Rengasamy, 2010b). High salt concentration in the soil solution causes low osmotic potential, ion toxicity or ion imbalance leading to adverse effects on soil biota and crop growth (Marschner, 2012).
Table 1.2 Generalized classification of salt-affected soils
Soil class
Criteria
ECe (dS m-1) ( *) ESP (%) (**) pH
Non-saline soil Saline soil Sodic (alkali) soil Saline-sodic soil
< 4 > 4 < 4 > 4
< 15 < 15 > 15 > 15
< 8.5 < 8.5 > 8.5 > 8.5 Note: (*) Electrical conductivity of the saturation extract; (**) Exchangeable sodium percentage
Source: Adapted from US Salinity Laboratory Staff (1954)
A sodic soil is characterized by a high proportion of exchangeable sodium (ESP > 15%) on the CEC (Cation Exchange Capacity), but relatively low total soluble salt levels. Accumulation of Na on CEC sites and in Na carbonates in the sodic soil causes soil degradation owing to a loss of structure. Degradation of soil physical properties occurs with displacement of Ca and Mg by Na ions on the negatively charged CEC sites of clay colloids (Carrow and Duncan, 2012). A saline-sodic soil exhibits both high salt levels (ECe > 4 dS m-1) and high exchangeable sodium (ESP > 15%). All problems presented
by saline soil can occur in saline-sodic soil because both contain high amounts of total soluble salt.
1.2.2 Effects of salinity on soil nitrogen cycling
Nitrogen cycling is the sequence of chemical and biological processes in which nitrogen atoms move from the atmosphere into plant, soil, water and other living organisms and are transformed from one form to another. In soil, the transformation of nitrogen form can alter or limit the availability of the nitrogen source to both crop and soil microorganisms. Elevated salinity in soils changes a number of soil processes associated with the soil nitrogen cycle including volatilization, mineralization, nitrification and ammonification. The gaseous loss of ammonia increases with salinity and more than 30% of added N is lost at high salinity levels (ECe > 45 dS m-1) while salinity and pH correlates negatively
with the N mineralization and positively with the gaseous losses of NH3 (Gandhi and
mineralization was found under saline conditions and at higher moisture regimes (Lodhi et al., 2009). The study also concluded that salinity retards the nitrification process resulting in negative effects on the normal N transformation in soil. Akhtar et al. (2012) also found that increased salinity levels have adversely effects on the nitrification process. However, Laura (1977) revealed that the effects of salinity on nitrification depend on the degree of salinity and type of amendment. Elevation of salinity impacts on soil microbe activities in the nitrification process and this leads to a reduction in the conversion of ammonium to nitrate (Irshad et al., 2005; Kumar et al., 2007). Activity and growth of N2 fixing bacteria declines under salt stress (Zahran, 1999). A better
understanding of the soil nitrogen dynamics associated with soil-induced gas emissions under salinity impacts would result in better approaches to the management of nitrogen cycling to maintain soil fertility and plant productivity. The aim of this study is to contribute to this understanding.
1.2.3 Salinity, soil microbial activity and denitrification
Salinity impacts soil microbial activity mainly by lowering osmotic potential. Microbe tolerance to osmotic potential varies between species. Some adapt to the low osmotic potential while others are highly sensitive and die. This change in salinity, therefore, alters the community, functional diversity and activity of soil microorganisms (Pankhurst et al., 2001). High salt concentration usually reduces the efficiency of microbes in utilizing carbon (Oren, 1999; Rietz and Haynes, 2003; Wichern et al., 2006).
Salinity alters the structure of the soil microbial community due to differences in tolerance of soil microbial genotypes to osmotic stress (Nelson and Mele, 2007; Chowdhury et al., 2011b; Baumann and Marschner, 2013). This has impacts on soil nutrient cycling because of the reduced ability of most bacteria to decompose the complex molecules of organic matter (Sardinha et al., 2003; Chowdhury et al., 2011b). The fluctuating salinity changes the osmotic potential and may impact on the activity and growth of soil microbes (Wichern et al., 2006; Setia et al., 2010; Chowdhury et al., 2011a). The size of the microbial biomass was reported as not affected by soil salinity (Sarig and Steinberger, 1994; Wong et al., 2008) whereas many other studies found that salinity depresses the microbial biomass (Laura, 1974; Pathak and Rao, 1998; Rietz and Haynes, 2003; Elgharably and Marschner, 2011). Recently, Morrissey et al. (2014) found that salinity is positively related to bacterial abundance and tightly linked with community composition. These inconsistencies could be due to soil type, salinity level, and water content and indicates a need for a more mechanistic understanding of how salinity affects soil microbial activity and nutrient cycling.
combination of low O2 availability and high organic C content (Knowles, 1982; White and
Reddy, 1999; Valiela et al., 2000). Denitrifiers are present in almost all soils and come from a wide range of microorganisms, including Pseudomonas spp., Alcalignes spp., Flavobacterium spp., Paracoccus spp., and Bacillus spp. The bacterial denitrification process consists of four reactions catalysed by nitrate reductase (Nar), nitrite reductase (Nir), nitric oxide reductase (Nor) and nitrous oxide reductase (Nos) (Hayatsu et al., 2008). Many prior studies have reported that carbon content, O2 concentration in wetland
soils and nitrate supply become the limiting factors for denitrification (Cooper, 1990; White and Reddy, 1999). Overall increase or variation of in situ denitrifying activity in soils has been associated with an increase in nitrate concentration (Thompson et al., 1995; Gardner and White, 2010). Mineralization of available C has been positively correlated with denitrification (Reddy et al., 1982) while denitrification rates in terrestrial soils increase with temperature (Knowles, 1982). Wang et al. (2007) also concluded that oxygen availability, organic matter, nitrate supply, and temperature have the most significant influence over biological denitrification in wetland sediments.
The effects of salinity on denitrification have been highlighted in a number of previous studies (Antheunisse et al., 2007; Seo et al., 2008; Wu et al., 2008; Marks et al., 2016). Elevated salinity has been shown to decrease denitrification activity (Seo et al., 2008). In mangrove microcosms inundated with wastewater, a high salinity treatment resulted in a reduction of potential denitrification (Wu et al., 2008). However, the results reported by Antheunisse et al. (2007) showed no significant correlation between the reintroduction of salt water to semi-natural and agricultural soils on denitrification enzyme activity or potential denitrification. Intermediate salinity water has stimulated denitrification rates in fresh marsh soil by 75%, while higher salinity seawater (35 ppt) suppressed potential denitrification by 73%. This indicated the sensitivity of the denitrifying microbial communities to rapid shifts in salinity (Marks et al., 2016). However, little is known about the salinity effects on denitrifiers from salt-affected soils and the earlier mixed results point to a need for further investigation into the influence of salinity on denitrification in wetland soils addressing denitrifying genes and soil-induced GHG emissions.
1.2.4 Salinity effects on soil carbon cycling
Carbon dynamics in salt-affected soils may raise more concerns in the future because of the extent of salinization and sodicification globally. The properties of saline soils alter biochemical processes which impact the soil microbial biomass and microbial activity, changing CO2 fluxes and the nature and delivery of nutrients to vegetation (Wong et al.,
2010). Several studies have concluded that the reduction of CO2 emissions (Laura, 1974;
salinity is due to a combination of high salinity and sodicity that increase carbon availability (Chandra et al., 2002; Wong et al., 2008). High pH caused by Na hydrolysis in saline soil may increase the solubility of organic matter and promote an organic C loss (Pathak and Rao, 1998). Recently, Setia et al. (2011a) found that salinity has a pronounced negative effect on soil organic matter decomposition, irrespective of soil texture. The contradictory results of these studies might be explained by the differences in soil type, water content and microbial community structure. Therefore, further studies are needed to investigate to better understanding the salinity impacts on soil carbon processes.
1.2.5 Salinity stress and plant/crop growth
A large part of the world’s agricultural land is impacted by salinity and this forces serious limitations on crop growth and productivity (Tanji, 2002; Guo et al., 2013) and consequently on N use efficiency (Fageria, 2013). Läuchli and Grattan (2011) investigated the principal mechanisms and crop responses to salinity and sodicity stress (Figure 1.1). Salinity depresses the external water potential (osmotic effect), and the predominant ions in the solution may have chemical or specific-ion effects.
Firstly, a reduction in the osmotic potential of the medium is one of the primary causes of the adverse effects of salinity on plant growth (Maas and Nieman, 1978). At high salinities which give rise to an increase of solute concentration in the root zone, the external osmotic potential may be depressed below that of the cell water potential (Läuchli and Grattan, 2011; Yadav et al., 2011). The osmotic effect of salinity is an important factor in reducing the plant water uptake and yield to uneconomical levels under dry land conditions when the soil solution osmotic pressure is below 1000 kPa (Rengasamy, 2010b).
Secondly, specific ion effects cause ion toxicity (Na+ and Cl-) and nutrient deficiency (N,
P, Ca2+ and K+) in a plant that lead to a negative impact on plant metabolism (Munns and
Tester, 2008; Marschner, 2012). Ion competition between Na+ and NH
4+ and/or Cl- and
NO3- causes a reduction of N uptake in a saline soil (Fisarakis et al., 2001). A combination
of reduced nitrate uptake and low osmotic potential can exhibit inhibitory effects on plant photosynthesis (Yadav et al., 2011). Relative crop yield often exhibits a linear decrease after a threshold of salinity has been reached shown in Figure 1.2. The relative yield, therefore, varies greatly depending on the salinity levels and the degree of tolerance (Hasanuzzaman et al., 2013). However, there has been little discussion on effects of salinity on nitrogen recovery and rice growth in the field soil-plant system.
Figure 1.2 Relative crop yield in response to various salinity levels and degree of salt tolerance.
Source: Adapted from Hasanuzzaman et al. (2013)
1.2.6 Greenhouse gas emissions induced by agricultural soils
Global warming influenced by greenhouse gases (GHGs) has become a worldwide concern. Current GHG emissions are contributed by anthropogenic activities including land use and land use change in agricultural land forest systems, industrial development, urban expansion, and other sources (IPCC, 2007b). Agricultural activities are the major contributors to GHGs and emit 58% of total anthropogenic emissions of N2O and 47% of
CH4 (US-EPA, 2006b; Smith et al., 2007). Both N2O and CH4 have 298 and 25 times,
respectively, more global warming potential (GWP) as compared to CO2 (IPCC, 2007a).
Future population increase positively relates to increased emissions from agricultural activities in most countries (van Beek et al., 2010). Net emission of CO2 is small through
livestock while N2O production results from agriculture linked to soil management and
fertilizer use through two biochemical processes: soil nitrification and denitrification. Although the processes of GHG production and emission are controlled by biological factors, soil physical conditions also influence biology by their effect on the physical environment (Gregorich et al., 2006). Understanding the mechanisms of GHG emissions and developing technologies and practices to mitigate their effects are crucial strategies for sustainable and productive crop systems.
Salinity is suggested as one of the soil factors to influence gas emissions from soil by affecting soil microbial activity and processes. Soil nitrous oxide (N2O) and carbon
dioxide (CO2) driven by denitrification and metabolism may be significantly affected by
salt concentrations leading to lower emissions (Setia et al., 2011b). However, cumulative CO2 emission from soils did not differ significantly due to the complex interactions of
salinity and sodicity while saline-sodic soils can be a significant contributor of N2O
emissions (Ghosh et al., 2017). Salinity negatively affects to CH4 emissions by
influencing methanogenesis (Pattnaik et al., 2000). However, the addition of NaCl to alluvial soil caused an increase in CH4 production relative to the control (Ramakrishnan
et al., 1998) while CH4 emission did not differ significantly between the inside saline patch
and outside saline patch (Supparattanapan et al., 2009). Mechanism of CH4 emission in
saline condition is not clearly understood. In addition, contradicting results on GHG emissions may be due to differences in carbon substrate, soil chemical properties at various soil types. There certainly is necessary of investigating effects of different salinity levels on GHG emissions of different soil types and amendments.
1.2.7 Laboratory incubation and lid closure time for assessing GHG
emissions from soil
Laboratory incubation has been suggested for good estimates of greenhouse gas emissions under controlled conditions. Schaufler et al. (2010) reported that the comparison of GHG flux of land-use types is difficult to address because of climate factor variation and to overcome these interactions, the incubation of soil cores in the laboratory is a potential approach. To derive the effect of a single parameter on gas emissions from field measurements is difficult because spatial and temporal parameters such as climate, N and C deposition, litterfall and nitrogen availability often co-vary or interact (Davidson et al., 2000; Pilegaard et al., 2006). Laboratory incubation provides the best and least
biased basis for estimating the temperature dependence of organic matter decomposition which can be applied to the measurement of other GHGs (Kirschbaum, 2006).
h (Dobbie and Smith 2001; Velthof et al. 2002; Schaufler et al. 2010), 2 h (Wang et al. 2011), 3 h (Nguyen et al. 2014a), 4 h (Dobbie and Smith 2001), 6 h (Tenuta and Sparling 2011) or 24 h (Lang et al., 2011) after closing the incubation jars or chambers. Nguyen et al. (2014b) indicated that the concentration of GHGs is saturated if the closure time for incubation is longer than 3 h. This leads to a reduction in oxygen in the headspace volume of the incubated jars and limits microbial activity. In addition, Beauchamp et al. (2007) suggested that incubation time for denitrification experiments should be restricted to 5 h, especially in the denitrification potential assay, as nonlinear emission rates occur when new enzymes are produced. In this particular case, a shorter sampling timeline is suitable. Thus, research on the effects of closure time is essential for those looking particularly at denitrification and nitrification rates from an incubation experiment.
1.2.8 Current research on salinity effects and soil-induced gas emissions in
the Mekong Delta
Current research on climate change and salinity effects
The Mekong Delta (MD) in Vietnam has been identified as one of the most vulnerable areas to the potential impacts of global climate change (Nijssen et al., 2001; Hoanh et al., 2003; IPCC, 2007a). Changes in the Mekong River flow and sea level rise are
identified as the two most disruptive factors impacting on agricultural production (Khang et al., 2008). Dun (2012) explored how the changing environmental conditions have
there have been a number of studies on the effects of climate change and saltwater intrusion in the MD, little information is known about the salinity effects on soil nitrogen and carbon cycling in agricultural production. This present study aims to fill that gap.
Current knowledge about greenhouse gas emissions
Vietnam has participated in and implemented the Kyoto Protocol under the United Nations Framework Convention on Climate Change. To proactively respond to climate change, Vietnam approved the National Target Program to Respond to Climate Change since 2008. The objectives of this program are to assess climate change impacts on sectors and regions in specific periods and to develop feasible action plans to effectively respond to climate change in the short-term and long-term (Phung et al., 2016). One of the National Target Program objectives is to assess greenhouse emissions in agricultural systems. However, the majority of emission factors used are default values accepted from the Revised 1996 IPCC Guidelines. There have been few studies directly measuring greenhouse gas emissions (Arai et al., 2015; Izumi et al., 2016). For example, straw used as mushroom beds for straw-mushroom cultivation exhibited lower GHG emissions than straw burning (Arai et al., 2015). Improved management of livestock manure through installation of domestic biogas digesters can reduce GHG emissions (Izumi et al., 2016). Reliable and synchronous data on the parameters of GHG emissions are sparse, and the data collection process is slow. Moreover, the data collection system for greenhouse gas inventory is incomplete and there is a shortage of technical experts (Phung et al., 2016). The CLUES project (2011 – 2015) was a pioneer project to collect baseline data on GHG emissions from paddy rice in the Mekong Delta. This contemporary baseline data will be used as input data to compare GHG mitigation methods. However, the development of standardized protocols for measurement of GHG emissions in the MD is critical to ensure further studies in both laboratory and field ecosystems are comparable.
1.3 Study rationale and thesis outline
The literature review indicates that sea level rise will adversely affect crop production systems in tropical mega deltas around the world. The mega-deltas in Vietnam (the Mekong Delta), Myanmar (Irrawaddy) and Bangladesh (Ganges–Brahmaputra), the backbone of the rice economy in their respective countries, will experience specific climate change impacts due to sea level rise (Wassmann et al., 2009b). In particular, sub-lethal salinity levels which will cause reductions in crop production are likely to change soil carbon and nitrogen cycling leading to increased losses.
economic assessment of carbon and nitrogen cycle changes. Currently there are many incubation methods being applied to assess respiration and denitrification on untested soil types. This leads to the first research question in Chapter 2, a methodological question: how do lid closure time, gas sampling interval and activation of a soil incubation influence greenhouse gas emissions? This information is needed to design future research on management of carbon and nitrogen cycling in farming systems.
Alluvial and acid sulphate soils are common production soils in Australia and Vietnam. Acid sulfate soils are commonly distributed in low-lying areas and are vulnerable to sea-level rise (Bush et al., 2010). The two soil types will respond differently to salinity effects. Using rapid assessment of laboratory incubation technique (developed in the methodological Chapter 2), an assessment of the effect of salinity on these soil types was undertaken. This allows the rapid quantification of denitrification and respiration changes within the soils. The information from this study will answer the second research question in Chapter 3: does elevated soil salinity change greenhouse gas emission from soils?
Principle roles of soil microbes in soil carbon and nitrogen cycling have been addressed. However, the effects of salinity on the genetic make-up of the soil bacteria driving carbon and nitrogen cycling in soil are poorly understood. Applying the incubation method and suggested sampling interval in Chapter 2, and research findings from the Chapter 3, the third research question in Chapter 4 is: how do different salinity levels change the abundance of denitrifier genes in acid sulphate soil? The information generated by this study will clarify the relationship between denitrifying gene abundance and greenhouse gas emissions under the salt-affected soil environment. The finding contributes to our current understanding of the biological pathway of soil gas emissions and this contribution is needed to identify the most effective mitigation approaches.
1.4 Research questions and objectives of study
In summary, this study addressed the following research questions: 1. How does incubation lid closure time affect the emission of GHGs? 2. Does elevated soil salinity change greenhouse gas emission from soils? 3. Does salinity alter abundance of denitrifying genes of a salt-affected soil?
4. How does salinity alter soil properties and rice nutrient efficiency in the field soil-plant system?
The correspondent overall objective of this study was to understand changes of soil carbon and nitrogen cycling associated with greenhouse gas emissions, plant growth and fertilizer recovery under effects of different salinity levels. To obtain the overall objective, the present study attempted to achieve following specific objectives:
- To analyse greenhouse gas production from different soils with different times of lid closure and to assess the effects of different activation times on gas emissions from soils (Chapter 2).
- To investigate carbon and nitrogen release from soils under the effects of saltwater submergence (Chapter 3).
- To identify a relationship between induced-soil gas emissions and abundance of denitrification genes in a salt-affected soil (Chapter 4).
- To investigate changes of soil properties, the N dynamic and the collective effect on rice growth and yield under various salinity levels by using a 15N label fertilizer
technique (Chapter 5).
Chapter 2: DIFFERENT LID CLOSURE TIMES ALTER FLUXES OF
GREENHOUSE GASES FROM INCUBATED SOILS
Dang Duy Minh1, 2, 3, Ben Macdonald1, Sören Warneke1, Ian White2.
1 Commonwealth Scientific and Industrial Research Organisation (CSIRO) Agriculture
Flagship, Canberra, ACT, 2601, Australia.
2 Fenner School of Environment and Society, Australian National University, Canberra
Australia.
3 Soil Science Department, College of Agriculture and Applied Biology, Can Tho
University, Vietnam.
The material contained in this chapter was published in Soil Research.
Dang, D. M., Macdonald, B., Warneke, S. and White, I., 2018. Fluxes of greenhouse gases from incubated soils using different lid-closure times, Soil Research, 56(1): 39-48.
Authorship statement
Manuscript title: Fluxes of greenhouse gases from incubated soils using different lid-closure times.
Dang Duy Minh (PhD Candidate)
I implemented the experiment, analysed soil and gas samples, interpreted and analysed data, wrote the manuscript and acted as the corresponding author. I hereby certify that the statement of contribution to the manuscript is accurate.
Signature: ___________________ Date: _____________________
Ian White
I evaluated the manuscript, provided comments and corrections. I hereby certify that the statement of contribution to the manuscript is accurate and I give permission for the inclusion of the manuscript in the thesis.
Signed Date: _____________________
Sören Warneke
I provided comments and suggestions the manuscript. I hereby certify that the statement of contribution to the manuscript is accurate and I give permission for the inclusion of the manuscript in the thesis.
Signed Date: _____________________
Ben Macdonald
I supervised development of work, evaluated the manuscript, provided comments and corrections. I hereby certify that the statement of contribution to the manuscript is accurate and I give permission for the inclusion of the manuscript in the thesis.
Chapter 2: DIFFERENT LID CLOSURE TIMES ALTER FLUXES OF
GREENHOUSE GASES FROM INCUBATED SOILS
Abstract
Different sampling times for greenhouse gas measurements have been proposed in many incubation studies. Little has been known about effects of closure time on denitrification and nitrification rates from incubation experiments. The objectives of the present study were to analyse greenhouse gas production from different soils with different times of lid closure and to assess effects of different activation time on gas emissions from soils. To quantify greenhouse gas emissions from three soil types, 40g of air-dried soil samples (0-10 cm) were incubated in a 125-ml jar at 25oC with the
addition of glucose and nitrate. The first experiment aimed to measure greenhouse gas fluxes at different lid-closure time (40, 80, 120 and 1440 minutes). The second experiment was to assess the effects of soil activation (40, 80, 120 and 1440 minutes) on gas emissions. Our findings showed closure time <1 hour or >2 hours may cause an underestimation of greenhouse gas emissions. The 20-min sampling interval at the closure time of maximum 80-minute produced good results that showed less variance for either soil types or monitored gases. Lengthening activation times may result in different emission rates in line with soil characteristics although deployment time of headspace gas samples was the same. To measure gas fluxes based on a linear regression model, we suggest that 4 or 5 sampling points should be taken, with sampling at 20-minute intervals over a maximum period of 80 minutes for estimating gas fluxes from soil. Because activation time for incubated soils is critical and a driving factor in the measurement of soil-induced gas emissions, a standardized procedure to quantify gas fluxes is needed for incubation studies.
Keywords: lid closure, greenhouse gas emissions, incubation, amendment, and nitrogen cycle.
2.1 Introduction
The most important greenhouse gases contributing to global warming from the biosphere are carbon dioxide (CO2), nitrous oxide (N2O) and methane (CH4). Soils are a major
the earth’s atmosphere is warming. Both laboratory and field studies have been conducted to quantify the rates of processes producing GHGs from agricultural soils and to assess mitigation strategies.
A number of approaches and strategies exist for the field measurement of greenhouse gas emissions each having its own strengths and weaknesses (Collier et al., 2014). Mass balance techniques rely on wind-based dispersion of gases and are used to measure fluxes from small, well-defined sources (Denmead et al., 1998). Micrometeorological approaches based on real-time direct measurement of vertical gas fluxes can provide direct measurements over large areas (Smith et al., 1994). However, the need for costly infrastructure can limit the deployment possibilities of this method. Chamber-based methods focus on change in gas concentration at the soil surface by sampling from a restricted above-ground headspace and obtain measurements from small areas and numerous treatments (Davidson et al., 2008; Phillips et al., 2009; Collier et al., 2014). However, this method can be labour-intensive and time-consuming. Savage et al. (2014) recently deployed an automated soil respiration system with a newly-available quantum cascade laser to measure simultaneously the three most important greenhouse gases from soils.
A laboratory incubation approach can access one or more expected factors to address the research questions and meet the objectives. For example, greenhouse gas emissions can be investigated by running an incubation study covering a wide spectrum of temperature, soils and moisture conditions (Schaufler et al., 2010). In addition, researchers can implement and monitor a greater quantity of samples, treatments and/or replicates. With the advantage of homogenized samples (Bandibas et al., 1994), variations in the results can be minimised and the cost to run laboratory incubation is lower than a measurement in the field. Laboratory incubations providing valuable information on the production of GHGs (Nguyen et al., 2014b) have been used extensively, but a leading question is what is the effect of lid closure time on the GHG production.
suitable. Thus, study on the effects of closure time is essential for those looking particularly at denitrification and nitrification rates from an incubation experiment. Pre-incubation, hereinafter named activation time, has been applied to settle and standardise the soil microbial community following disturbance of sampling and sieving (Creamer et al., 2014). Storage of soil samples is inevitable, and this causes an extra variation in the results. Hence, activation of soil samples is suggested before conducting an experiment (Bloem et al., 2006). The activation of re-wetted soils with substrates can also help to activate microbial activity, as microbes generally survive in a dormancy period under a dried condition (Mondini et al. 2006). However, there is much less information about the effects of activation time on soil-induced gas emissions.
In this study, we hypothesized that longer closure time would affect greenhouse gas emissions from soils. The objectives of the incubation study were: i) to analyse greenhouse gas production from different soils with different times of lid closure; and ii) to assess the effects of different activation times on gas emissions from soils. The findings from the present study will be used to discuss the preferable lid closure time for laboratory experiments and to evaluate whether data from studies using different lid closure times could be comparable.
2.2 Materials and methods
2.2.1 Sampling sites and soil collection
Description of sampling sites
Three soil types were used to represent a range of common production soils in Australia. An acid sulphate soil (ASS) managed as a pasture soil was collected from south coast Nowra, New South Wales, Australia (34°49'S, 150°39'E). The elevation of this area varies from 0.5 to 2.5 m above sea level; average annual rainfall is 1,135 mm. The soil collected was classified as a Hydrosol (Isbell, 2002) and the site has a dark loamy topsoil (Lawrie and Eldridge, 2004). The soil surface of the sampling site was covered by ryegrass. Soil pH through the 2 m soil profile ranged from 3.09 to 5.63, and < 4 within one meter below the soil surface. Total soil nitrogen was 0.60% and total carbon was 7.31%.
A pasture soil sample was collected from a site (36o1ʹ S, 146°22ʹ E) of unimproved
pasture. The elevation of this site is 143 m above sea level; average annual rainfall is 541 mm. Collected soil was classified as a Red Dermosol (Isbell, 2002). Smith et al. (2001) reported that clay content of this soil was 290 mg kg–1 soil (~0.029%) in the surface 10 cm. Properties of the soil surface (10 cm) were soil pH (1:5 soil:water) of 4.79; total carbon of 1.70% and total nitrogen of 0.15%.
Australia (150oE, 30oS). The climate at this site is subtropical, with annual rainfall of 645
mm, but this is highly variable (420 – 870 mm). The site has been cultivated for cotton for almost 40 years. This soil type is classified as Vertosols (Isbell, 2002). Soil surface (30 cm) with 53% clay content, 22% each silt and sand content (Rochester, 2011). Soil surface pH was 7.06 while soil total N and organic carbon were 0.18% and 2.07%, respectively. The properties of the three soil types are summarized in Table 1.
Table 2.1 Basic characteristics of incubated soil samples (0 – 10 cm)
Soil EC
(dS m-1)
pH (1:5)
Total C (%)
Total N (%)
NO3 – N
(mg kg-1)
NH4 – N
(mg kg-1)
Acid sulphate soil 2.34 3.93 7.31 0.60 0.34 214.18
Red Dermosol soil 0.19 4.79 1.70 0.15 6.23 41.13
Vertosol soil 0.25 7.06 2.07 0.18 41.90 60.27
Soil collection
Surface soil samples (0-10 cm) from the three soil types were collected into plastic bags, stored in isolated containers and delivered to the laboratory within 5 hours. The samples were dried at 40oC, sieved (<2mm) and mixed well before representative subsamples
were collected and used for the incubation experiment.
2.2.2 Soil extraction and analysis
Soil pH and EC were measured in 1:5 soil:water extract after end-over-end shaking at 25°C in a closed system for 1 h (Rayment and Lyons, 2011). Soil ammonium and nitrate were extracted with 2 M KCl solution and determined following the method described by Keeney and Nelson (1982). Total carbon and nitrogen were analysed based on Dumas high-temperature combustion by using a Europa 20-20 isotope ratio mass spectrometer with an Automated Nitrogen Carbon Analysis (ANCA) preparation system. Nitrogen and carbon content were measured by a mass spectrometer for the N2 and CO2 peaks
sequentially (Nelson and Sommers, 1996; Rutherford et al., 2007; Rayment and Lyons, 2011).
2.2.3 Incubation experiment for greenhouse gas measurement
Two incubation experiments were undertaken to quantify greenhouse gas emissions from the three soil types. The two incubation experiments received the same pre-treatment. Forty grams (40g) of air-dried soil samples (0-10 cm) with moisture content ranged 2.31 – 2.57% were weighed in a 125 mL jar, with a solution (12 mL) of glucose (300 µg glucose-C g-1 soil) and nitrate (50 µg NO
3-N g-1 soil) added. This treatment was
activities for 24 hours before starting greenhouse gas emission measurement. The incubations were maintained at 25oC at a constant temperature without any light source.
Experiment 1: to measure greenhouse gas fluxes in different lid-closure time
Incubated jars were closed for 40, 80, 120 minutes and 24 hours (1440 minutes) as study treatments. The experiment was conducted as a randomized complete block design with each treatment replicated three times. A sample of headspace gas (6 mL) was collected using a syringe at 0 min and another 4 times at each quarter of the total closed period. The headspace gas sample was injected into evacuated vials (3.75 mL) for storage and analysed within 24 hours. Helium (6 mL) was returned into each jar after each sample was collected.
Experiment 2: to assess the effects of soil activation on GHG emissions
The second jar set was tested to ascertain whether additional ‘pre-incubation time’ (activation time) influenced gas fluxes. The second jar set was also pre-incubated for 24 h at 25oC. Then, these jars were left open for additional duration of 40, 80, 120 minutes,
and 24 hours (1440 minutes) as activation treatments. The second experiment was also performed as a randomized complete block design with each treatment replicated three times. A sample of headspace gas (6 mL) was collected using a syringe at 0 min and then every 10-minute interval, making a total of five sampling times. Helium return was accomplished as for the first experiment.
Gas samples and standards were analysed for N2O, CH4, and CO2 concentrations using
a GC-2014 Shimazu gas chromatograph (Shimazu, Kyoto, Japan) equipped with an electron capture detector (ECD) to determine nitrous oxide emission from the incubated jars. A flame ionization detector was also connected to the gas chromatograph to detect other gases such as CH4 and CO2.
2.2.4 Data calculation and statistical analysis
Atmospheric pressure and temperature in the laboratory were recorded at each sampling point. As helium gas was returned after headspace sampling, volumetric gas concentration was re-corrected before it was converted to mass gas concentration, following equation 1:
Cmass = (Cvolumetric × P × MWgas) / (T × R) (1)
where Cmassis mass concentration (g L-1), Cvolumetric is volumetric concentration (ppm), P
is ambient air pressure (atm), MWgas is molecular weight of the gas (g mole-1), T is
Emission data were calculated by fitting a linear regression model through at least three of the 5 sampling points, removing any outliers to achieve a minimum R2 of 0.85
(Petersen et al., 2006; Gao et al., 2014). Slopes of the regression were used to estimate gas fluxes. The gas fluxes were converted to the gas emissions per gram soil basis following equation 2. The data for gas flux were based on oven-dried weight. The linear regression was only presented for N2O fluxes (Appendix 1) and similar calculations were
performed for fluxes of other gases and for fluxes of all gases in the second experiment (data not shown).
F = S * V * Wsoil-1 (2)
where F is flux of greenhouse gases (g hr-1 g-1), S is slope of the regression (g L-1 hr -1), V is headspace volume (L), and W
soilis weight of soil used in an incubated jar (g).
Statistical analysis was conducted with R statistical software version 3.0.2 (The R Foundation, Vienna). Prior to the analysis, data were tested for homogeneity and normality and the results of data skewness tests were accepted. One-way ANOVA and Tukey’s test were used to identify differences among closure time or activation treatments at P<0.05 and n=3.
2.3 Results
2.3.1 Effects of different lid closure time (Experiment 1) on GHG emissions
N2O fluxes
Average of N2O fluxes from the acid sulphate soil was less than 0.16 µg kg-1 soil hour-1.
Absorption of N2O was found within 40 minutes which was significantly different from the
emissions in other treatments (Figure 2.1a). Among the three soil types nitrous oxide fluxes from Red Dermosol soil were relatively high and varied from 5.92 to 6.74 µg kg-1
soil hour-1. However, differences of closure time did not result in any significant difference
in the emissions (Figure 2.1b). In the Vertosol soil, the closure time of 24 hours resulted in the least emissions (0.03 µg kg-1 soil hour-1) compared to those at 40 and 80 minutes
0.37 µg kg-1 soil hour-1. The nitrous oxide emission rate of the 120-minute closure
treatment (0.17 µg kg-1 soil hour-1) was not significantly different to those from the 40 and
-0.50 -0.25 0.00 0.25 0.50 0.75
1.00 a /
N2
O
flux (µg
N2
O
k
g
-1 s
oil
h
r
-1 )
0 2 4 6 8
10 b /
40 minutes 80 minutes 120 minutes 1440 minutes
0.0 0.2 0.4 0.6 0.8
1.0 c /
b
a a
a
a a
a a
a a
ab
b
[image:39.595.188.465.60.618.2]Closure time
Figure 2.1 Fluxes of N2O from acid sulphate (a), Red Dermosol (b) and Vertosol (c) soils
CO2 fluxes
Acid sulphate soil showed similar CO2 fluxes among the different closure treatments.
The emissions were from 0.43 to 0.62 mg CO2 kg-1 soil hour-1 (Figure 2.2a). In the
Vertosol soil, the CO2 flux of the 40-minute closure treatment was 1.06 mg CO2 kg-1 soil
hour-1, but this emission was not significantly different compared that of the 120-minute
closure treatment. The emissions of the 80-minute and 24-hour closure treatments were significantly less than 40 minutes but not significantly different from each other (Figure 2.2c). The flux from the 80-minute treatment was 0.56 mg CO2 kg-1 soil hour-1, whereas
release from the 24-hour closure treatment was 0.45 mg CO2 kg-1 soil hour-1. Carbon
dioxide fluxes from the Red Dermosol soil ranged from 2.29 to 5.01 mg CO2 kg-1 soil
hour-1 and there were no significant differences among the treatments with closure time
>1 hour. However, absorption of CO2 was recorded in the 40-minute closure treatment,
Closure time 0.0
0.3 0.6 0.9 1.2
1.5 a /
Ca
rbon
dioxid
e f
lux
r
ate
(mg k
g
-1 s
oil hr
-1 )
-6 -3 0 3 6 9
12 b /
40 minutes 80 minutes 120 minutes 1440 minutes 0.0
0.3 0.6 0.9 1.2
1.5 c /
a
a a
a
b
a
a
a
a
b
ab
[image:41.595.113.378.63.623.2]b
Figure 2.2 Fluxes of CO2 measured from treatments for closure times 40, 80, 120 and