© Author(s) 2019. This work is distributed under the Creative Commons Attribution 4.0 License.
Effects of sterilization techniques on chemodenitrification and N
2
O
production in tropical peat soil microcosms
Steffen Buessecker1, Kaitlyn Tylor1, Joshua Nye2, Keith E. Holbert3, Jose D. Urquiza Muñoz4,5,6, Jennifer B. Glass7, Hilairy E. Hartnett2,8, and Hinsby Cadillo-Quiroz1,9
1School of Life Sciences, Arizona State University, Tempe, Arizona, USA 2School Molecular Sciences, Arizona State University, Tempe, Arizona, USA
3School of Electrical, Computer and Energy Engineering, Arizona State University, Tempe, Arizona, USA 4Laboratory of Soil Research, Research Institute of Amazonia’s Natural Resources,
National University of the Peruvian Amazon, Iquitos, Loreto, Peru
5School of Forestry, National University of the Peruvian Amazon, Pevas 584, Iquitos, Loreto, Peru 6Department for Biogeochemical Processes, Max Planck Institute for Biogeochemistry, Jena, Germany 7School of Earth and Atmospheric Sciences, Georgia Institute of Technology, Atlanta, Georgia, USA 8School of Earth and Space Exploration, Arizona State University, Tempe, Arizona, USA
9Biodesign Institute, Arizona State University, Tempe, Arizona, USA
Correspondence:H. Cadillo-Quiroz ([email protected]) Received: 15 July 2019 – Discussion started: 2 August 2019
Revised: 14 October 2019 – Accepted: 21 October 2019 – Published: 5 December 2019
Abstract.Chemodenitrification – the non-enzymatic process of nitrite reduction – may be an important sink for fixed ni-trogen in tropical peatlands. Rates and products of chemod-enitrification are dependent on O2, pH, Fe2+concentration,
and organic matter composition, which are variable across peat soils. Assessing abiotic reaction pathways is difficult because sterilization and inhibition agents can alter the avail-ability of reactants by changing iron speciation and organic matter composition. We compared six commonly used soil sterilization techniques –γirradiation, chloroform, autoclav-ing, and the use of three different chemical inhibitors (mer-cury, zinc, and azide) – for their compatibility with chemod-enitrification assays for tropical peatland soils (organic-rich, low-pH soil from the eastern Amazon). Out of the six tech-niques,γirradiation resulted in soil treatments with the low-est cell viability and denitrification activity and the least ef-fect on pH, iron speciation, and organic matter composition. Nitrite depletion rates inγ-irradiated soils were highly sim-ilar to untreated (live) soils, whereas other sterilization tech-niques showed deviations. Chemodenitrification was a domi-nant process of nitrite consumption in tropical peatland soils assayed in this study. Nitrous oxide (N2O) is one possible
product of chemodenitrification reactions. Abiotic N2O
pro-duction was low to moderate (3 %–16 % of converted nitrite), and different sterilization techniques lead to significant vari-ations on production rates due to inherent processes or po-tential artifacts. Our work represents the first methodological basis for testing the abiotic denitrification and N2O
produc-tion potential in tropical peatland soil.
1 Introduction
Across ecosystems, physical and chemical factors, such as solar radiation or redox gradients, can drive abiotic chem-ical transformations. The nitrogen (N) cycle, in particular, includes abiotic reactions that can affect the retention of nutrients or substrates (Clark, 1962; McCalley and Sparks, 2009; Parton et al., 2007). Abiotic formation of N-containing gases has long been known (Jun et al., 1970; Wullstein and Gilmour, 1966). A major abiotic process in the N cycle is chemodenitrification, the stepwise reduction of nitrite (NO−2) to gaseous products, namely nitric oxide (NO), nitrous oxide (N2O), or dinitrogen (N2), often coupled to iron (Fe2+)
2015).
NO−2 +Fe2++2H+→NO+Fe3++H2O (1)
2NO+2Fe2++2H+→N2O+2Fe3++H2O (2)
Equations (1) and (2) are plausible in soils and sediments (Jones et al., 2015). The abiotic reduction of N2O to N2 is
not well known. It has been associated with the presence of copper (Moraghan and Buresh, 1977), but this species is un-likely to be present at sufficient levels in peat soils to promote this reaction. Anoxic tropical peat soils are expected to have the ideal conditions for chemodenitrification: low O2, low
pH, high organic matter (OM), and high Fe2+(Kappelmeyer et al., 2003; Nelson and Bremner, 1969; Porter, 1969; Van Cleemput et al., 1976). In these ecosystems, NO−x is sup-plied by nitrification fueled by organic N mineralization or from external sources (fertilization, wet or dry deposition). Besides metals, reduction of NO−x compounds can also be mediated by organic functional groups found in soils. Abiotic phenol oxidation occurs at oxic–anoxic interfaces in tropi-cal soils and may be linked to the N cycle (Hall and Silver, 2013). In such reactions, NO−2 can be reduced by phenolic groups to form the nitrosonium cation NO+, which can either (1) remain fixed within the organic compound as nitrosophe-nol (Thorn and Mikita, 2000; Thorn et al., 2010) or (2) be emitted in gaseous form. After tautomerization to an oxime (Raczy´nska et al., 2005) and reaction with NO+derived from a second NO−2 ion, hyponitrous acid (H2N2O2) can be
pro-duced, which further decomposes to N2O (e.g., Scheme 1;
Porter, 1969; Stevenson et al., 1970).
Other OM-dependent NO−2 reduction pathways can pro-duce NO and N2(McKenney et al., 1990; Thorn et al., 2010)
instead of N2O.
The importance of abiotic N transformations in environ-mental samples has been notoriously difficult to quantify due to the artifacts emerging from physical or chemical “killing” methods intended to eliminate biological activity but affect-ing metals, organic matter, or other pools. In order to dis-tinguish denitrification from chemodenitrification, enzymes contributing to gaseous N production must be inactivated, most commonly by addition of sterilants or inhibitors. An efficient sterilization treatment ideally (1) contains a negli-gible number of live cells, (2) eliminates biological activity, and (3) has little or no effect, directly or indirectly, on abiotic reactions (e.g., it should neither alter mineral structure nor lyse cells because release of cellular contents could influence abiotic reactions). Because rates and products of chemodeni-trification are dependent on O2, pH, Fe2+concentration, and
OM composition, it is important to assess whether a sterilant or inhibitor elicits a physicochemical change that can affect the availability or interaction of these reactants.
Soil sterilization techniques include γ irradiation, chlo-roform (CHCl3) fumigation, autoclaving, and addition of
chemical inhibitors such as mercury (Hg), zinc (Zn), or azide (N3). Highly energeticγ irradiation damages enzymes and
cell components, rendering cells nonviable and inactive, gen-erally with minimal effect on soil chemistry (Trevors, 1996). Autoclaving with high-pressure steam disrupts cell mem-branes, denatures proteins, and decreases aromaticity and polycondensation of soil OM (Berns et al., 2008; Jenkin-son and PowlJenkin-son, 1976b; Trevors, 1996). Fumigation with CHCl3induces cell lysis and has minimal effect on enzymes
(Blankinship et al., 2014). Chemicals like Hg, Zn, and N3
do the opposite: they inhibit enzymes (Bowler et al., 2006; McDevitt et al., 2011) but do not lyse cells (Wolf et al., 1989). We evaluated the appropriateness of six sterilants (γ irra-diation, autoclaving, CHCl3, Hg, Zn, and N3) for
chemoden-itrification measurements in low-O2, low-pH, high-OM soils
from a tropical peatland. First, we tested the effects of ster-ilants on cell membrane viability and biological denitrifica-tion activity. Next, we evaluated the effects of sterilants on soil chemistry (pH, OM composition, and extractable Fe). Fi-nally, we assessed the effects of the six sterilants on chemod-enitrification measured by NO−2 depletion and N2O
produc-tion.
2 Materials and methods
2.1 Sample characteristics
Soil samples were collected in October 2015 from a trop-ical peatland, locally known as Quistococha (03◦50.0240S 73◦19.2350W), near Iquitos (Loreto, Peru). The soil geo-chemistry of this site has been described previously (Law-son et al., 2014; Lähteenoja et al., 2009). The samples were obtained from depths of 15–30 cm below the water table and kept strictly anoxic during transport and storage at 4◦C in the dark. Water saturation and organic carbon
content were determined by oven drying and loss on ig-nition, respectively. Dissolved organic carbon (DOC) was determined by high-temperature combustion using a Shi-madzu TOC-V Total Organic Carbon Analyzer (ShiShi-madzu Scientific Instruments, Columbia, MD). Inorganic N species were quantified photometrically using an AQ2 Discrete Ana-lyzer (Seal Analytical, Southampton, UK) and method EPA-103-A Rev.10 for ammonium (NH+4; LoD 0.004 mg N L−1, range 0.02–2.0 mg N L−1) and method EPA-127-A for nitrate (NO−3)/nitrite (NO−2; LoD 0.003 mg N L−1, range 0.012– 2 mg N L−1). Hydroxylamine was measured photometrically using the iodate method (Afkhami et al., 2006).
2.2 Soil sterilization and slurry incubations
Scheme 1.Putative nitrous oxide formation pathway formed by NO−2 reduction by phenolic groups.
wet soil were irradiated with a 60Co source for 7 d, yield-ing a final radiation dose of 4 Mrad (40 kGy). The irradiated soil was then prepared for incubation in an anoxic glove box (0.5 % H2in N2) with disinfected surfaces and sterilized
ma-terials to prevent contamination. For autoclaved samples, soil was prepared for incubation in closed vials and autoclaved at 121◦C and 1.1 atm for 90 min. The CHCl3-treated samples
were fumigated for 48 h under a 100 % N2atmosphere.
Be-cause volatilized CHCl3corrodes electron capture detectors
used for N2O detection (see below), CHCl3was removed by
flushing the vials with N2 for 5–7 min immediately before
the start of incubations.
In contrast to the physical sterilization treatments, soil samples were continuously exposed to the chemical in-hibitors throughout their incubation. Sodium azide (NaN3,
Eastman Organic Chemicals), zinc chloride (ZnCl2, Fisher
Scientific), and mercuric chloride (HgCl2, 99.5 %, Acros Or-ganics) were added from anoxic stock solutions to final con-centrations of 150, 87.5, and 3.7 mM, respectively. The Hg concentration was the minimum needed to eliminate micro-bial heterotrophic growth based on visual inspection of soil extract on agar plates exposed to 0.5 to 92.1 mg L−1, which includes concentrations demonstrated to be effective previ-ously (Tuominen et al., 1994).
After the initial physical or chemical treatment, tripli-cate incubations were diluted 1:10 in 20 mL of autoclaved 18.2 Mcm water in 60 mL glass serum vials. All micro-cosms were prepared in an anaerobic glove box (0.5 % H2in
N2) prior to incubation. Triplicate soil slurries were amended
from an anoxic, sterile stock solution to a final concentra-tion of 300 µM NO−2 (6 µmol in 20 mL) and sealed with thick butyl rubber stoppers. A parallel set of samples was amended with 300 µM NO−3 to evaluate denitrification potential with CO2measurements. Control incubations received an
equiva-lent volume of autoclaved 18.2 Mcm water without NO−x. Soil microcosms were incubated in the dark at a constant temperature of 25◦C. NO−2 was quantified in all soil treat-ments using the Griess assay (Promega, Kit G2930). pH mea-surements were taken with an Orion 3 Star meter (Thermo Scientific) before and after sterilization, and at the end of the experiment after 70–76 h of incubation.
2.3 Gas chromatography
To quantify N2O and CO2production, 200 µL of headspace
gas was sampled with a gas-tight syringe (VICI Precision Sampling) and injected onto a gas chromatograph (GC, SRI Instruments) equipped with both an electron-capture detec-tor (ECD) and a flame-ionization detecdetec-tor (FID). Two con-tinuous HayeSep-D columns were kept at 90◦C (oven
tem-perature); N2(UHP grade 99.999 %, Praxair Inc.) was used
as carrier gas, and for FID combustion H2 was supplied
by a H2generator (GCGS-7890, Parker Balston). For CO2
measurements, a methanizer (which reduces CO2to the
de-tectable CH4via a Ni catalyst at 355◦C) was run in line
be-fore the FID. The ECD current was 250 mV and the ECD cell was kept at 350◦C. The N2O and CO2 measurements
were calibrated using customized standard mixtures (Scott Specialty Gases, accuracy±5 %) over a range of 1–400 and 5–5000 ppmv, respectively. Gas accumulation in the incuba-tion vials was monitored over time. Gas concentraincuba-tions were corrected using Henry’s law and the dimensionless concen-tration constantskHcc(N2O)=0.6112 andkccH(CO2)=0.8313
(Stumm and Morgan, 2012) to account for gas partitioning into the aqueous phase at 25◦C.
2.4 Live or dead cell staining
To assess the efficacy of sterilants or inhibitors visually, the bacterial viability kit LIVE/DEAD BacLight L7012 (Molec-ular Probes, Invitrogen) containing SYTO9 and propidium iodide dyes was used to stain and distinguish dead and living cells on the basis of intact cell walls. The green (live) and red (dead) signals were counted at 60×magnification from 10 squares of 0.01 mm2randomly distributed in the center of a 5 µL Neubauer chamber, using an Olympus BX-61 micro-scope with the FITC/Cy5 filter set. Photographs were taken with an Olympus DP-70 camera attached to the microscope. Particles were counted with ImageJ software version 1.50i (Abràmoff et al., 2004).
2.5 Fe extraction and quantification
shown to be more suitable for extraction of Fe from humic-rich matrices than the traditional ferrozine or phenanthroline methods. Briefly, 2.5 mL of soil slurry was filtered (0.2 µm nylon filter; Celltreat Scientific Products) and mixed with 7.5 mL of HCl (0.67 N) in an extraction vial in a 0.5 % H2
in N2glove box. The O2concentration in the glove box was
continuously monitored and remained <10 ppm. To sepa-rate Fe3+from Fe2+, 10 mL of 0.1 Mbis-2-ethylhexyl phos-phate (95 %, Alfa Aesar) in n-heptane (99.5 %, Acros Or-ganics) was added to the acidified sample. Next, the organo-aqueous emulsion was shaken at 250 rpm in closed extraction vials for 2 h. Thebis-2-ethylhexyl phosphate chelates Fe3+ more effectively than it chelates Fe2+. The Fe2+-containing aqueous phase was sampled into a 3-fold HCl-washed HDPE vial (Nalgene) in the glove box. The Fe3+fraction chelated in the organic phase was then back-extracted into an aque-ous phase by the addition of 10 mL 4 N HCl and shaking at 250 rpm in closed extraction vials for 20 min. Fe3+ and
Fe2+fractions were quantified separately in acidified aque-ous solution by inductively coupled plasma–optical emission spectrometry (ICP-OES; Thermo iCAP6300 at the Goldwa-ter Environmental Laboratory at Arizona State University). The ICP-OES pump rate for the Ar carrier was set to 50 rpm, and Fe2395 and Fe2599 lines were used for Fe quantifica-tion. Iron concentrations were determined from a calibra-tion curve (0.01–10 mg L−1) by diluting a standard solution (100 mg L−1, VHG Labs, product no. SM75B-500) in 0.02 N HNO3.
2.6 Dissolved organic matter fluorescence analysis
Three-dimensional fluorescence analysis was performed on a Horiba Jobin-Yvon Fluoromax 4 spectrofluorometer. Excitation–emission matrices (EEMs) were generated by ob-taining emission spectra (λEm=300–550 nm, at a step size
[image:4.612.310.547.68.202.2]of 2 nm) at excitation wavelengths from 240 to 450 nm at a 10 nm step size. All EEMs were blank-corrected and nor-malized daily to the Raman peak of ultrapure water (deion-ized, carbon-free,18.2 Mcm; Barnstead™NanoPure). The samples were taken at the same time as those for Fe anal-ysis. Prior to analysis, soil slurries were filtered using a solvent-rinsed Whatman Glass Microfiber Grade F GF/F fil-ters (nominal pore size 0.7 µm) to obtain ∼10 mL filtrate. Samples were diluted with ultrapure water if their UV ab-sorbance exceeded 0.3 so that inner-filter corrections could be made (Stedmon et al., 2003). We calculated total fluores-cence as the matrix sum of all signals in the EEM. Fluores-cence indices were used to characterize various classes of flu-orophores in the dissolved organic matter (DOM) pool. Fluo-rescence index (FI) was calculated as the sum of the intensity signal in the emission spectra from 470 to 520 nm collected at an excitation wavelength of 370 nm (Cory and McKnight, 2005). Humification index (HIX) was determined from the peak area under the emission spectrum from 435 to 480 nm, divided by the area from 300 to 445 nm, both collected at an
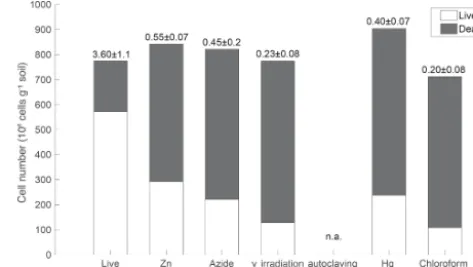
Figure 1.Live and dead microbial cell counts of tropical peatland soils. The numbers above the bars indicate the live to dead sig-nal ratio±SD. No detectable signal was observed in autoclaved samples. Thexaxis represents treatments (live: no treatment; Zn: ZnCl2; Hg: HgCl2; Azide: NaN3).
excitation wavelength of 254 nm (Ohno, 2002). The “fresh-ness” was determined to beβ/α, the ratio of emission inten-sity at 380 nm to the emission inteninten-sity maximum between 420 and 435 nm, both collected at an excitation wavelength of 310 nm (Wilson and Xenopoulos, 2009).
2.7 Statistical analyses
All basic statistical tests were performed with JMP Pro soft-ware (Version 13.1.0, SAS Institute Inc., Cary, NC, USA).
3 Results
3.1 Composition of high-OM tropical soils
The tropical peat soil used for the incubation experiments had 5.5–5.8 pH, 92.2 % water content, 307±5 mg TOC g−1 dry weight, and 3.8±0.9 g total Fe kg−1soil. The extractable iron fraction partitioned as 54±3 µM extractable Fe3+ and 213±16 µM extractable Fe2+. The native soil pore water had 13.2±1.2 mg L−1DOC, 436±79 µg N L−1NH+4, 9.7± 1.3 µg N L−1NO−
3, and 3.9±0.2 µg N L −1NO−
2.
Hydroxy-lamine was below detection in all cases (<3 µM). Soil pH dropped from 5.5 to 5.8 in untreated soil to 3.6, 4.8, 5.0, 5.2, and 5.4 after treatment with Hg, Zn,γ irradiation, autoclav-ing, and CHCl3, respectively. Only N3 treatment increased
soil pH (to 6.4).
3.2 Effects of sterilants on cell integrity and potential of denitrifying activity
Figure 2. CO2 production rates in 3 d soil slurry incubations of
Quistococha peat soil amended with and without 0.3 mM NO−3. Er-ror bars are 1 SD (n=3). Columns marked with the same letter are not statistically different from each other (Student’sttest,p >0.05, n=3). Thexaxis represents treatments, as in the legend of Fig. 1.
γ-irradiated treatments were most effective at reducing the number of viable cells (∼15 % intact membranes after ster-ilization). Chemical inhibitors (Hg, Zn, and N3) were less
effective at killing cells (∼30 % intact membranes after ster-ilization). Autoclaved samples did not fluoresce, likely due to cell lysis during steam pressurization.
Biological denitrification activity was measured over 3 d in live and sterilized soils based on the difference in CO2
production with and without added NO−3. An efficient ster-ilization treatment would show no changes in CO2 beyond
those due to equilibration between the gas phase and aque-ous phase. Nitrate stimulated CO2 production in live soil
(ANOVA,p <0.05) and not in theγ-irradiated, Zn, Hg, N3,
or autoclaved incubations (Fig. 2), indicating that residual cells in the sterilized treatments were not capable of denitri-fication.
3.3 Effects of sterilants on soil chemistry
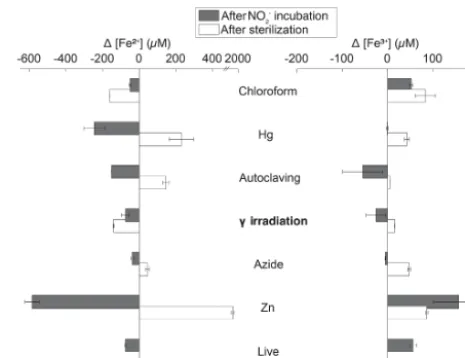
In general, sterilization increased extractable Fe2+and Fe3+ relative to live controls (Fig. 3). This trend was particu-larly pronounced in Zn treatments, which had 9×higher ex-tractable Fe2+ (1915±26 µM) and 1.6×higher extractable Fe3+ (87±3 µM) than live controls. The Hg treatment showed the second-largest increases. In the presence of NO−2, extractable Fe2+ decreased and extractable Fe3+ increased in live, Zn, and CHCl3-fumigated treatments, as expected
if Fe2+ was oxidized by NO−
2 during chemodenitrification.
However, autoclaving, γ irradiation, and N3 lowered Fe3+
concentrations, suggesting the influence of unknown con-comitant reactions. For instance, autoclaving (largest drop in Fe3+) already showed lower Fe3+concentrations after steril-ization. Production of Fe3+-reduction artifacts in treatments could lead to Fe3+ depletion and, hence, mask increase in Fe3+due to chemodenitrification. NO−2 addition resulted in near-complete depletion of extractable Fe2+in live, CHCl3
-Figure 3.Changes in extractable Fe2+(left) and Fe3+(right) con-centration in Quistococha peat soil incubations after sterilization (difference between sterilization baseline and live baseline value) and after NO−2 amendment and incubation (difference between NO−2 and control incubations). Note the difference in scales. Val-ues represent the extractable fraction of both species. Error bars are 1 SD (n=2). Theyaxis represents treatments, as in the legend of Fig. 1.
fumigated, andγ-irradiated soils. Changes in Fe speciation with other sterilants were more moderate. Minimal changes were observed for other metals in soil samples (e.g., Mn, Al, Cu, and Zn; data not shown).
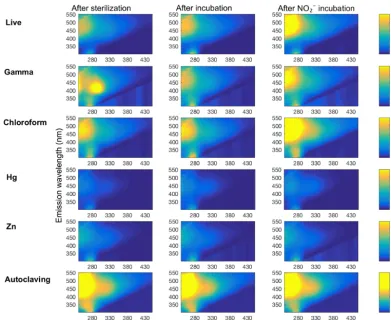
Fluorescence analysis of soil extracts using excitation– emission matrices (EEMs) was used to evaluate changes in DOM-containing aromatic moieties or conjugated dou-ble bonds (Stedmon et al., 2003; Fig. 4). The N3 treatment
was excluded from this analysis due to an interference with N3 absorbance that prevented inner-filter corrections from
being made. The EEM signals showed the greatest change in the “humic” region (λEx<240–270 nm, andλEm=460–
500 nm; Fellman et al., 2010), especially in Zn and Hg treat-ments, which significantly increased the FI from 1.20 (in live soil baseline, prior to NO−2 incubation) to 1.49 (Table 1). Zn and Hg may elicit direct fluorescence quenching through the formation of Zn and Hg metal complexes (McKnight et al., 2001) or possibly due to indirect quenching by more highly dissolved Fe2+. Signal strength in the humic region was en-hanced by NO−2 addition in the live, CHCl3-fumigated, and
[image:5.612.49.286.65.200.2]Figure 4.Representative plots of DOM fluorescence in soil slurry incubations of Quistococha peat soils. DOM fluorescence is presented as excitation–emission matrices (EEMs) collected for each treatment (rows) after the sterilization procedure or live control (left column), after incubation with no amendment (“after incubation” control, middle column), and after incubation with 300 µM NO−2 (same time point as control, right column). The colored bar shows the individual signal intensity. All but the “autoclaving” treatment have same scale of signal intensity, autoclaving effects increased to about 5 times the signal intensity scale. Treatments are as in the legend of Fig. 1.
3.4 Effects of sterilants on chemodenitrification and abiotic N2O production
In the first 48 h, NO−2 consumption rates were the high-est in live soil (5.2 µM h−1), closely followed by irradiated samples (4.5 µM h−1, Fig. 5). The major chemodenitrifica-tion pathway for N2O formation was likely NO−2
reduc-tion by Fe2+, resulting in consumption of ∼1.5 µmol Fe2+ and accumulation of ∼1.1 µmol Fe3+ in the live control (Fig. 3). After 48 h, NO−2 depletion continued to comple-tion in the live control but slowed in all treatments other than the metal additions. After 72 h of incubation, 3 %– 16 % of NO−2-N was converted to N2O-N across
treat-ments. N2O production rates were assessed by linear
re-gression of data points over the whole duration of the experiment. Higher rates were observed in live, Zn2+, and N3 treatments (0.5–0.7 nmol N2O g−1h−1, r2>0.95)
than in γ-irradiated, CHCl3-fumigated, autoclaved, and Hg
treatments (0.1–0.2 nmol N2O g−1h−1, r2>0.9).
Produc-tion rates within treatments showing high or low rates were
not significantly different (Student’st,p >0.05), although comparisons across treatments with high or low rates were statistically different (Student’st,p <0.05). Thus, we iden-tified a higher and lower group of sterilant-dependent N2O
production rates from the same soil samples. The live con-trol showed logarithmic N2O accumulation, while the
steril-ized treatments had linear accumulation over time; the latter is expected in abiotic accumulation (Fig. 5).
4 Discussion
4.1 Chemodenitrification is a dominant NO−2 consumption process in slurry incubations of tropical peat soils
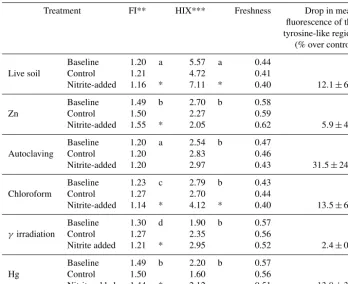
Table 1.Characteristics of dissolved organic matter in soil extracts from incubations of peat from Quistococha, Peru. FI, HIX, and freshness indices were calculated as described in the Methods section. The “tyrosine-like” region is defined at an excitation of 270–275 nm and an emission of 304–312 nm (Fellman et al., 2010). The signal for that region was averaged across replicates and expressed as percent difference between NO−2 additions and controls±SD of replicates. A drop in the signal intensity was consistently apparent but clear differences between the treatments were not, due to high standard deviation of replicates.
Treatment FI** HIX*** Freshness Drop in mean
fluorescence of the tyrosine-like region (% over control)
Live soil
Baseline 1.20 a 5.57 a 0.44
Control 1.21 4.72 0.41
Nitrite-added 1.16 * 7.11 * 0.40 12.1±6.1
Zn
Baseline 1.49 b 2.70 b 0.58
Control 1.50 2.27 0.59
Nitrite-added 1.55 * 2.05 0.62 5.9±4.0
Autoclaving
Baseline 1.20 a 2.54 b 0.47
Control 1.20 2.83 0.46
Nitrite-added 1.20 2.97 0.43 31.5±24.6
Chloroform
Baseline 1.23 c 2.79 b 0.43
Control 1.27 2.70 0.44
Nitrite-added 1.14 * 4.12 * 0.40 13.5±6.4
γ irradiation
Baseline 1.30 d 1.90 b 0.57
Control 1.27 2.35 0.56
Nitrite added 1.21 * 2.95 0.52 2.4±0.8
Hg
Baseline 1.49 b 2.20 b 0.57
Control 1.50 1.60 0.56
Nitrite added 1.44 * 2.12 0.51 13.8±3.9
* indicates significant difference to control.
** Fluorescence index. ** Humification index.
Mean values marked with the same letter are insignificantly different from each other.
cell reproduction in a nonlinear fashion (Duggleby, 1995). Linearity is more reflected in the N2O curve than in the NO−2
curve. The difference in linearity of N2O production in
steril-ized vs. live treatments (Fig. 5) suggests that biological den-itrification did not occur in sterilized soils.
Compared to our study, incubations of artificial media with 200 µM NO−2, 0.5–8.1 mM Fe2+, and pH 7–8 had sim-ilar rates of Fe2+ depletion but 10× higher rates of NO−2 reduction, and higher (∼10 %–50 %) N2O yields (Buchwald
et al., 2016; Jones et al., 2015). In our peat incubations, re-active OM likely trapped NO−2 in the soil matrix via OM-bound nitrosation reactions (Thorn and Mikita, 2000; Thorn et al., 2010) and the lower pH likely promoted conversion of NO−2 to NO (Kappelmeyer et al., 2003; Porter, 1969) or N2
(Stevenson et al., 1970). Studies in low-pH northern temper-ate peat soils have shown the primary product of abiotic NO−2 reduction was NO and not N2O (McKenney et al., 1990).
4.2 Artifacts due to sterilization methods for chemodenitrification assays
Azide and Zn exhibited enhanced NO−2 conversion to N2O,
at rates at least 2 to 5 times as high as those measured for the other sterilants (Fig. 5), likely due to higher pH and Fe availability, respectively. In the N3treatments, elevated N2O
production could be explained by the reaction of protonated NO−2 with N3 in a pH-dependent manner (Stedman, 1959)
and other changes in soil solution that originated from the in-crease in pH. Nitrite reaction with N3has been characterized
in marine and freshwater solutions reaching its maximum at pH 4.5 and proceeding slowly yet significantly (20 % con-version in 1 h) at pH>5 (McIlvin and Altabet, 2005), as in our slurries. Moreover, N3’s self-fluorescence impeded OM
measurements, making N3an incompatible sterilizing agent
for chemodenitrification studies. Zn increased Fe availabil-ity and may have increased NO−2 affinity for reactive OM groups; both effects would lead to an abiotic increase in N2O
Figure 5.NO−2 consumption (left) and N2O production (right) for
different sterilant treatments in soil slurry incubations of Quisto-cocha peat soil. Both N species were simultaneously measured in all treatments. The product yield represents N2O-N as molar fraction of NO−2-N. Note the difference in the left and rightyaxis scales. Er-ror bars are 1 SD (n=3). Treatments are as in the legend of Fig. 1.
et al., 2007). Zinc treatment lowered the soil pH, which may have promoted cation displacement and stability of dissolved Fe2+ (Hutchins et al., 2007), thus enhancing N2O
produc-tion. Several studies have used Zn treatments as a valuable agent for field applications (Babbin et al., 2015; Ostrom et al., 2016). Zn is less hazardous to humans than some of the other sterilants. We propose that the use of Zn could provide useful information about abiotic in situ rates as long as Zn-induced chemodenitrification is accounted for. A correction could be applied if a complementary laboratory assessment (using the more efficientγ irradiation) were used to develop an ecosystem-specific correction factor.
Divalent Hg2+ can be abiotically methylated by fulvic acid-type substances (Rogers, 1977). The reaction oxidizes OM and can diminish its reducing power, as indicated by de-creased reactivity of humic acid with NO−2 (Gu et al., 2011; Zheng et al., 2011), thus interfering with the abiotic assay. Given the pH effect of the Hg treatment, we cannot rule out that decomposition of nitrous acid (HNO2) contributed to
NO−2 consumption (Fig. 5, Park and Lee, 1988). Another po-tential factor associated with the Hg treatments is metal sorp-tion. At low pH (3.6), 98 % of Hg was sorbed to humic acids, whereas only 29 % of Zn was sorbed at pH∼4.8 (Kerndorff and Schnitzer, 1980). Full sorption capacity of peat is pre-sumably reached in seconds (Bunzl et al., 1976), and the dif-fering sorption behavior of Hg and Zn may play a role in the reaction potential of NO−2 with OM. It has been demon-strated that Hg introduced into peat soil leads to sorption of Hg ions to various functional groups, including phenols (Drexel et al., 2002; Xia et al., 1998). Hence, it is plausible that Hg sorbed to functional groups subject to electrophilic attack by NO+ (e.g., nitrosophenol, Scheme 1) may ham-per nitrosation, and therefore protect OM from reacting with
NO−2. This could lead to a selective suppression of the OM-dependent N2O production pathway.
Chloroform fumigation resulted in potential N2O
pro-duction rates within the lower propro-duction range treatments with minor differences in Fe speciation and DOM fluores-cence. However, unlike the other sterilized samples, CHCl3
-fumigated samples showed enhanced CO2production
stimu-lated by NO−3 addition. Removal of CHCl3from our samples
before substrate addition could have provided an opportunity for a few surviving heterotrophs to regrow and use the easily degradable organic material derived from dead cells. Indeed, chloroform can lyse cells, providing substrates for growth to CHCl3-resistant microorganisms (Zelles et al., 1997).
Con-tinued exoenzyme activity has been also described as a CO2
source; however, this would not include denitrification en-zymes, since no enzymes involved in the denitrification path-way are exoenzymes (Blankinship et al., 2014; Jenkinson and Powlson, 1976a). Chlorination of natural OM may prompt formation of quinones (Criquet et al., 2015), which are in-termediates in the OM-based abiotic N2O production (Thorn
and Mikita, 2000); indeed, regions of the EEMs correspond-ing to hydroquinones (Cory and McKnight, 2005) appear to be slightly higher in CHCl3treatments. The benzene
deriva-tive produced during nitrosophenol reaction with NO−2 leads to reducedπelectron delocalization (Scheme 1). Because ex-citation ofπelectrons produces fluorescence, reactions with NO−2 might be expected to reduce OM fluorescence. How-ever, the experiment duration is important, and if microbial cells indeed reproduce after the treatment, short experimen-tal periods (e.g., hours or days) or reapplication of CHCl3
might keep down the numbers of any potential denitrifiers improving the use of this method.
Autoclaved peat soil revealed abiotic N2O production rates
close to the average of the lower production range group, along with ICP-OES and fluorescence spectroscopy results that showed significant changes in Fe speciation and DOM composition. EEMs demonstrate lower values for the HIX in autoclaved peats (Table 1), consistent with fluorescence data from a study that demonstrated a decrease in the aromaticity and polycondensation of soil extracts from autoclaved soil (Berns et al., 2008). Autoclaving likely caused degradation and solubilization of insoluble humic components. The direct effects of autoclaving are very much dependent on the heat and pressure stability of the indigenous soil constituents, but the substantial soil structural changes likely introduce chem-ical artifacts that are absent in the native live soil.
4.3 Gamma irradiation is the preferred sterilization method for chemodenitrification assays
The fewest chemical artifacts were observed inγ-irradiated samples. Soil that had been exposed toγ rays showed the lowest N2O production rates, approximately one-fifth of
and yielded EEMs that were remarkably similar to those ob-tained from live soil extracts. Our measurements of sterility and respiratory activity indicated the lowest potential for bio-logical activity and hence the least amount of interference for the time period tested. We therefore confirmedγ irradiation to be a preferred method for sterilizing soil (Trevors, 1996) and for assessing abiotic N2O production potential. In
prac-tice, the long preparation time needed to reach a sufficient dose (dependent on radiation source; see Methods) was com-pensated for by the lack of chemical artifacts during the ex-periment and the reduced number of hazardous waste prod-ucts. Limited accessibility to irradiation facilities and the ab-sence of a field portable option remain the main challenges to wide distribution of this approach.
5 Conclusion
High N2O emissions occur in tropical regions with
water-saturated soils (Liengaard et al., 2014; Park et al., 2011; Pérez et al., 2001). Whether these tropical N emissions are solely biotic or have abiotic contributions is not well known because rates of chemodenitrification are not com-monly evaluated. Abiotic processes in the N cycle remain overlooked, partly due to the lack of reliable means of quan-tifying abiotic reactions. This study showed that chemodeni-trification occurs in a tropical peat soil, leading to a low to moderate fraction of N2O conversion from nitrite
amend-ment. We also demonstrated that γ irradiation is the “gold standard” for chemodenitrification assays. The application of N3to quantify abiotic N2O production is unsuitable
be-cause changes associated with the fraction of the sterilant it-self may react to form N2O and affect increased pH. CHCl3
andγ rays have slightly reducing effects on the soil Fe pool and might lead to a weak discrimination against pathways in-volving Fe as a reactant. CHCl3fumigation was another
ap-proach with limited effects on Fe chemistry that lowered the number of viable cells greatly; however, the potential for mi-crobial regrowth after CHCl3removal is its main drawback.
Autoclaving seemed to have minor disadvantages for abiotic N2O production, despite the substantial changes to soil OM.
Unlike other lab-intensive treatments, the application of Zn and Hg are amenable for field experiments; however, we observed distinct chemical artifacts when using both of these options. Care is warranted if using Zn and Hg chemical in-hibitors, which can increase Fe availability and may thus overestimate Fe-dependent abiotic N2O production rate. A
potential disadvantage of the application of toxic metals is a decrease in soil pH. We cannot exclude pH-driven effects on N intermediates; however, no major deviation in the final N2O production rate related to acidification was observed.
With the methodological evaluation presented here, we de-termined that a directed selection of approaches can allow for better constrained and more detailed studies of the role of
abiotic pathways and soil components shaping denitrification and N2O fluxes from soil ecosystems.
Data availability. All data presented in this paper are avail-able in the Figshare repository under the following DOI: https://doi.org/10.6084/m9.figshare.10043177.v1 (Buessecker, 2019).
Author contributions. HCQ and SB designed study; SB, KT, JN, KEH, JDUM, JBG, HEH, and HCQ contributed to field collec-tion, laboratory experiments, and data analysis; SB and HCQ devel-oped the first manuscript draft; and all authors contributed to final manuscript.
Competing interests. The authors declare that they have no conflict of interest.
Acknowledgements. We thank Chris Laurel, Roy Erickson, and Cathy Kochert for training and assistance with the ICP-OES anal-ysis at ASU’s Goldwater Environmental Laboratory and Steven Hart for advice on optimizing the epifluorescence microscopy. We also thank Nabil Fidai, Jaime Lopez, Analissa Sarno, and Mark Reynolds of the Cadillo Lab for their enduring support during the experimental phase. The results reported herein also benefited from collaborations and/or information exchange within NASA’s Nexus for Exoplanet System Science (NExSS) research coordina-tion network, sponsored by NASA’s Science Mission Directorate.
Financial support. This research has been supported by the Na-tional Sciences Foundation (grant no. 1355066), a NASA award (grant no. NNX15AD53G) to Hilairy E. Hartnett, and an NSF-DEB award (no. 1355066) to Hinsby Cadillo-Quiroz.
Review statement. This paper was edited by Perran Cook and re-viewed by two anonymous referees.
References
Abràmoff, M. D., Magalhães, P. J., and Ram, S. J.: Image processing with ImageJ, Laurin Publishing, Pittsfield, MA, 2004.
Afkhami, A., Madrakian, T., and Maleki, A.: Indirect Ki-netic Spectrophotometric Determination of Hydroxylamine Based on Its Reaction with Iodate, Anal. Sci., 22, 329–331, https://doi.org/10.2116/analsci.22.329, 2006.
Babbin, A. R., Bianchi, D., Jayakumar, A., and Ward, B. B.: Rapid nitrous oxide cycling in the suboxic ocean, Science, 348, 1127– 1129, https://doi.org/10.1126/science.aaa8380, 2015.
UV and fluorescence spectroscopy, J. Soil Sci., 59, 540–550, https://doi.org/10.1111/j.1365-2389.2008.01016.x, 2008. Blankinship, J. C., Becerra, C. A., Schaeffer, S. M., and Schimel,
J. P.: Separating cellular metabolism from exoenzyme activity in soil organic matter decomposition, Soil Biol. Biochem., 71, 68– 75, https://doi.org/10.1016/j.soilbio.2014.01.010, 2014. Bowler, M. W., Montgomery, M. G., Leslie, A. G. W.,
and Walker, J. E.: How azide inhibits ATP hydrolysis by the F-ATPases, P. Natl. Acad. Sci. USA, 103, 8646–8649, https://doi.org/10.1073/pnas.0602915103, 2006.
Buchwald, C., Grabb, K., Hansel, C. M., and Wankel, S. D.: Con-straining the role of iron in environmental nitrogen transforma-tions: Dual stable isotope systematics of abiotic NO−2 reduction by Fe(II) and its production of N2O, Geochim. Cosmochim. Ac.,
186, 1–12, https://doi.org/10.1016/j.gca.2016.04.041, 2016. Bunzl, K., Schmidt, W., and Sansoni, B.: Kinetics of Ion Exchange
in Soil Organic Matter. Iv. Adsorption and Desorption of Pb2+, Cu2+, Cd2+, Zn2+and Ca2+by Peat, J. Soil Sci., 27, 32–41, https://doi.org/10.1111/j.1365-2389.1976.tb01972.x, 1976. Buessecker, S.: Effects of sterilization techniques
on chemodenitrification and N2O production in
tropical peat soil microcosms, figshare, Dataset, https://doi.org/10.6084/m9.figshare.10043177.v1, 2019. Clark, F. E.: Losses of nitrogen accompanying nitrification, Trans.
Int. Soc. Soil Sci., Com. IV and V, 173–176, 1962.
Cory, R. M. and McKnight, D. M.: Fluorescence Spectroscopy Re-veals Ubiquitous Presence of Oxidized and Reduced Quinones in Dissolved Organic Matter, Environ. Sci. Technol., 39, 8142– 8149, https://doi.org/10.1021/es0506962, 2005.
Criquet, J., Rodriguez, E. M., Allard, S., Wellauer, S., Salhi, E., Joll, C. A., and von Gunten, U.: Reaction of bromine and chlorine with phenolic compounds and natural organic matter extracts – Electrophilic aromatic substitution and oxidation, Water Res., 85, 476–486, https://doi.org/10.1016/j.watres.2015.08.051, 2015. Davidson, E. A., Chorover, J., and Dail, D. B.: A mechanism
of abiotic immobilization of nitrate in forest ecosystems: the ferrous wheel hypothesis, Global Change Biol., 9, 228–236, https://doi.org/10.1046/j.1365-2486.2003.00592.x, 2003. Drexel, T. R., Haitzer, M., Ryan, J. N., Aiken, G. R., and Nagy, K.
L.: Mercury(II) Sorption to Two Florida Everglades Peats: Ev-idence for Strong and Weak Binding and Competition by Dis-solved Organic Matter Released from the Peat, Environ. Sci. Technol., 36, 4058–4064, https://doi.org/10.1021/es0114005, 2002.
Duggleby, R. G.: Analysis of enzyme progress curves by nonlinear regression, in: Methods in Enzymology, 249, 61–90, Academic Press, Cambridge, MA, 1995.
Fellman, J. B., Hood, E., and Spencer, R. G. M.: Fluorescence spec-troscopy opens new windows into dissolved organic matter dy-namics in freshwater ecosystems: A review, Limnol. Oceanogr., 55, 2452–2462, https://doi.org/10.4319/lo.2010.55.6.2452, 2010.
Gu, B., Bian, Y., Miller, C. L., Dong, W., Jiang, X., and Liang, L.: Mercury reduction and complexation by natural organic mat-ter in anoxic environments, P. Natl. Acad. Sci. USA, 108, 1–5, https://doi.org/10.1073/pnas.1008747108, 2011.
Hall, S. J. and Silver, W. L.: Iron oxidation stimulates organic mat-ter decomposition in humid tropical forest soils, Global Change Biol., 19, 2804–2813, https://doi.org/10.1111/gcb.12229, 2013.
Hutchins, C. M., Teasdale, P. R., Lee, J., and Simpson, S. L.: The effect of manipulating sediment pH on the porewater chemistry of copper- and zinc-spiked sediments, Chemosphere, 69, 1089– 1099, https://doi.org/10.1016/j.chemosphere.2007.04.029, 2007. Jenkinson, D. S. and Powlson, D. S.: The effects of biocidal treat-ments on metabolism in soil – I. Fumigation with chloroform, Soil Biol. Biochem., 8, 167–177, https://doi.org/10.1016/0038-0717(76)90001-8, 1976a.
Jenkinson, D. S. and Powlson, D. S.: The effects of bioci-dal treatments on metabolism in soil – V: A method for measuring soil biomass, Soil Biol. Biochem., 8, 209–213, https://doi.org/10.1016/0038-0717(76)90005-5, 1976b.
Jones, L. C., Peters, B., Pacheco, J. S. L., Casciotti, K. L., and Fendorf, S.: Stable Isotopes and Iron Oxide Mineral Products as Markers of Chemodenitrification, Environ. Sci. Technol., 49, 3444–3452, https://doi.org/10.1021/es504862x, 2015.
Jun, L. A. B., Gilmour, C. M., and Bollen, W. B.: Non-biological Reduction of Nitrite in Soil, Nature, 225, 664–664, https://doi.org/10.1038/225664a0, 1970.
Kampschreur, M. J., Kleerebezem, R., de Vet, W. W. J. M., and van Loosdrecht, M. C. M.: Reduced iron induced nitric ox-ide and nitrous oxox-ide emission, Water Res., 45, 5945–5952, https://doi.org/10.1016/j.watres.2011.08.056, 2011.
Kappelmeyer, U., Kuschk, P., and Stottmeister, U.: Model Ex-periments on the Influence of Artificial Humic Compounds on Chemodenitrification, Water Air Soil Pollut., 147, 317–330, https://doi.org/10.1023/A:1024518027312, 2003.
Kerndorff, H. and Schnitzer, M.: Sorption of metals on humic acid, Geochim. Cosmochim. Ac., 44, 1701–1708, https://doi.org/10.1016/0016-7037(80)90221-5, 1980.
Lähteenoja, O., Ruokolainen, K., Schulman, L., and Al-varez, J.: Amazonian floodplains harbour minerotrophic and ombrotrophic peatlands, CATENA, 79, 140–145, https://doi.org/10.1016/j.catena.2009.06.006, 2009.
Lawson, I. T., Jones, T. D., Kelly, T. J., Coronado, E. N. H., and Roucoux, K. H.: The Geochemistry of Amazonian Peats, Wet-lands, 34, 905–915, https://doi.org/10.1007/s13157-014-0552-z, 2014.
Liengaard, L., Figueiredo, V., Markfoged, R., Revsbech, N. P., Nielsen, L. P., Prast, A. E., and Kühl, M.: Hot moments of N2O transformation and emission in tropical soils from the
Pan-tanal and the Amazon (Brazil), Soil Biol. Biochem., 75, 26–36, https://doi.org/10.1016/j.soilbio.2014.03.015, 2014.
McCalley, C. K. and Sparks, J. P.: Abiotic Gas Formation Drives Nitrogen Loss from a Desert Ecosystem, Science, 326, 837–840, https://doi.org/10.1126/science.1178984, 2009.
McDevitt, C. A., Ogunniyi, A. D., Valkov, E., Lawrence, M. C., Kobe, B., McEwan, A. G., and Paton, J. C.: A Molecular Mechanism for Bacterial Susceptibility to Zinc, edited by: Imlay, J., PLoS Pathog., 7, 1–9, https://doi.org/10.1371/journal.ppat.1002357, 2011.
McIlvin, M. R. and Altabet, M. A.: Chemical Conversion of Nitrate and Nitrite to Nitrous Oxide for Nitrogen and Oxygen Isotopic Analysis in Freshwater and Seawater, Anal. Chem., 77, 5589– 5595, https://doi.org/10.1021/ac050528s, 2005.
https://doi.org/10.2136/sssaj1990.03615995005400010016x, 1990.
McKnight, D. M., Boyer, E. W., Westerhoff, P. K., Doran, P. T., Kulbe, T., and Andersen, D. T.: Spectrofluorometric character-ization of dissolved organic matter for indication of precursor organic material and aromaticity, Limnol. Oceanogr., 46, 38–48, 2001.
Moraghan, J. T. and Buresh, R. J.: Chemical Reduction of Nitrite and Nitrous Oxide by Ferrous Iron, Soil Sci. Soc. Am. J., 41, 47– 50, https://doi.org/10.2136/sssaj1977.03615995004100010017x, 1977.
Nelson, D. W. and Bremner, J. M.: Factors affecting chemical trans-formations of nitrite in soils, Soil Biol. Biochem., 1, 229–239, https://doi.org/10.1016/0038-0717(69)90023-6, 1969.
Ohno, T.: Fluorescence Inner-Filtering Correction for Determining the Humification Index of Dissolved Organic Matter, Environ. Sci. Technol., 36, 742–746, https://doi.org/10.1021/es0155276, 2002.
Ostrom, N. E., Gandhi, H., Trubl, G., and Murray, A. E.: Chemodenitrification in the cryoecosystem of Lake Vida, Victoria Valley, Antarctica, Geobiology, 14, 575–587, https://doi.org/10.1111/gbi.12190, 2016.
Park, J. Y. and Lee, Y. N.: Solubility and decomposition kinetics of nitrous acid in aqueous solution, J. Phys. Chem., 92, 6294–6302, https://doi.org/10.1021/j100333a025, 1988.
Park, S., Pérez, T., Boering, K. A., Trumbore, S. E., Gil, J., Marquina, S., and Tyler, S. C.: Can N2O stable
iso-topes and isotopomers be useful tools to characterize sources and microbial pathways of N2O production and
consump-tion in tropical soils?, Global Biogeochem. Cycles, 25, 1–16, https://doi.org/10.1029/2009GB003615, 2011.
Parton, W., Silver, W. L., Burke, I. C., Grassens, L., Harmon, M. E., Currie, W. S., King, J. Y., Adair, E. C., Brandt, L. A., Hart, S. C., and Fasth, B.: Global-Scale Similarities in Nitrogen Release Patterns During Long-Term Decomposition, Science, 315, 361– 364, https://doi.org/10.1126/science.1134853, 2007.
Pepper, S. E., Borkowski, M., Richmann, M. K., and Reed, D. T.: Determination of ferrous and ferric iron in aque-ous biological solutions, Anal. Chim. Acta, 663, 172–177, https://doi.org/10.1016/j.aca.2010.01.056, 2010.
Pérez, T., Trumbore, S. E., Tyler, S. C., Matson, P. A., Monas-terio, I. O., Rahn, T., and Griffith, D. W. T.: Identify-ing the agricultural imprint on the global N2O budget
us-ing stable isotopes, J. Geophys. Res.-Atmos., 106, 9869–9878, https://doi.org/10.1029/2000JD900809, 2001.
Porter, L. K.: Gaseous Products Produced by Anaerobic Reaction of Sodium Nitrite with Oxime Compounds and Oximes Synthe-sized from Organic Matter 1, Soil Sci. Soc. Am. J., 33, 696–702, https://doi.org/10.2136/sssaj1969.03615995003300050023x, 1969.
Raczy´nska, E. D., Krygowski, T. M., Zachara, J. E., O´smi-ałowski, B., and Gawinecki, R.: Tautomeric equilibria, H-bonding and π-electron delocalization in o-nitrosophenol. A B3LYP/6-311+G(2df,2p) study, J. Phys. Org. Chem., 18, 892– 897, https://doi.org/10.1002/poc.963, 2005.
Rogers, R. D.: Abiological Methylation of
Mer-cury in Soil 1, J. Environ. Qual., 6, 463–467, https://doi.org/10.2134/jeq1977.00472425000600040029x, 1977.
Stedman, G.: Mechanism of the azide–nitrite reaction – Part II, J. Chem. Soc., 2949–2954, https://doi.org/10.1039/JR9590002949, 1959.
Stedmon, C. A., Markager, S., and Bro, R.: Tracing dissolved organic matter in aquatic environments using a new ap-proach to fluorescence spectroscopy, Mar. Chem., 82, 239–254, https://doi.org/10.1016/S0304-4203(03)00072-0, 2003. Stevenson, F. J., Harrison, R. M., Wetselaar, R., and Leeper, R.
A.: Nitrosation of Soil Organic Matter: III. Nature of Gases Produced by Reaction of Nitrite with Lignins, Humic Sub-stances, and Phenolic Constituents Under Neutral and Slightly Acidic Conditions 1, Soil Sci. Soc. Am. J., 34, 430–435, https://doi.org/10.2136/sssaj1970.03615995003400030024x, 1970.
Stiefel, P., Schmidt-Emrich, S., Maniura-Weber, K., and Ren, Q.: Critical aspects of using bacterial cell viability assays with the fluorophores SYTO9 and propidium iodide, BMC Microbiology, 15, 36, https://doi.org/10.1186/s12866-015-0376-x, 2015. Stumm, W. and Morgan, J. J. (Eds.): Aquatic Chemistry, 3rd ed.,
John Wiley & Sons, Hoboken, NJ, 2012.
Thorn, K. A. and Mikita, M. A.: Nitrite Fixation by Humic Sub-stances Nitrogen-15 Nuclear Magnetic Resonance Evidence for Potential Intermediates in Chemodenitrification, Soil Sci. Soc. Am. J., 64, 568–582, https://doi.org/10.2136/sssaj2000.642568x, 2000.
Thorn, K. A., Younger, S. J., and Cox, L. G.: Order of Functionality Loss during Photodegradation of Aquatic Humic Substances, J. Environ. Qual., 39, 1416–1428, https://doi.org/10.2134/jeq2009.0408, 2010.
Trevors, J. T.: Sterilization and inhibition of microbial activity in soil, J. Microbiol. Methods, 26, 53–59, https://doi.org/10.1016/0167-7012(96)00843-3, 1996.
Tuominen, L., Kairesalo, T., and Hartikainen, H.: Comparison of Methods for Inhibiting Bacterial Activity in Sediment, Appl. En-viron. Microbiol., 60, 3454–3457, 1994.
Van Cleemput, O., Patrick, W. H., and McIlhenny, R. C.: Ni-trite Decomposition in Flooded Soil Under Different pH and Redox Potential Conditions, Soil Sci. Soc. Am. J., 40, 55– 60, https://doi.org/10.2136/sssaj1976.03615995004000010018x, 1976.
Veverica, T. J., Kane, E. S., Marcarelli, A. M., and Green, S. A.: Ionic Liquid Extraction Unveils Previously Occluded Humic-Bound Iron in Peat Soil Pore Water, Soil Sci. Soc. Am. J., 80, 771–782, https://doi.org/10.2136/sssaj2015.10.0377, 2016. Wilson, H. F. and Xenopoulos, M. A.: Effects of agricultural land
use on the composition of fluvial dissolved organic matter, Nat. Geosci., 2, 37–41, https://doi.org/10.1038/ngeo391, 2009. Wolf, D. C., Dao, T. H., Scott, H. D., and Lavy, T. L.:
Influ-ence of Sterilization Methods on Selected Soil Microbiological, Physical, and Chemical Properties, J. Environ. Qual., 18, 39– 44, https://doi.org/10.2134/jeq1989.00472425001800010007x, 1989.
Wullstein, L. H. and Gilmour, C. M.: Non-enzymatic Formation of Nitrogen Gas, Nature, 210, 1150–1151, https://doi.org/10.1038/2101150a0, 1966.
Soil Humic Substances, Environ. Sci. Technol., 33, 257–261, https://doi.org/10.1021/es980433q, 1998.
Zelles, L., Palojärvi, A., Kandeler, E., Von Lützow, M., Winter, K., and Bai, Q. Y.: Changes in soil microbial properties and phospho-lipid fatty acid fractions after chloroform fumigation, Soil Biol. Biochem., 29, 1325–1336, 1997.
Zheng, W., Liang, L., and Gu, B.: Mercury Reduction and Oxidation by Reduced Natural Organic Matter in Anoxic Environments, Environ. Sci. Technol., 46, 292–299, https://doi.org/10.1021/es203402p, 2011.
Zhu, X., Silva, L. C. R., Doane, T. A., and Horwath, W. R.: Iron: The Forgotten Driver of Nitrous Oxide Production in Agricul-tural Soil, edited by: Bond-Lamberty, B., PLOS ONE, 8, e60146, https://doi.org/10.1371/journal.pone.0060146, 2013.