Open Access
Technical Note
Calculation of Splicing Potential from the Alternative Splicing
Mutation Database
Jason M Bechtel
1, Preeti Rajesh
2,3, Irina Ilikchyan
4, Ying Deng
5,
Pankaj K Mishra
2, Qi Wang
5, Xiaochun Wu
2, Kirill A Afonin
4,
William E Grose
2, Ye Wang
4, Sadik Khuder
1,6and Alexei Fedorov*
1,6Address: 1Program in Bioinformatics and Proteomics/Genomics, University of Toledo Health Science Campus, Toledo, Ohio 43614, USA, 2Dept.
of Medical Microbiology and Immunology, University of Toledo Health Science Campus, Toledo, Ohio 43614, USA, 3Dept. of Basic
Pharmaceutical Sciences, South Carolina College of Pharmacy, University of South Carolina, Columbia, South Carolina 29208, USA, 4Department
of Biological Sciences, Bowling Green State University, Bowling Green, Ohio 43403, USA, 5College of Engineering, University of Toledo, Toledo,
Ohio 43606, USA and 6Dept. of Medicine, University of Toledo Health Science Campus, Toledo, Ohio 43614, USA
Email: Jason M Bechtel - [email protected]; Preeti Rajesh - [email protected]; Irina Ilikchyan - [email protected]; Ying Deng - [email protected]; Pankaj K Mishra - [email protected]; Qi Wang - [email protected];
Xiaochun Wu - [email protected]; Kirill A Afonin - [email protected]; William E Grose - [email protected]; Ye Wang - [email protected]; Sadik Khuder - [email protected]; Alexei Fedorov* - [email protected]
* Corresponding author
Abstract
Background: The Alternative Splicing Mutation Database (ASMD) presents a collection of all known mutations inside human exons which affect splicing enhancers and silencers and cause changes in the alternative splicing pattern of the corresponding genes.
Findings: An algorithm was developed to derive a Splicing Potential (SP) table from the ASMD information. This table characterizes the influence of each oligonucleotide on the splicing effectiveness of the exon containing it. If the SP value for an oligonucleotide is positive, it promotes exon retention, while negative SP values mean the sequence favors exon skipping. The merit of the SP approach is the ability to separate splicing signals from a wide range of sequence motifs enriched in exonic sequences that are attributed to protein-coding properties and/or translation efficiency. Due to its direct derivation from observed splice site selection, SP has an advantage over other computational approaches for predicting alternative splicing.
Conclusion: We show that a vast majority of known exonic splicing enhancers have highly positive cumulative SP values, while known splicing silencers have core motifs with strongly negative cumulative SP values. Our approach allows for computation of the cumulative SP value of any sequence segment and, thus, gives researchers the ability to measure the possible contribution of any sequence to the pattern of splicing.
Background
One of the key regulators of alternative splicing is a large variety of short sequence motifs inside exons known as
exonic splicing enhancers (ESE) and exonic splicing silencers (ESS). These regulatory sequences have been characterized by several experimental techniques [1-5]
Published: 26 February 2008
BMC Research Notes 2008, 1:4 doi:10.1186/1756-0500-1-4
Received: 6 February 2008 Accepted: 26 February 2008
This article is available from: http://www.biomedcentral.com/1756-0500/1/4 © 2008 Bechtel et al; licensee BioMed Central Ltd.
and also by different computational approaches [6-14]. Despite this progress, one still can not predict predisposi-tion to alternative splicing from genomic data. In this respect, a set of mutations known to be associated with alternative splicing effects (reviewed by [15,5]) is a valua-ble raw material for the investigation of the fine regula-tion of splicing. A novel database of these mutaregula-tions, named the Alternative Splicing Mutation Database (ASMD), is described in the accompanying paper [16]. The ASMD represents a collection of human exon sequences with internal mutations that change the bal-ance of alternatively spliced mRNA isoforms or cause the appearance of new mRNA isoforms. The ASMD includes only those mutations that change exonic enhancers and silencers and does not encompass those that change splice sites. Here we present a novel statistical approach for processing ASMD mutational datasets, converting them into a table of "Splicing Potential" (SP) values for every possible short oligonucleotide. If the SP value for an oli-gonucleotide is positive, it promotes exon retention, while negative SP values mean the sequence favors exon skipping. SP appears to be a valuable tool for evaluating the influence of a given sequence on splicing, for finding and testing putative ESE and ESS motifs, and for predict-ing the effect of a given mutation on splicpredict-ing.
Algorithm for calculation of Splicing Potential
Our SP algorithm processes all oligonucleotides that appear and disappear in the mutations described in the ASMD. Due to the limited size of the current ASMD data-set, we only calculate SP values for triplets. For example, the mutation (G -> T) in the 14th exon of the gene BRCA1
(entry '10asmd') occurs in the exonic region gctGagt -> gct-Tagt (mutation site is in the middle and is shown in capi-tal letters). This mutation generates three new triplets (ctT, tTa, and Tag) and, at the same time, eliminates three tri-plets from the wild-type sequence (ctG, tGa, and Gag). The splicing effect of this mutation is SE = -1, meaning that this mutation causes the 14th exon to be skipped in all
gene transcripts. Because the wild-type triplets ctG, tGa, and Gag strengthen splicing of the exon, the algorithm increases their potential values by the value SPi = log10(w), where w = 1+abs(SE) and index i is the case identifier. In this example, SE is equal to -1, and thus w = 2. In our algo-rithm, w is simply the weight factor that awards more impact to those mutations that cause more dramatic changes in splicing patterns. In addition, because of the mutant triplets (ctT, tTa, and Tag) weaken the splicing of the exon, the algorithm decreases their SP values by the same value of SPi = -log10(w). The final potential value for a particular triplet xyz is the sum of SPi(xyz) for all cases in the ASMD where this triplet appears/disappears due to mutations. Finally, to make the SP values independent of the ASMD sample size, we normalize them by the
stand-ard deviation of SP values (σSP). Thus, final SP values are calculated by the formula:
SP(xyz) = sum(SPi(xyz))/σSP. (1)
We compared SP(xyz) with the coding potential, CP(xyz), for the triplet xyz, which was calculated by one of the sim-plest forms using equation:
CP(xyz) = log10(Fc(xyz)/Fi(xyz))/σCP, (2)
where Fc(xyz) is the frequency of the triplet xyz inside cod-ing exonic regions, and Fi(xyz) is the frequency of xyz
inside introns. Throughout this study we multiplied all SP and CP values by 0.243, the σCP for the entire sample of non-redundant human genes. If CP(xyz) has a positive value, the xyz triplet is more abundant in exons versus introns. When CP(xyz) is negative, the opposite is true and xyz is more abundant in introns. There are several much more advanced formulas for computing CP, which take into account additional information such as reading frames, exon length, overall genome composition, etc. [17,18]. Usually these approaches use advanced statistics, such as Markov models. However, for proper and ade-quate comparison of our initial data of SP values versus CP values we deliberately used formula (2). Both formula (2) and (1) do not account for reading frames and other genomic peculiarities. Such restrictions are appropriate for the limited size of the current ASMD dataset.
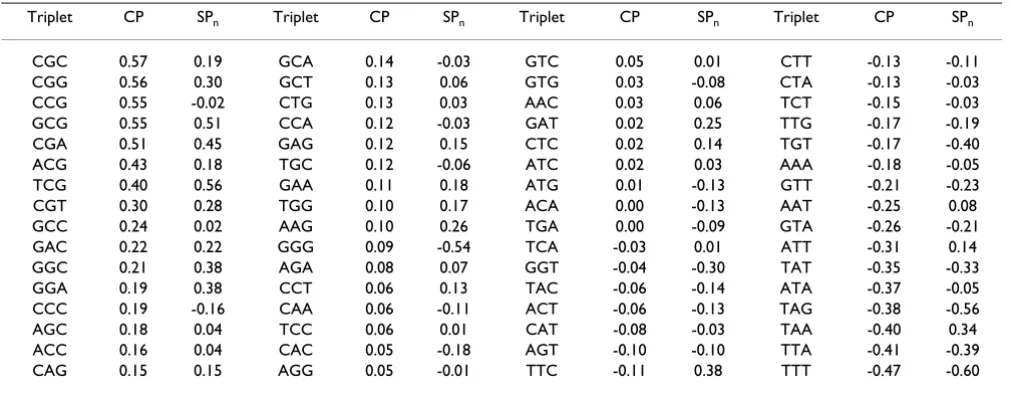
The SP and CP values for all 64 triplets are shown in Table 1. The more positive the SP value of the triplet, the more frequently its appearance is associated with retention of the exon containing it. Conversely, the more negative the SP value, the more frequently its inclusion is associated with exon skipping. Table 1 reveals a considerable Pear-son correlation (r = 0.59) between coding potential (CP) and splicing potential (SP) values of triplets. A majority of triplets with positive CP values (meaning that their fre-quency in exons is greater than introns) also have positive SP values, while triplets with negative CP values fre-quently have negative SP values. However, the SP and CP values of a given triplet can differ significantly (for instance, see triplets ccg, ccc, ggg, taa, att).
Testing of SP values of splicing enhancers and
silencers
values of these triplets is 0.89 and the value per triplet is 0.89/8 = 0.11.
Table 2 presents a list of experimentally-determined non-redundant ESE sequences that have also been evaluated by another computational approach in Down et al. [9]. We do not consider ESEs with ambiguous bases in their internal regions (for instance, tgcngyy sequence) because even a single nucleotide substitution in the analyzed motif could dramatically change its cumulative SP value. All ESEs in Table 2 have high, positive, cumulative SP val-ues. Their average cumulative SP value per triplet is 0.17.
Table 3 presents the consensus sequences of computer-predicted and verified ESE motifs obtained with the RES-CUE-ESE method [11]. Eight out of ten of these RESCUE-ESE sequences also have positive cumulative SP values. Yet, the average SP per triplet (0.07) of these ten RESCUE-ESEs is much less than that of the experimentally-deter-mined ESEs (0.17). Two out of ten RESCUE-ESE sequences have negative SP values (motifs #2 and #7, Table 3). Through the use of a different computational approach utilizing a machine learning strategy, these two
motifs have also been shown to insignificantly impact splicing, or have "negative status," according to Down, et al. [9]. We also processed the total list of 238 putative RES-CUE-ESE human splicing enhancers from the Hollywood exon annotation database [19]. The average SP value per triplet for this list is 0.08. 200 ESEs from this list have pos-itive cumulative SP values and 38 are negative.
[image:3.612.54.559.100.296.2]Table 4 presents experimentally verified ESS sequences from the RegRNA database [20]. We do not include very long (>50 nt) and very short (<5 nt) ESSs. We also excluded a controversial GAAGAAGA silencer motif because it overlaps with the well-known ESE motif AAGAA, as well as ESE #5 from Table 3. Table 4 demon-strates that three out of five of these ESSs have negative cumulative SP values. However, all ESSs from this list have core sequences (shown in bold) with highly negative cumulative SP values (shown in the last column in Table 4).
Table 1: List of 64 triplets and their CP and SP values calculated for human genes.
Triplet CP SPn Triplet CP SPn Triplet CP SPn Triplet CP SPn CGC 0.57 0.19 GCA 0.14 -0.03 GTC 0.05 0.01 CTT -0.13 -0.11 CGG 0.56 0.30 GCT 0.13 0.06 GTG 0.03 -0.08 CTA -0.13 -0.03 CCG 0.55 -0.02 CTG 0.13 0.03 AAC 0.03 0.06 TCT -0.15 -0.03 GCG 0.55 0.51 CCA 0.12 -0.03 GAT 0.02 0.25 TTG -0.17 -0.19 CGA 0.51 0.45 GAG 0.12 0.15 CTC 0.02 0.14 TGT -0.17 -0.40 ACG 0.43 0.18 TGC 0.12 -0.06 ATC 0.02 0.03 AAA -0.18 -0.05 TCG 0.40 0.56 GAA 0.11 0.18 ATG 0.01 -0.13 GTT -0.21 -0.23 CGT 0.30 0.28 TGG 0.10 0.17 ACA 0.00 -0.13 AAT -0.25 0.08 GCC 0.24 0.02 AAG 0.10 0.26 TGA 0.00 -0.09 GTA -0.26 -0.21 GAC 0.22 0.22 GGG 0.09 -0.54 TCA -0.03 0.01 ATT -0.31 0.14 GGC 0.21 0.38 AGA 0.08 0.07 GGT -0.04 -0.30 TAT -0.35 -0.33 GGA 0.19 0.38 CCT 0.06 0.13 TAC -0.06 -0.14 ATA -0.37 -0.05 CCC 0.19 -0.16 CAA 0.06 -0.11 ACT -0.06 -0.13 TAG -0.38 -0.56 AGC 0.18 0.04 TCC 0.06 0.01 CAT -0.08 -0.03 TAA -0.40 0.34 ACC 0.16 0.04 CAC 0.05 -0.18 AGT -0.10 -0.10 TTA -0.41 -0.39 CAG 0.15 0.15 AGG 0.05 -0.01 TTC -0.11 0.38 TTT -0.47 -0.60
[image:3.612.314.553.596.728.2]The triplets are sorted based on their CP value starting from the maximal one.
Table 2: SP values of experimentally-determined exonic splicing enhancers.
No ESE Cum SP value SP per triplet SR protein
1 aggacagagc 0.89 0.11 ASF/SF2 2 aggacgaagc 1.71 0.21 ASF/SF2 3 rgaagaac 0.97 0.16 ASF/SF2 4 acgcgca 1.04 0.21 ASF/SF2 5 cctcgtcc 1.13 0.19 SRp20
6 acgaggay 1.39 0.23 9G8
7 aggagat 0.85 0.17 SC35
Table 3: SP values of RESCUE-predicted exonic splicing enhancers.
No RESCUE-ESE Cum SP SP per triplet
1 atcttc 0.27 0.07
2 actaca -0.43 -0.11
3 ttggat 0.60 0.15
4 gaatca 0.30 0.08
5 gaagaa 0.69 0.17
6 ttcaga 0.62 0.15
7 gacaaa -0.07 -0.02
8 ctgaag 0.38 0.10
9 aatcca 0.09 0.02
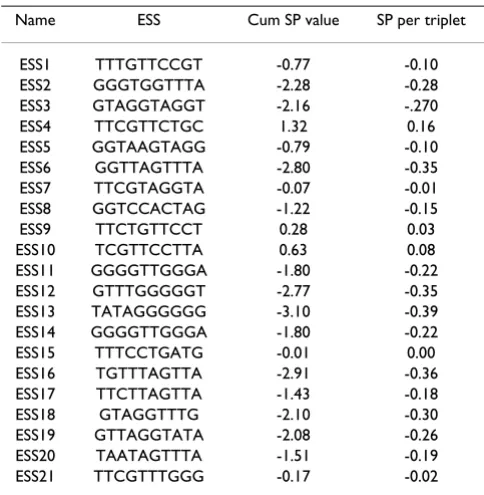
[image:3.612.53.292.625.728.2]Finally, Table 5 presents a list of 21 in vitro selected puta-tive ESSs published by Wang et al. [10]. Eighteen ESSs from this table have negative SP values, while two sequences have slightly positive SP values and only one sequence (ESS4) stands apart with a highly positive SP value (0.16 per triplet). The average cumulative SP for this group of 21 putative ESS is -0.17.
All in all we see a strong tendency for ESE to have positive cumulative SP-values and for core sequences of ESS to have negative cumulative SP-values. Therefore, this approach could be used for evaluation of a broad range of sequences for their contribution to the pre-mRNA splicing process.
Testing the ability of SP to distinguish exons and
introns
The capability of the SP and CP to distinguish between exons and introns has been examined. The complete sets of triplets composing each single exon and intron have been obtained (a sequence of L nucleotides is represented
[image:4.612.53.554.100.182.2]by (L-2) triplets). The average SP and CP values of exons and introns were calculated by summing the all triplet val-ues and dividing by the number of triplets. The distribu-tions of average SP and CP values per length for exons (red curve) and introns (blue curve) are shown in Fig. 1.
Table 4: SP values of experimentally-determined exonic splicing silencers.
No Name ESS Cum SP value SP per triplet Core Cum SP value
1 R0624 agatcctagactagagcct -0.12 -0.01 -1.31
2 R0628 ccaagtcaaaatttac -1.09 -0.08 -1.12
3 R0629 tgtggg -0.86 -0.22 -0.86
4 R0632 agatccattcgattagtgaa 1.18 0.06 -1.23
[image:4.612.312.554.298.605.2]5 R0634 taagtgttctgagct 0.34 0.03 -0.82
Table 5: SP values of in vitro selected exonic splicing silencers.
Name ESS Cum SP value SP per triplet
ESS1 TTTGTTCCGT -0.77 -0.10 ESS2 GGGTGGTTTA -2.28 -0.28 ESS3 GTAGGTAGGT -2.16 -.270 ESS4 TTCGTTCTGC 1.32 0.16 ESS5 GGTAAGTAGG -0.79 -0.10 ESS6 GGTTAGTTTA -2.80 -0.35 ESS7 TTCGTAGGTA -0.07 -0.01 ESS8 GGTCCACTAG -1.22 -0.15 ESS9 TTCTGTTCCT 0.28 0.03 ESS10 TCGTTCCTTA 0.63 0.08 ESS11 GGGGTTGGGA -1.80 -0.22 ESS12 GTTTGGGGGT -2.77 -0.35 ESS13 TATAGGGGGG -3.10 -0.39 ESS14 GGGGTTGGGA -1.80 -0.22 ESS15 TTTCCTGATG -0.01 0.00 ESS16 TGTTTAGTTA -2.91 -0.36 ESS17 TTCTTAGTTA -1.43 -0.18 ESS18 GTAGGTTTG -2.10 -0.30 ESS19 GTTAGGTATA -2.08 -0.26 ESS20 TAATAGTTTA -1.51 -0.19 ESS21 TTCGTTTGGG -0.17 -0.02
Distribution of exons and introns by average SP values (A) and average CP values (B)
Figure 1
[image:4.612.54.296.482.729.2]The overlapping area of the peaks represented by exon (blue) and intron (red) curves from Fig. 1 is 1.5 times smaller for the average SP values (46% overlap) than for the average CP values (68% overlap). Moreover, the SP values are significantly less variable than the CP values, which enhances the discriminating ability of SP in statis-tical tests (such as the t-test).
We also examined the distribution of average SP and CP values in the alternatively spliced exons of humans. Fig. 1 shows the distribution of average SP and CP values in a special case of alternative splicing – skipped exons with high skipping/retaining ratio (shown as green curves). Fig. 1A demonstrates that average SP values of skipped exons is very similar to constitutive exons (95% of curves over-lapping), yet the curve for skipped exons has a slight, con-sistent shift toward the intron curve for every data point. The corresponding data for average CP-value curves (Fig. 1B) are not as smooth. There are several intersections between the average CP curves for skipped and constitu-tive exons. Thus the CP data is less amenable to interpre-tation.
Discussion
Splicing Potential is a statistical approach for evaluating the involvement of oligonucleotides in splicing that is based solely on the ASMD dataset. HIt For each mutation we study the entire group of triplets overlapping this mutation because we do not know their individual contri-butions to splicing. Plausibly, a number of the triplets in these groups have no significant effect on splicing. These sequences produce statistical "noise," appearing in our processing algorithm in one set of instances as splicing enhancers (having positive SPi values) and in other cases as splicing silencers (with negative SPi values). Collecting more data on splicing mutations should statistically resolve such irrelevant oligonucleotides, bringing their SP values closer to zero.
Enlarging the ASMD dataset will present the opportunity to compute the SP values for larger oligonucleotides. To generate a reliable SP table for 4-mer nucleotides we need to know at least 250 mutations that affect splicing; for 5-mers, 800 mutations; and for 6-5-mers, at least 3000 muta-tions. It is well known that the predictive power of the coding potential (CP) increases dramatically with longer oligonucleotides: (n+1)-mers are always much better than n-mers, and 6-mers are the most commonly used oligonu-cleotides in real-world computations [21]. By analogy, we expect that the predictive power of SP will dramatically increase when SP values for longer oligonucleotides (up to 6-mers) have been computed.
We currently operate with the small set of 115 mutations in the ASMD. Even this limited dataset demonstrated an
impressive trend in distinguishing between exonic and intronic sequences and also a very small, yet consistent, difference between constitutive and skipping exons. The SP values of triplets obtained on only 115 mutations is 1.5 times better at the separation of exons and introns com-pared to the analysis of triplet frequencies using Coding Potential. Further expansion of the ASMD dataset should dramatically increase the accuracy of the SP values and add power to this new tool for the prediction of exon/ intron gene structures and, hopefully, alternative splicing.
Supplementary Methods can be found in Additional file1.
Availability and requirements
Project name: Splicing Potential
Project home page: http://mco321125.meduohio.edu/ ~jbechtel/asmd/
Operating system(s): Platform-independent
Programming Language: Perl
Other requirements: a Perl 5 interpreter
License: GNU GPL v3
Restrictions to use by non-academics: None (not appli-cable under GPL)
Competing interests
The authors declare that they have no competing interests.
Authors' contributions
The Splicing Potential algorithm was conceptualized and developed by JMB, PR, II, YD, PKM, QW, XW, KAA, WEG, YW, and AF. SK was responsible for all statistical analyses. AF supervised the project, provided guidance, and wrote the draft. All authors have read and approved the final manuscript.
Additional material
Acknowledgements
This project is supported by NSF Career grant MCB-0643542, "Investiga-tion of intron cellular roles".
Additional file 1
Supplementary Methods.Click here for file
Publish with BioMed Central and every scientist can read your work free of charge
"BioMed Central will be the most significant development for disseminating the results of biomedical researc h in our lifetime."
Sir Paul Nurse, Cancer Research UK
Your research papers will be:
available free of charge to the entire biomedical community
peer reviewed and published immediately upon acceptance
cited in PubMed and archived on PubMed Central
yours — you keep the copyright
Submit your manuscript here:
http://www.biomedcentral.com/info/publishing_adv.asp
BioMedcentral
References
1. Wang Z, Xiao X, Van Nostrand E, Burge CB: General and specific functions of exonic splicing silencers in splicing control. Mol Cell 2006, 23:61-70.
2. Tian H, Kole R: Selection of novel exon recognition elements from a pool of random sequences. Mol Cell Biol 1995,
15:6291-6298.
3. Coulter LR, Landree MA, Cooper TA: Identification of a new class of exonic splicing enhancers by in vivo selection. Mol Cell Biol 1997, 17:2143-2150.
4. Liu HX, Zhang M, Krainer AR: Identification of functional exonic splicing enhancer motifs recognized by individual SR pro-teins. Genes Dev 1998, 12:1998-2012.
5. Valentine CR: The association of nonsense codons with exon skipping. Mutat Res 1998, 411:87-117.
6. Zhang XH, Leslie CS, Chasin LA: Computational searches for splicing signals. Methods 2005, 37:292-305.
7. Zhang XH, Kangsamaksin T, Chao MS, Banerjee JK, Chasin LA: Exon inclusion is dependent on predictable exonic splicing enhanc-ers. Mol Cell Biol 2005, 25:7323-7332.
8. Stadler MB, Shomron N, Yeo GW, Schneider A, Xiao X, Burge CB:
Inference of splicing regulatory activities by sequence neigh-borhood analysis. PLoS Genet 2006, 2:e191.
9. Down TA, Leong B, Hubbard TJP: A machine learning strategy to identify candidate binding sites in human protein-coding sequence. BMC Bioinformatics 2006, 7:419.
10. Wang Z, Bolish ME, Yeo G, Tung V, Mawson M, Burge CB: System-atic identification and analysis of exonic splicing silencers.
Cell 2004, 119:831-845.
11. Fairbrother WG, Yeh RF, Sharp PA, Burge CB: Predictive identifi-cation of exonic splicing enhancers in human genes. Science
2002, 297:1007-1013.
12. Fedorov A, Saxonov S, Fedorova L, Daizadeh I: Comparison of intron-containing and intron-lacking genes elucidates puta-tive exonic splicing enhancers. Nucleic Acids Res 2001,
29:1464-1469.
13. Cartegni L, Wang J, Zhu Z, Zhang MQ, Krainer AR: ESEfinder: A web resource to identify exonic splicing enhancers. Nucleic Acids Res 2003, 31:3568-3571.
14. Pertea M, Mount SM, Salzberg SL: A computational survey of can-didate exonic splicing enhancer motifs in the model plant Arabidopsis thaliana. BMC Bioinformatics 2007, 8:159.
15. Cartegni L, Chew SL, Krainer AR: Listening to silence and under-standing nonsense: exonic mutations that affect splicing. Nat Rev Genet 2002, 3:285-298.
16. Bechtel JM, Rajesh P, Ilikchyan I, Deng Y, Mishra PK, Wang Q, Wu X, Afonin KA, Grose WE, Wang Y, Khuder S, Fedorov A: The Alter-native Splicing Mutation Database: a hub for investigations of alternative splicing using mutational evidence. BMC Res Notes in press.
17. Frishman D, Mironov A, Mewes HW, Gelfand M: Combining diverse evidence for gene recognition in completely sequenced bacterial genomes. Nucleic Acids Res 1998,
26:2941-2947.
18. Brocchieri L, Kledal TN, Karlin S, Mocarski ES: Predicting coding potential from genome sequence: application to betaherpes-viruses infecting rats and mice. J Virol 2005, 79:7570-7596. 19. Holste D, Huo G, Tung V, Burge CB: HOLLYWOOD: a
compar-ative relational database of alterncompar-ative splicing. Nucleic Acids Res 2006:D56-62.
20. RegRNA: A Regulatory RNA Motifs and Elements Database
[http://bidlab.life.nctu.edu.tw/RegRNA2/website/]
21. Azad RK, Borodovsky M: Probabilistic methods of identifying genes in prokaryotic genomes: connections to the HMM the-ory. Brief Bioinform 2004, 5:118-130.
22. Sakabe NJ, Vibranovski MD, de Souza SJ: A bioinformatics analysis of alternative exon usage in human genes coding for extra-cellular matrix proteins. Genet Mol Res 2004, 30:532-544. 23. Shepelev V, Fedorov A: Advances in the Exon-Intron Database