Research Report DCSF-RR048
Effective Pre-school and Primary
Education 3-11 Project (EPPE 3-11)
Pam Sammons
$, Kathy Sylva
+, Edward Melhuish
#,
Imran Siraj-Blatchford*, Brenda Taggart* and Stephen Hunt*
$
University of Nottingham, +University of Oxford
#
Birkbeck, University of London
*Institute of Education, University of London
Influences on Children’s Attainment
and Progress in Key Stage 2:
Effective Pre-school and Primary Education 3-11 Project
(EPPE 3-11)
Influences on Children’s Attainment
and Progress in Key Stage 2:
Cognitive Outcomes in Year 6
Pam Sammons
$, Kathy Sylva
+, Edward Melhuish
#Iram Siraj-Blatchford*, Brenda Taggart* and Stephen Hunt*
$
University of Nottingham,
+University of Oxford
+,
#Birkbeck, University of London
and *Institute of Education, University of London
The views expressed in this report are the authors’ and do not necessarily reflect those of the Department for Children Families and Schools
T
HE
EPPE
3-11
R
ESEARCH
T
EAM
Principal Investigators
Professor Kathy Sylva
Department of Educational Studies, University of Oxford 00 44 (0)1865 274 008 / email kathy.sylva@edstud.ox.ac.uk
Professor Edward Melhuish
Institute for the Study of Children, Families and Social Issues Birkbeck University of London
00 44 (0)207 079 0834 / email e.melhuish@bbk.ac.uk
Professor Pam Sammons
School of Education, University of Nottingham
00 44 (0)115 951 4434 / email pam.sammons@nottinghham.ac.uk
Professor Iram Siraj-Blatchford
Institute of Education, University of London
00 44 (0)207 612 6218 / email i.siraj-blatchford@ioe.ac.uk
*Brenda Taggart
Institute of Education, University of London
00 44 (0)207 612 6219 / email b.taggart@ioe.ac.uk
Research Officers
Dr Sofka Barreau
Institute of Education, University of London
00 44 (0)207 612 6608 / email s.barreau@ioe.ac.uk
Olga Cara
Institute of Education, University of London 00 44 (0)207 612 6608 / email o.cara@ioe.ac.uk
Dr Helena Jelicic
Institute of Education, University of London 00 44 (0)207 612 6608 / email h.jelicic@ioe.ac.uk
Rebecca Smees
Institute of Education, University of London 00 44 (0)207 612 6608 / email r.smees@ioe.ac.uk
Dr Stephen Hunt
Institute of Education, University of London 00 44 (0)207 612 6608 / email s.hunt@ioe.ac.uk
Tracking Officer
Wesley Welcomme
Institute of Education, University of London
A
CKNOWLEDGEMENT
Contents
Page Number
Executive Summary
i
Introduction
1
Aims 2
Methods 2
Structure of Report and Analyses 3
Section 1: Characteristics of the Sample at the end of Year 6
5
Cognitive assessments 9
Associations between children‟s attainments in different outcomes and over time 10
Differences in attainment for different groups of children 10 Gender 10
Ethnicity and language 10
Parents‟ qualification level 12
Socio-economic status (SES) and eligibility for free school meals (FSM) 13
Special educational needs (SEN) 15
Multiple Disadvantage 15
Early years Home Learning Environment (HLE) 15
Pre-school 16
Primary school academic effectiveness 17
Section 2: Children’s Cognitive Attainments at the End of Year 6 in Primary School:
The Impact of Different Child, Family and Home Learning Environment (HLE)
Characteristics
19
Child measures 22
Gender 22
Birth weight 22
Family size 22
Early developmental problems 22
EAL and Ethnicity 22
Family Measures 23
Free School Meals 23
Income 23
Parent‟s highest qualification levels 23
Early years Home Learning Environment (HLE) Measures 25
Key Stage 1 Home Learning Environment (HLE) 27
Neighbourhood „influence‟ 27
Summary of Background Influences 28
Section 3: Exploring the Impact of Background Factors on Children’s Cognitive
Family Measures 30
Early years Home Learning Environment (HLE) Measures 31
Section 4: Children’s Cognitive Attainments at the end of Year 6 in Primary School:
The Impact of Pre-school and Primary School
34
The impact of pre-school experience on Year 6 attainment 34
The impact of school attendance, duration of school experience and type of
pre-school 35
The impact of pre-school centre quality 36
The impact of pre-school centre effectiveness 37
Different pre-school effects for different groups of children 39
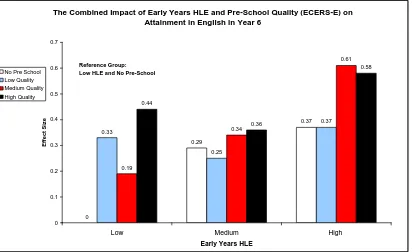
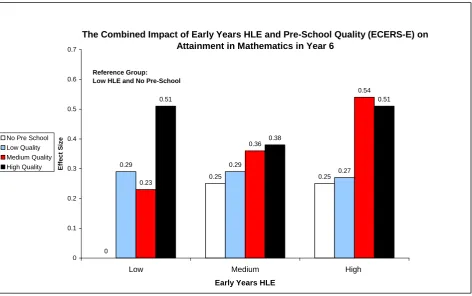
The combined impact of pre-school experience and Early years Home Learning Environment
(HLE) 39
Early years HLE and Pre-school attendance 39
Early years HLE and the Quality of the Pre-school 39
Early years HLE and Pre-school Effectiveness 41
Multiple disadvantage and the impact of pre-school experience 43
Parents‟ qualification level and the impact of pre-school experience 44
The impact of primary school effectiveness 45
Different influences of primary school effectiveness for different groups of children 49
Multiple disadvantage and the impact of primary school effectiveness 49
Parents‟ qualification level and the impact of primary school effectiveness 49
The combined impact of pre-school experience and primary school effectiveness 50
The combined impact of pre-school effectiveness and primary school effectiveness 51
Mobility during pre-school and primary school 53
Summary of Pre- and Primary School Influences 55
Section 5: Exploring Relative Cognitive Progress across Key Stage 2 between Year
2 and Year 6 of Primary School Education
56
The Impact of Child, Family and Home Learning Environment (HLE) characteristics 57
The Impact of Pre- and Primary School Experience 58
Section 6: Summary and Conclusions
62
The Impact of Child, Family and HLE characteristics 62
Educational influences 63
Implications 66
References
68
Appendix 1: EPPE Technical Papers in the series
72
Appendix 2: How accurate are the current measures as indicators of progress in
primary education?
74
Appendix 4: Raw differences in attainment in English and Mathematics at the end
of Year 6
79
Appendix 5: Details of Selected Measures used in the EPPE 3-11
81
Appendix 6: Results of contextualised multilevel analyses
83
Appendix 7: Results of Contextualised Multilevel Analyses Controlling for Prior
Attainment
94
Executive Summary
The report presents the results of analyses related to the primary school phase of a major
longitudinal study investigating the influence of pre-school and primary school on
children‟s development (EPPE 3-11) in England. Specifically, this report is concerned with
children‟s cognitive attainments at the end of Year 6 when the children were aged eleven,
and their academic progress from the age of seven to eleven: Key Stage 2. The findings
also extend and develop the findings from previous earlier ages. A report on children‟s
social/behavioural development throughout this period will be published separately
(
Sammons et al., forthcoming).
Originally the study began as the Effective Provision of Pre-school Education (EPPE)
project: a pre-school sample was recruited to the study at age 3 years and followed to the
age of seven - the end of Key Stage 1 (Year 2) in primary school. An additional „home‟
sample of children (who had not attended pre-school) was recruited at the start of primary
school. The EPPE 3-11 project is an extension of this initial research and follows the
same sample (pre-school and „home‟ children) to the end of primary schooling at age 11
years plus.
Throughout, the research has been based on an educational effectiveness design and
mixed methods approach (Sammons et al., 2005; Siraj-Blatchford et al., 2006). This is
done in order to investigate child, family and home influences on developmental outcomes
so that the relative importance of specific background influences can be studied in relation
to the strength of pre-school and primary school factors.
EPPE 3-11 has gathered a wide range of data on children‟s development, child, family,
home learning environment (HLE), and pre-school characteristics. Additional value added
measures of primary schools derived from multilevel statistical analyses of National
assessment data for all primary schools in England (Melhuish et al., 2006a; 2006b) are
also used to provide independent indicators of the academic effectiveness
1of primary
schools. These are used to complement the measures of quality
2and effectiveness
3for
pre-school settings. It is therefore possible to explore both pre-school and primary school
influences on children‟s outcomes in Year 6.
Standardised measures of National assessments in English
4and Mathematics have been
used to provide measures of children‟s educational outcomes in Year 2 and again in Year
1
Independent indicators of primary school academic effectiveness were obtained from the analysis of National assessment data for several cohorts across all primary schools in England. Mean value added scores of school academic effectiveness across the years 2002 to 2004 were calculated for each primary school in England and then extracted for schools attended by children in the EPPE 3-11 sample. These value added measures provide indicators of a school‟s academic effectiveness in terms of National assessment performance.
2
Quality was measured for each pre-school centre using the aggregate score from the ECERS-E (see Glossary) across scores for the curricular activities of Literacy, Numeracy, and Science/knowledge of the world, and on Diversity of provision for children of different abilities, gender and cultures (Sylva et al., 1999).
3
Pre-school academic effectiveness: Measures of the effectiveness of individual pre-school centres were derived from value added models of the EPPE 3-11 children‟s actual progress during the pre-school period, controlling for prior attainment and pupil‟s background characteristics (Sammons et al., 2004a). That is, children‟s cognitive progress was analysed from age 3 to rising 5 years. These analyses provided measures of pre-school academic effectiveness.
6. The sample included 2701 children for whom English and/or Mathematics data were
available at these two time points drawn from over 950 primary schools.
The aims of the research were to:
Investigate any association between children‟s cognitive attainments at the end of
Key Stage 2 (Year 6, age 11) and background child, family and home learning
environment (HLE) characteristics.
Compare predictors of attainment in Key Stage 1 and 2.
Model children‟s current cognitive
attainment
in Year 6, and their
progress
over Key
Stage 2.
Identify and investigate any persisting influence of pre-school attendance, and type
of pre-school attended (against those who did not attend pre-school – the „home‟
sample).
Explore the influence of pre-school experience, particularly in terms of quality and
academic effectiveness on later cognitive outcomes.
Examine the combined impact of the Home Learning Environment (HLE) and
pre-school characteristics.
Investigate the influence of primary school academic effectiveness on cognitive
attainment and progress, when child, family and home learning environment (HLE)
characteristics have been taken into account.
Investigate the combined effect of pre-school experience and primary school
experience on cognitive attainments.
Assess whether the impact of pre and primary school differs for more and less
disadvantaged children.
The impact
5of child, family and Early years home learning environment (HLE)
Throughout the research children are grouped by individual child, family and home
learning environment (HLE) factors, such as ethnicity, Socio-Economic Status (SES) and
the Home Learning Environment (HLE) (Melhuish et al., 2008), this allows variations in
average attainment scores to be identified by sub-groups (e.g. by gender or ethnicity).
Consequently, those children for whom there is an apparent attainment gap in English and
/ or Mathematics can be identified, along with factors that are significant predictors of
academic attainment and/ or progress.
The principal statistical approach employed involves contextualised multilevel analysis
designed to identify the unique (net) contribution of specific factors, such as ethnicity, to
variation in children‟s attainments at the end of Year 6, while controlling other background
factors such as age, gender, and SES. Therefore, it can be established whether any
apparent difference in attainment is associated with certain characteristics (such as
ethnicity, is actually attributable to other socio-economic and demographic factors, such
as SES or qualifications of parents). Key findings are reported later in this Summary.
(see Section 2). A more detailed exploration of the influence of the HLE investigates
interactions between Early years HLE and pre-school effects (Section 4).
6Educational Influences
The study also investigated the combined net effects of pre-school experience and the
academic effectiveness of the primary school, exploring whether „home‟ children or pupils
who attended less effective pre-schools benefited to a greater extent than other children if
they subsequently went on to attend a more academically effective primary school. A
further question addressed whether high quality or high effective pre-school experience
provides a protective effect if children subsequently attended a primary school low on
academic effectiveness (see Section 3).
Additional value added analyses investigated pupils‟ academic progress from the end of
Year 2 to the end of Year 6 of primary school. The assessments at the end of Year 2
provided the baseline measures against which to explore relative gains in English and
Mathematics over time (see Section 4).
The importance of educational experiences in shaping outcomes at age 11 years has
been highlighted by the Year 6 analyses (Sections 3 and 4). Pre-school influences remain
evident even after six years of full-time primary school. Although the research shows that
attending a pre-school compared with not attending a pre-school predicts significantly
better outcomes in the longer term, both the quality and the effectiveness of the
pre-school setting are also found to be predictive of later cognitive outcomes. In general low
quality pre-school does not seem to improve children‟s later attainment at the end of Year
6 in primary school, whereas medium and especially high quality and effective pre-school
experience is associated with longer term benefits for the development of academic
ability, particularly in Mathematics.
The
combined
influences of pre-school and primary school effects are also examined. For
„home‟ children (the no pre-school group), there is strong evidence that the academic
effectiveness of the primary school attended helps to reduce the attainment gap
compared with children who attended pre-school. „Home‟ children who went to a less
academically effective primary school show the lowest attainment at age 11 when
controlling for other background influences. For those „home‟ children who attended a
highly academically effective primary school, there is a particular boost to Mathematics
attainment in comparison with those who attended a low effectiveness primary school. In
addition, where children attended a high quality or more effective pre-school in their early
years, this seems to act as a protective factor if they subsequently attended a less
academically effective primary school.
Key findings
The key findings are reported in terms of the three main sets of influences studied:
child/family/home learning environment (HLE) and neighbourhood effects, evidence of
continuing pre-school effects, and the contribution of the primary school attended.
6
Earlier results for this sample in Year 5 identified the size and nature of the equity gap in achievement and how it changes at different points in children‟s pre-school and school careers. This informed the
Child, Family and home learning environment (HLE)
background effects
The overall influence of background factors is generally weaker in Year 6 compared
to Year 2 for attainment in both English and Mathematics. This is likely to reflect
increased primary school and peer group influences.
Gender has become more important: girls outperform boys in English and boys
outperform girls in Mathematics.
Parents‟ (especially mothers‟) highest qualification levels, although weaker in Year
6, is a key predictor of attainment, as is low birth weight, need for support with
English as an additional language (EAL), early developmental problems (as
reported by parents at the start of the study), socio-economic status (SES) and
father‟s qualification level.
The Early years home learning environment (HLE) remains one of the most
important background factors relating to a child‟s attainment in English and
Mathematics.
Key Stage 1 HLE shows some predictive power: high levels of one-to-one
child-parent interaction have a negative impact on attainment in both English and
Mathematics, while high levels of home computing has a negative impact on
English. In both cases the child‟s activities may effectively be being replaced, e.g.
being read to rather than reading; playing computer games rather than reading.
Neighbourhood: there was no evidence of the neighbourhood exerting an
independent influence on attainment or progress, but a moderate association was
found between poor attainment in Mathematics and parental perceptions of an
„unsafe‟ neighbourhood, which is likely to be an expression of social disadvantage.
Pre-school effects
In general attending a pre-school compared with not attending (the „home‟ children)
has a positive effect on children‟s outcomes in English and Mathematics at the end
of Year 6.
Attainment in both English and Mathematics in Year 6 was enhanced by pre-school
quality. In both cases the higher the level of quality, the greater the level of
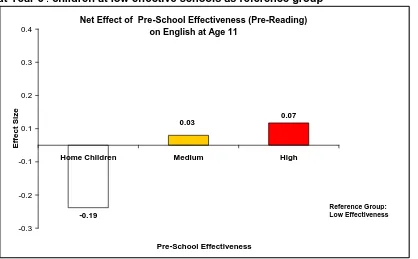
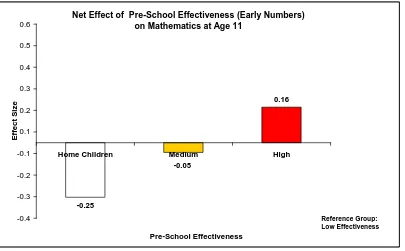
attainment. Similarly, pre-school effectiveness (defined in terms of promoting
young children‟s outcomes in Early number concepts) again showed a positive
influence on later attainment, and was particularly influential for outcomes in
Mathematics.
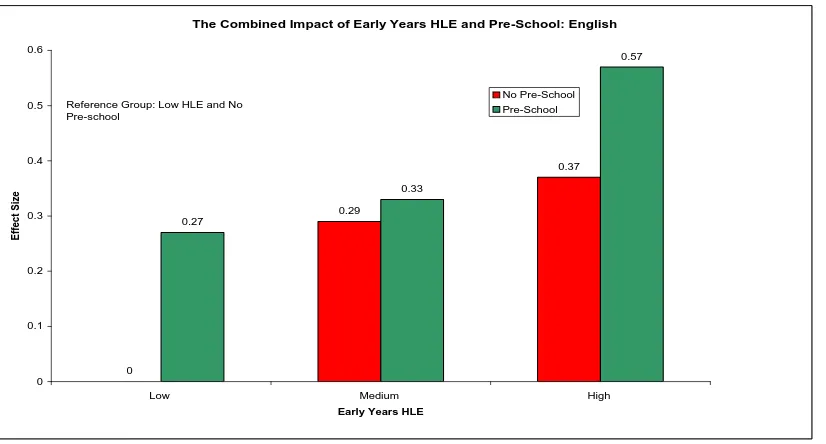
Early years home learning environment (HLE) and pre-school quality and
effectiveness: higher levels of Early years HLE compensate for the effects of
attending poorer quality or less effective pre-schools: however, the most
advantageous combination is high Early years HLE and attending a high quality/
more effective pre-school.
The attainment of more disadvantaged pupils is enhanced by having attended high
quality or highly effective pre-schools; however it is the more advantaged pupils
that gain most from attending such pre-schools.
There are clear longer term advantages from attending a pre-school irrespective of
parental qualification level, although children with parents with higher levels (a
degree or above) do better. This was also the case when considering pre-school
quality and effectiveness, although children of low qualified parents do gain an
advantage from attending high quality/effective pre-schools
.
Primary school effects
The primary school a child attends, measured in terms of academic effectiveness
7has a significant effect on children‟s English and Mathematics attainment in Year 6.
Children who had the benefit of attending a primary school identified, through the
National assessments, as academically more effective had better outcomes at age
11 than children who attended a less academically effective primary school, taking
account of other background influences.
For English, attending a high academically effective primary school was associated
with higher attainment; although having attended a high quality pre-school partially
ameliorated the effects of attending a lower effective primary school.
For Mathematics the quality of the pre-school also exercises some influence on
later attainment, but this tends to be limited by the academic effectiveness of the
primary school. Attainment in Mathematics in Year 6 appears to be more sensitive
to the academic effectiveness of the primary school compared to English.
Primary school effectiveness is a more important influence on attainment for
disadvantaged children than the more advantaged. Highly disadvantaged children
show a greater benefit than less disadvantaged children if they attend a highly
effective primary school rather than a medium or low effective primary school.
For English, children whose parents have a moderate to high qualification level,
gain higher attainment when they attend a highly effective primary school than do
children of lower qualified parents. Schools of medium effectiveness only show a
small effect compared to low effectiveness.
7
For Mathematics the primary school effectiveness is especially important for
children whose parents have a low qualification level. Of these children, compared
to those who attended low effective primary schools, children who attended highly
or medium academically effective primary schools have significantly higher average
Mathematics scores at Year 6.
The combined impact of pre-school quality and primary school effectiveness
indicates that for English the quality of the pre-school can compensate for attending
a less effective primary school. For Mathematics, the better the quality of
pre-school, the higher the attainment, and the more academically effective the primary
school, the higher the attainment.
The combined impact of pre-school effectiveness and primary school effectiveness
indicates that for both English and Mathematics attending a highly effective
pre-school can compensate for later attending a low effective primary pre-school: although
attending a highly academically effective pre-school and primary school was clearly
most advantageous.
Progress from Year 2 to Year 6
The analysis of children‟s progress in English and Mathematics over KS2 also
points to the influence of children‟s background characteristics, although these
factors have a weaker effect on value added progress than on attainment at any
given time point. Continued pre-school influences related to quality and
effectiveness are evident on pupil‟s progress in KS2 suggesting that pre-school
influence not only operates by providing an initial boost to attainment levels, but
also helps promote progress (possibly by fostering children‟s capacity to learn and
their motivation).
Children who attended more academically effective primary schools also made
more progress across KS2. This again confirms the importance of the overall
effectiveness of each primary school on children‟s educational progress as well as
on attainment levels. The school effects are stronger for progress in Mathematics
(in line with findings in other educational effectiveness studies, see Teddlie &
Reynolds 2000).
The results indicate that the combined influence of attending a better (higher quality
and high academically effective) pre-school and a more academically effective
primary school can give a significant boost to children‟s later cognitive outcomes at
age 11 years, especially for Mathematics. These effects are similar in size to the
impact of having a mother with a high qualification level (degree rather than none).
Implications
The research presented here demonstrates the extent to which individual child, family and
home learning environment (HLE) background factors continue to be significant predictors
of children‟s academic attainment and progress in Key Stage 2, and the way such
The research indicates that much of the apparent raw difference in attainment associated
with certain characteristics, for example, ethnicity, is attributable to the impact of other
socio-economic and demographic factors (e.g. birth weight, income, language, family
SES, parents‟ qualification levels and HLE). Such findings are important for policy and
practical strategies that may help to address any achievement gap and enhance
outcomes for disadvantaged or vulnerable groups. Earlier EPPE 3-11 results have
contributed to the evidence base for the Government‟s Equalities Review
http://www.theequalitiesreview.org.uk/
.
A possible effect of neighbourhood environment was examined: however, no effects were
found for its independent influence.
The research also examined the
combined
effects of pre-school and primary school on
children‟s educational outcomes. The results indicate the importance of raising the quality
and effectiveness of both to raise attainment in basic skills, especially for disadvantaged
groups of pupils who are at most risk of under achievement.
The results show that for more disadvantaged children, higher quality and highly effective
pre-school experience are still important predictors of longer-term benefits in terms of
improved English and Mathematics at age 11. For less disadvantaged groups attending
pre-school generally shows a more positive effect, irrespective of quality. The research
also reveals the strength of the influence of the Early years home learning environment
(HLE), which was found to be one of the strongest predictors of higher attainment for all
children especially for English in Year 6. This points to the important role of parents and
other carers in promoting rich home learning experiences during the pre-school period of
young children‟s development and the value of policies that support parents in this role,
and reaffirms the findings and recommendations of earlier reports on children‟s outcomes
at younger ages.
We can conclude that no one factor is the key to raising achievement – it is the
combination
of experiences over time that matters. The child who has a better Early years
home learning environment (HLE), goes to a high quality, more effective pre-school
setting and who then subsequently attends a more academically effective primary school
has an optimum combination of influences that benefit current and future educational
attainment. A parallel report (Sammons et al, 2008) investigating social/behavioural
development for the same sample in Year 6 found variations in children‟s
social/behavioural outcomes are also affected by child, family and Early years home
learning environment (HLE) characteristics, while pre-school attendance had an
identifiable positive effect on „Pro-social‟ behaviour.
In addition, improving the academic effectiveness of primary schools is important
particularly for disadvantaged groups, since attending a more academically effective
primary school matters more to these children‟s outcomes at age 11. The finding that
social/behavioural development as well as English and Mathematics can be boosted by
academically effective primary schools has important implications for the achievement of
the Every Child Matters agenda. This shows that the promotion by schools of better
academic outcomes does not compete with better social/behavioural development (a point
discussed further in the Report to the Equalities Review, EPPE 3-11 Team. 2007). The
finding that primary school academic effectiveness is a more significant influence for
disadvantaged pupils (especially those who did not go to pre-school) is highly relevant for
social inclusion and raising standards.
The analyses of children‟s National assessment results in Year 6 were broadly parallel to
those reported for attainment and progress measured by independent standardised NFER
tests conducted in Year 5 (a year with less focus on preparation for the high stakes
„SATs‟ period). The stability in findings across Years 5 and 6 using different assessments
provides further confidence in their robustness. In particular, the findings point to the
continued influence of pre-school experiences, the importance of the Early years HLE,
and the importance of the academic effectiveness of the primary school a child attends.
Introduction
EPPE 3-11 is a large-scale longitudinal study funded by the Department for Children, Schools and Families (DCSF), originally designed to investigate what kinds of early childhood provision are most „effective‟ in promoting young children‟s development during pre-school. Subsequent aims were to explore whether any pre-school effects continue to influence children during primary school and to examine primary school influences.
Initially the project tracked children from pre-school, or the start of primary school, to the end of Key Stage 1 of primary school (age 7 plus years). Measures of the quality of 141 pre-school centres were recorded from five regions across England. The centres were representative of six types of provision: nursery classes, playgroups, local authority day nurseries, private day
nurseries, nursery schools and integrated centres [i.e. combined centres that integrate education and care] (see Sammons et al., 2002; 2003). Results of analyses of children‟s outcomes in Key Stage 1 are reported by Sammons et al. (2004b; 2004c), and during Key Stage 2 (Year 5) by Sammons et al., (2007a; 2007b).8
An extension to the original EPPE pre-school study has tracked the same children‟s development to the end of Key Stage 2 (age 11). This second phase was designed to explore continuing pre-school influences as well as to investigate the effects of primary pre-school. EPPE 3-11 was the first study of pre-schools in Europe to adopt an educational effectiveness design based on sampling children in a range of different pre-school settings (centres) and used statistical approaches (multilevel modelling) that enable the identification of individual pre-school centre and school effects.
Around the age of 3 years (at entry to a target pre-school in the randomly selected sample or at their third birthday for children who had already entered provision at a younger age), children were assessed and their parents interviewed. They were then followed up at entry to primary school. In this way it has been possible to explore variations between centres in the value they added to children‟s cognitive progress and social/behavioural development. The first phase of the research explored whether different types of pre-school settings differed in their impacts and effectiveness. It also identified variations between different pre-school centres in children‟s cognitive progress and social/behavioural development.
The current report focuses on children‟s developmental progress to the end of Key Stage 2 using National assessment measures of cognitive attainment in English and Mathematics taken at two time points Year 2 (age 7+) and Year 6 (age 11+). It explores the impact of a wide variety of child, parent and family factors, including aspects of the Early years home learning environment (HLE). This information was provided by parents during the years of pre-school and aspects of the later HLE during Key Stage 1 of primary school.
The EPPE 3-11 study uses a mixed methods approach (combining qualitative and quantitative methods) and an educational effectiveness design, including detailed statistical analyses of effectiveness and in-depth case studies of individual pre-school centres (Sammons et al., 2005; Siraj-Blatchford et al., 2006). This report is based on statistical analyses for a sample of 2701 children for whom valid cognitive data was collected at the end of Year 6. This represents eighty nine per cent of the children in the EPPE 3-11 sample for whom valid baseline data was collected on cognitive attainment at entry to primary school at age 5 and an increase of 1.2 per cent of the EPPE 3-11 sample for whom valid data was collected on cognitive attainment at the end of Year 2.
This report focuses on children‟s attainment at the end of Year 6 and also measures their progress from the end of Year 2 to the end of Year 6 in primary school. Further analyses of children‟s
8
social/behavioural development and attitudes to school in Year 6 will be reported in further Research Reports.
Aims
The aims of the research were to:
Investigate any association between children‟s cognitive attainments at the end of Key Stage 2 (Year 6, age 11) and background characteristics concerning individual child, family and home learning environment (HLE).
Compare identifiable predictors of attainment in Key Stage 1 and 2.
Model children‟s current cognitive attainment in Year 6, and progress over Key Stage 2. Identify and investigate any persisting influence of school attendance, and type of
pre-school attended (and those who did not attend pre-pre-school - the „home‟ sample).
Explore the influence of pre-school process, particularly in terms of quality and academic effectiveness on later cognitive outcomes.
Examine the combined impact of the home learning environment (HLE) and pre-school characteristics.
Investigate the influence of primary school academic effectiveness on cognitive attainment and progress, when child, family and home learning environment (HLE) characteristics have been taken into account.
Investigate the combined effect of pre-school experience and primary school experience on cognitive attainments.
Assess whether the impact of pre and primary school differs for more and less disadvantaged children.
Methods
The analyses employ a range of statistical techniques from descriptive and correlation analysis to multilevel (hierarchical) modelling methods to examine the influences on children‟s cognitive attainment and progress. This paper focuses on two measures of cognitive attainment assessed with standardised National Assessment data at the end of Year 6 in English and Mathematics. At the end of Year 2 assessments of the same type had been completed, so comparable measures of prior cognitive attainments feature in the present research.
Multilevel models provide more accurate assessments of the influence of different child or primary school characteristics. Furthermore earlier analyses enabled the calculation of value added estimates (residuals) of individual centre level effects for the EPPE 3-11 child sample that attended a pre-school centre (see Sammons et al., 2002 for details). These value added measures of centre effectiveness have been included in subsequent analyses of children‟s educational outcomes, at the end of Year 6 in primary school, to establish whether the
effectiveness of the pre-school attended, in promoting children‟s cognitive development, continues to show an impact on later cognitive attainment. To examine the impact of primary school,
measures of primary school academic effectiveness in English and Mathematics have been derived from independent value added analyses of pupil progress for three successive full cohorts of children in English primary schools (2002-2004) using National assessment data sets matched between Key Stage 1 and 2 over three years (see Melhuish et al., 2006a; 2006b).
children‟s mothers, and usually took place at the child‟s pre-school centre, although for some working parents the interviews were conducted over the phone.
Subsequently parents were asked to complete a questionnaire concerning further information about child, parent and family characteristics when the children were at primary school during Key Stage 1 (KS1). Details were sought regarding any change in background information (in
employment, income, family structure, number of siblings etc.) as well as information on aspects of the home learning environment (HLE) in Key Stage 1 (KS1). Telephone surveys were used to follow up hard to reach groups using the same questionnaire schedule. The corrected response rate9 obtained was eight-one per cent (very high for a survey study).
Structure of Report and Analyses
This report is divided into six sections. The first provides background information concerning the characteristics of the EPPE 3-11 sample and investigates whether particular groups of pupils show differences in their cognitive attainments at the end of primary school education. The attainment differences reported in Section 1 are „raw‟ univariate attainment differences, whereas the effects reported in later sections are „net‟ effects.
The second section examines the extent to which different child, family and home learning environment (HLE) background characteristics account for variations in children‟s English and Mathematics attainments. The „net‟ influence of different background factors on children‟s attainments is explored using statistical techniques. Further analyses are used to identify the unique (net) contribution of particular characteristics to variation in children‟s cognitive outcomes, while other influences are controlled. Thus, for example, the influence of family Socio-Economic Status (SES) is established while taking into account the influence of mother‟s qualification level, income, ethnicity, birth weight, HLE etc. Results are reported in effect sizes (ES), a statistical measure of the relative strength of different predictors. It is of policy interest to establish the nature and strength of such background influences individually and collectively, as they are relevant to issues of equity and social inclusion.
The third section describes the extent of change in the influence of the different background factors while young children progress through primary school. Children‟s cognitive outcomes in English and Mathematics had been assessed using similar National assessments taken toward the end of Year 2 (age 7). Contextualised multilevel models were used to estimate the „net‟ impact of different background factors on cognitive attainments in both Year 2 and Year 6. Effect sizes for the different factors were calculated and a comparison between the two years was made in terms of the relative strength of influence measured by changes in the ES over the four years. This section therefore addresses the question as to whether the cognitive attainment gaps found for different groups of children have remained the same or altered between Year 2 and Year 6.
The fourth section examines the influence of pre-school and primary school experience on cognitive outcomes at the end of Year 6. In the first phase of the earlier EPPE research it was shown that pre-school experience gave children a better start to school, in terms of higher
cognitive attainments and improved social/behavioural outcomes. Lack of pre-school experience, particularly for more vulnerable groups of young children, was found to be a further disadvantage (Sammons et al., 2002; 2003). The effect of pre-school attendance was, in these analyses, supplemented with measures of school centre influence, namely the observed quality of pre-school provision (measured by the ECERS-E scale) and centre effectiveness (measured by value added residual estimates based on cognitive progress during the pre-school period). These additional features were further tested to explore any continuing effect of pre-school at the end of
9
Year 6 in primary school. This section also addresses the question of differential pre-school effects for different groups of children.
Further analyses sought to explore the predictive influence of measures of primary school
academic effectiveness10 and children‟s later cognitive outcomes in Year 6. In addition, analyses also explored whether certain groups of children benefit more (are more sensitive to) the academic effectiveness of the primary school they attended than other children. The last part of Section 4 deals with the combined impact of different characteristics of pre-school experience (quality and effectiveness) and primary school academic effectiveness.
Section 5 presents results of analyses that were conducted to explore children‟s academic progress from the end of Year 2 at primary school to the end of Year 6. Value added multilevel analyses of EPPE3-11 children‟s cognitive progress across Key Stage 1 and Key Stage 2 have been conducted, these analyses control for prior attainment (at the end of Year 2) in analysing progress over time. They are used to complement the contextualised models of attainment to establish how far background factors and educational measures of pre- and primary schools also predict progress across Key Stage 2.
The final section summarises the results drawing together the main findings and conclusions.
Section 1: Characteristics of the sample at the end of Year 6
The research design used to recruit the sample for the original EPPE study is described in detail in EPPE Technical Paper 1 (Sylva et al., 1999). In summary, six English Local Authorities (LAs) in five regions participated in the research with children drawn from six main types of pre-school provision: nursery classes, playgroups, private day nurseries, Local Authority (LA) day nurseries, nursery schools and integrated (i.e. combined centres that integrate education and care) centres. In order to enable comparison of centre and type of provision effects the project was designed to recruit 500 children, 20 in each of 20-25 centres, from the various types of provision. In some LAs certain forms of provision were less common and other forms more typical. Within each LA, centres of each type were selected by stratified random sampling and, due to the small size of some centres in the project (i.e. rural playgroups) more of these centres were sampled than originally proposed, bringing the centre sample total to 141 centres. In all 2,857 children in the pre-school sample were tracked to entry to reception. An additional sample of 315 „home‟ children (those who had not attended a pre-school setting) was recruited at entry to primary school, for comparison with those who had attended a pre-school setting, bringing the total sample to 3,172.
Since the start of the study 11 years ago, the EPPE children have been assessed in their cognitive and social/behavioural development at various time points. This report refers to two time points at which children completed cognitive assessments: at the end of Year 2 (age 7) and at the end of Year 6 (age 11). The assessments at these two time points are judged to be most comparable, because cognitive attainment was assessed with the same type of tests; National assessments that adhere to the content of the national curriculum covered in English primary schools test in Reading and Mathematics (see Appendix 2).
This section provides descriptive statistics for the sample at the end of Year 6. Details of the main findings of the analyses conducted on children‟s attainments and progress up to the end of Key Stage 1 (Year 2) can be found in Technical paper 11 (Sammons et al., 2004b) and results for Year 5 in Sammons et al. (2007a; 2007b).
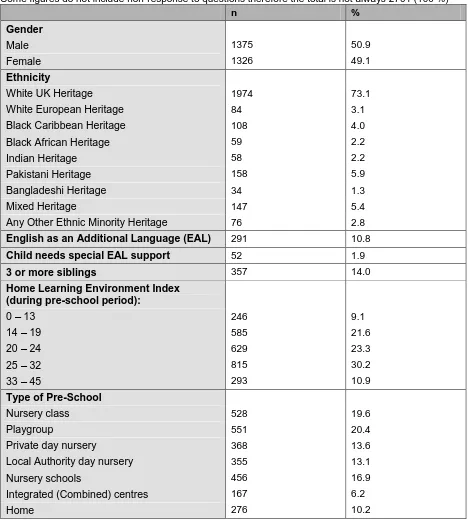
Tables 1.1a to 1.1c provide a brief summary of the characteristics of the EPPE 3-11 sample at the end of Year 6 for whom any cognitive outcome data (National assessment data in English and / or Mathematics) were collected (N = 2,690, and N = 2701 respectively).
Fifty-one per cent of the children are boys and forty-nine per cent are girls. In terms of ethnicity children of White UK heritage made up seventy three per cent of the sample. Eleven per cent of the children had English as an additional language (EAL) although, the proportion of children who still needed support because of having EAL was smaller at the end of Year 6 (1.9 %).
With respect to family structure, fourteen per cent of the children lived in large families (defined as those with 3 or more siblings). Table 1.1a also shows the distribution of the Early years home learning environment (HLE) index which is a combined measure of aspects of the quality of the home learning environment in the early years (see Appendix 5 and Melhuish et al., 2008). A number of measures collected at the entry to study from the parent interview provided an indication of aspects of the HLE in the early years. These are based on the frequency of
engagement in specific activities involving the child such as, teaching the alphabet, reading to the child, listening to the child read, taking the child to the library etc. (as reported by the parents at interview). Table 1.1a shows that forty-one per cent of the children in the sample belong to the two highest HLE categories indicating that the Early years HLE was good or very good for these children while nine per cent had very low HLE scores. In all 276 children (10.2% of the total current sample) had not attended any type of pre-school (the „home‟ group) before entering primary
Table 1.1a: Selected characteristics of children who have valid cognitive data at Year 6 (N = 2701) Some figures do not include non-response to questions therefore the total is not always 2701 (100 %)
n %
Gender
Male 1375 50.9
Female 1326 49.1
Ethnicity
White UK Heritage 1974 73.1
White European Heritage 84 3.1
Black Caribbean Heritage 108 4.0
Black African Heritage 59 2.2
Indian Heritage 58 2.2
Pakistani Heritage 158 5.9
Bangladeshi Heritage 34 1.3
Mixed Heritage 147 5.4
Any Other Ethnic Minority Heritage 76 2.8
English as an Additional Language (EAL) 291 10.8
Child needs special EAL support 52 1.9
3 or more siblings 357 14.0
Home Learning Environment Index (during pre-school period):
0 – 13 246 9.1
14 – 19 585 21.6
20 – 24 629 23.3
25 – 32 815 30.2
33 – 45 293 10.9
Type of Pre-School
Nursery class 528 19.6
Playgroup 551 20.4
Private day nursery 368 13.6
Local Authority day nursery 355 13.1
Nursery schools 456 16.9
Integrated (Combined) centres 167 6.2
Home 276 10.2
Table 1.1b: Selected characteristics of children who have valid cognitive data at Year 6 (n =2701)
Some figures do not include non-response to questions therefore the total is not always 2,701 (100 %)
n %
Social-economic status (SES) of Mother (during Key Stage 1 or earlier):
Professional Non Manual 99 4.1
Other Professional Non manual 325 13.5
Skilled Non Manual 393 16.3
Skilled Manual 268 11.1
Semi-Skilled 473 19.6
Unskilled 82 3.4
Unemployed / Not working 770 32
Social-economic status (SES) of Father (during Key Stage 1 or earlier):
Professional Non Manual 222 11.1
Other Professional Non manual 425 21.2
Skilled Non Manual 271 13.5
Skilled Manual 733 27.1
Semi-Skilled 119 5.9
Unskilled 42 2.1
Unemployed / Not working 189 9.4
Professional Non Manual 444 -
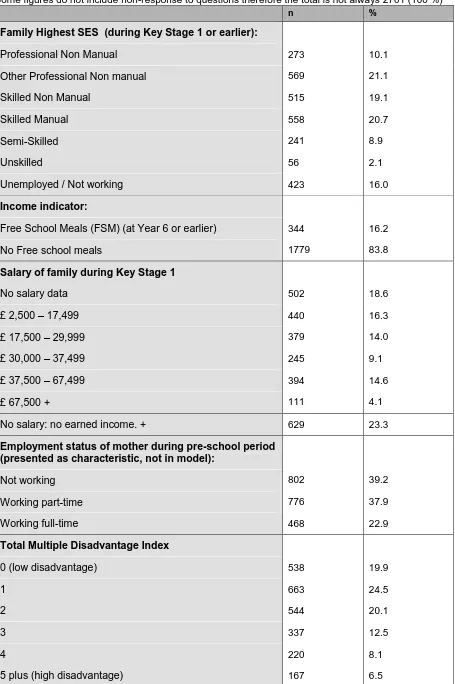
Table 1.1c shows the details on the combined family SES measure with over thirty per cent of families being in the highest (professional) two categories and sixteen per cent being
unemployed/not working. Sixteen per cent of the children were eligible for free school meals (FSM) at Year 6 (or at an earlier time point, if no information was available for Year 6), while thirty-five per cent of the children were growing up in families whose annual salary was recorded as less than £17, 500 or had no earned income in KS1 when the data was gathered.
An index of multiple disadvantage11 was created in the original EPPE research. (Sammons et al., 2002) Table 1.1c indicates that twenty per cent were identified as showing low levels of
disadvantage, and seven per cent of the children were recorded as highly disadvantaged – that is, with a score on 5 or more factors associated with poorer educational outcomes, and another eight per cent scored on 4 factors.
In general, only a small proportion of pupils had missing data (< 5 %) even for the measures of social background, which is a result of the procedures for tracking children and good relations with parents and primary schools leading to high response rates, as well as regular data quality checks of the EPPE 3-11 data management team. Somewhat higher proportions of missing values occur for income-related variables like salary, at twenty-three per cent, and the eligibility for free school meals (FSM), at twenty-one per cent, which is also an additional low income indicator. A higher proportion of missing values for these kinds of measures is a typical response pattern also found in other survey studies.12
11
The index combines poor child, family and home learning characteristics associated individually with lower attainment such as low birth weight, low family SES etc. For further details on the factors in the index see Appendix 5.
12
To prevent loss of sample size for further analyses missing values for number of siblings, FSM and SES where imputed using „the last observation carried forward‟ method. Please see Appendix 3 for a
Table 1.1c: Selected characteristics of children who have valid cognitive data at Year 6 (n = 2701) Some figures do not include non-response to questions therefore the total is not always 2701 (100 %)
n %
Family Highest SES (during Key Stage 1 or earlier):
Professional Non Manual 273 10.1
Other Professional Non manual 569 21.1
Skilled Non Manual 515 19.1
Skilled Manual 558 20.7
Semi-Skilled 241 8.9
Unskilled 56 2.1
Unemployed / Not working 423 16.0
Income indicator:
Free School Meals (FSM) (at Year 6 or earlier) 344 16.2
No Free school meals 1779 83.8
Salary of family during Key Stage 1
No salary data 502 18.6
£ 2,500 – 17,499 440 16.3
£ 17,500 – 29,999 379 14.0
£ 30,000 – 37,499 245 9.1
£ 37,500 – 67,499 394 14.6
£ 67,500 + 111 4.1
No salary: no earned income. + 629 23.3
Employment status of mother during pre-school period (presented as characteristic, not in model):
Not working 802 39.2
Working part-time 776 37.9
Working full-time 468 22.9
Total Multiple Disadvantage Index
0 (low disadvantage) 538 19.9
1 663 24.5
2 544 20.1
3 337 12.5
Cognitive assessments
To take account of development and age, the study uses different assessment instruments for cognitive outcomes at different time points:
Year 2: National Assessment Key Stage 1: English and Mathematics Year 6: National Assessment Key Stage 2: English and Mathematics
National assessment data were collected for the sample at the end of Year 2 and Year 6. Test levels were collected at both time points. However, National assessment test levels only amount to ordinal categories: they place pupils‟ into a few ranked attainment groups: Year 2: 6 groups from working towards level 1, level 1, through 2c, 2b, 2a to level 3; Year 6: 6 groups from working towards level 1, level 1 through to level 6.
Consequently in addition to test levels, data were also collected on children‟s individual test scores within levels. This allowed the creation of more finely differentiated outcome measures (which are referred to here as decimalised levels) for the multilevel analysis.
For children who scored highly enough to attain a valid level for the National assessment test taken, their decimalised score was calculated as follows:
Decimalised score = level of test achieved + {(raw score - lowest valid raw score for corresponding level) / highest valid raw score possible for the level}
Furthermore, to ensure comparability over time, an internal age standardisation and normalisation procedure was applied to the decimalised data. This procedure takes account of age effects within one school year: hence age of pupil does not feature as a significant predictor of attainment / progress although included in the models. The scores presented in this paper are internally standardised to a mean of 100 and a standard deviation of 15. Therefore all children scoring better than 100 at a certain time point are scoring at or above the attainment level expected for their chronological age (belong to the upper half of the sample of that assessment, controlling for age effects). Due to the use of internally standardised attainment scores, the scores can only be used to investigate the progress or improvement of certain groups of children relative to the total EPPE 3-11 sample, but cannot be used to show absolute progress over time.
In Appendix 2 further details on the decimalisation, standardisation and normalisation procedure, as well as on the interpretation, of such scores are provided.
Associations between children’s attainments in different outcomes and over time
Correlations can be used to explore associations between children‟s attainments in different outcomes and over time.13 Children‟s attainments in the Year 6 assessments were strongly positively correlated (r=0.69), indicating those who do well in English generally also do well in Mathematics at the end of Year 6, while those who score poorly on one also tend to do poorly in the other. The correlation between English and Mathematics scores at the end of Year 2 was the same (r=0.69, not shown in Table 1.2).
The cognitive attainments are not only highly associated with each other but also show moderate to high correlations with prior attainments (see Table 1.2). A particularly strong relationship is found for attainment in English in Year 2 and Year 6 (r=0.73), while attainment in Mathematics is also strongly correlated between Years 2 and 6 (r=0.70).
13
Table 1.2: Correlations between children’s standardised cognitive outcomes and with prior assessments
Year 6 Year 6
Assessment English Mathematics
Year 6 Mathematics 0.693 (n = 2664) ###
Year 2
English 0.729 (n = 2420) 0.646 (n =2425)
Mathematics 0.570 (n = 2425) 0.696 (n = 2379)
At this stage the high correlations between cognitive assessments at different time points, indicate that the assessments are measuring similar aspects of attainment suggesting that the measures are likely to be reliable indicators of abilities over time. The impact of earlier attainments as predictors for later attainments will be explored in more detail in Section 5. Of particular interest will be the „net‟ influence of child, background and home learning environment (HLE)
characteristics at Year 6, when controlling for prior attainments of the children, as this will indicate whether some groups make more or less progress relative to others during KS2.
Differences in attainment for different groups of children
Significant differences in cognitive attainments related to various child, family and home learning environment (HLE) characteristics have been reported at entry to pre-school (age 3 plus), later at entry to primary school (rising 5 years), at the end of Year 1 (age 6), at the end of Year 2 (age 7) and at the end of Year 5 (age 10). These characteristics were also predictors (but were less strongly associated) of different aspects of the social/behavioural development of the children. In this section differences in cognitive attainments at the end of Year 6 for different groups of children (i.e. gender groups, ethnicity groups, etc.) are explored. The findings at the end of Year 6 are broadly in line with the earlier reported findings (see Sammons et al., 2004b; 2004c; 2007).
It is important to stress that these „raw‟ reported differences, in average results for different pupil groups, do not control for the influence of any other variables. This means, for example, if we are looking at the size of differences between individual ethnic groups, these differences could also be due, at least in part, to SES and language differences between the ethnic groups. Section 2 of this report provides more detailed statistical analyses of these patterns using multilevel models to explore the „net‟ contribution of different factors and reports the relevant effect sizes, controlling for other factors. It will also address the issue of change of „net‟ contribution of different factors over time in terms of effect sizes14.
Gender
At younger ages girls had been found to score more highly in cognitive attainments. At the end of Key Stage 2 (Year 6), this pattern of results was found for English scores, but no longer for Mathematics scores, where boys have a higher average score.
Table 1.3: Gender differences on Children’s score on the EPPE Year 6 cognitive outcomes
All Boys Girls
n Mean SD n Mean SD n Mean SD
English 2690 100.00 15.00 1360 97.76 14.55 1330 102.29 15.02
Ethnicity and language
At the end of Year 6 we find that children of Pakistani heritage have particularly low attainment in English and Mathematics, a mean of 93.3 (see Figures 1.1 and 1.2), which is consistent with previous years‟ (e.g. Year 2 a mean of 90.6). Children of Bangladeshi heritage, however, have noticeably improved scores - recording a mean of 92.2 by the end of Year 2, but a mean of 98.3 by the end of Year 6. The Mathematics mean score for children of Indian heritage (104.2) is clearly above that of other groups. All these differences need to be interpreted with caution due to the small numbers of some ethnic minorities; this is particularly so for the Bangladeshi group with only 35 members. The rest of this section will provide further insight in to differences in cognitive attainments for certain minority groups over the years.
Figure 1.1: Cognitive attainment at Year 6 by ethnic groups: English
Raw Attainment by Ethnic Group: English
97.4 100.7 99.6 97.9
102.0
93.3
98.3 100.7 100.6
0 20 40 60 80 100 120 140 White European Black Carribean
Black African Any Other Indian Pakistani Bangladeshi Mixed Race White UK
Me an ( S tand ar ise d S core )
N=84 N=107 N=59 N=77 N=57 N=158 N=35 N=146 N=1964
Figure 1.2: Cognitive attainment at Year 6 by ethnic groups: Mathematics
Raw Attainment by Ethnic Group: Mathematics
99.2 98.8 97.5 98.4
104.5 94.2 95.8 98.7 100.7 0 20 40 60 80 100 120 140 White European
Black Carribean Black African Any Other Indian Pakistani Bangladeshi Mixed Race White UK
Me an ( S tand ar ise d S core ) N=108
N=84 N=59 N=76 N=58 N=158 N=34 N=147 N=1974
almost as strong as for English (Means: EAL=96.6, non-EAL=100.4, EAL support needed
ES=89.6, No EAL support needed ES=100.5). It should be noted, that the group “No EAL support needed” includes children for whom English is the first language and EAL children who do not require support. The differences in average attainments are illustrated in Figures 1.3 and 1.4.15
Figure 1.3: Cognitive attainment at Year 6 by Mother Tongue: English
Raw Attainment by Mother Tongue: English
100.5
96.0
88.8
100.5
0 20 40 60 80 100 120 140
1
Me
an (
S
tand
ar
d
ise
d
S
core
)
English EAL EAL needed EAL not needed
N = 2393 N = 294 N = 53 N = 2170
Figure 1.4: Cognitive attainment at Year 6 by Mother Tongue: Mathematics
Raw Attainment by Mother Tongue: Mathematics
100.4
96.6
89.6
100.5
0 20 40 60 80 100 120 140
1
Me
an (
S
tand
ar
d
ise
d
S
core
)
English EAL EAL needed EAL not needed
N = 2407 N = 291 N = 52 N = 2175
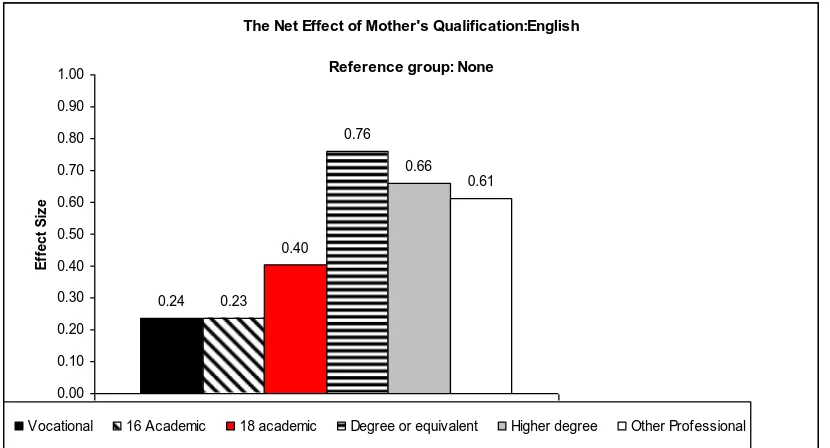
Parents’ qualification level
are also far above average (Means: English=111.4, Mathematics=111.2). The lowest attainment is seen for children whose mothers have no qualifications (Means: English=92.6,
Mathematics=93.3). If you analyze the differences in attainment by father‟s highest qualification level you find the same pattern of results, although the association is slightly less powerful.
Figure 1.5: Cognitive attainment at Year 6 by mother’s qualification level: English
Raw Attainment by Mother's Qualifications: English
92.6
100.2 99.5
104.0
111.4 112.2
106.7
0 20 40 60 80 100 120 140
Mother's Qualification
M
e
a
n (Standa
rdis
e
d S
c
ore
)
None Vocational 16 academic 18 academic Degree or equivalent Higher degree Other Professional
N = 562 N = 388 N = 998 N = 211 N = 283 N = 87 N = 39
Figure 1.6: Cognitive attainment at Year 6 by mother’s qualification level: Mathematics
Raw Attainment by Mother's Qualifications: Mathematics
93.3
98.8 99.5
103.9
111.2 113.0
106.6
0 20 40 60 80 100 120 140
Mother's Qualification
Me
an (
S
tand
ar
d
ise
d
S
core
)
None Vocational 16 academic 18 academic Degree or equivalent Higher degree Other Professional
N = 566 N = 390 N = 1002 N = 211 N = 284 N = 88 N = 39
Socio-economic status (SES) and eligibility for free school meals (FSM)
Large attainment differences occur in English and Mathematics related to the socio-economic status (SES) of the family as found in the study of cognitive attainment measures at previous time points (entry to pre-school, entry to primary school, end of Year 1, end of Year 2 and end of Year 5). Family SES is measured by the highest of mother‟s or father‟s current or most recent
end of Year 6. Children whose parents are in high SES (professional non-manual) employment have the highest average scores of any SES group, while children whose parents are unemployed or unskilled have the lowest average score (Figures 1.7 and 1.8). Although SES differences are marked they are smaller than those related to parents‟ qualification levels.
Figure 1.7: Cognitive attainment at Year 6 by Family SES: English
Raw Attainment by SES: English
94.4 94.4 96.0 95.5
101.1
105.7 109.3
0 20 40 60 80 100 120 140
Family SES
Me
an (
S
tand
ar
d
ise
d
S
core
)
Unemployed Unskilled Semi skilled Skilled manual Skilled non-manual Other professional Professional non-manual
N = 275 N = 567 N = 514 N = 556 N = 238 N = 54 N = 429
Figure 1.8: Cognitive attainment at Year 6 by Family SES: Mathematics
Raw Attainment by SES: Mathematics
94.8 93.3 95.6 96.6 100.2
104.9
110.8
0 20 40 60 80 100 120 140
1
Me
an (
S
tand
ar
d
ise
d
S
core
)
Unemployed Unskilled Semi skilled Skilled manual Skilled non-manual Other professional Professional non-manual
N = 273 N = 569 N = 515 N = 558 N = 241 N = 56 N = 432
Table 1.4: Cognitive attainment at the end of Year 6 and low income Indicator (Free school meals)
Eligible for Free school meals (FSM) Not eligible for Free school meals (Non FSM)
n Mean SD n Mean SD
English 474 92.3 14.03 2152 101.6 14.68
Mathematics 479 93.4 13.99 2156 101.4 14.82
Special educational needs (SEN)
As might be expected, children identified by primary school records as having at least one SEN in Year 6 showed significantly lower attainment in English (mean = 87.0 versus 104.9) and
Mathematics (mean = 89.2 versus 104.3).
Table 1.5: Cognitive attainment at the end of Year 6 and SEN
Special educational needs No special educational needs
n Mean SD n Mean SD
English 625 87.0 12.65 1717 104.9 12.97
Mathematics 632 89.2 13.42 1716 104.3 13.48
Multiple Disadvantage
Previous research has indicated that multiply disadvantaged children have poorer educational outcomes and trajectories than other non-disadvantaged children (see research on Educational Priority indices by Sammons et al., 1983). The multiple disadvantage index, created in the original EPPE research (See Appendix 5), showed a strong association with educational outcomes
especially for cognitive attainment at entry to school and in Key Stage 1. The Year 6 analyses also reveal a strong relationship with average cognitive attainment in Year 6. Children with no recorded disadvantage factors who had average scores of 106.0 (English) and 105.4
(Mathematics), in contrast with children with five or more recorded disadvantage factors had average scores of 91.7 (English) and 92.4 (Mathematics). Again these results suggest that multiple disadvantage remains strongly associated with poorer academic outcomes across both pre-school and primary school years.
Table 1.6: Cognitive attainments at the end of Year 6 by Multiple Disadvantage Index
Multiple Disadvantage English Mathematics
Index n Mean SD N Mean SD
0 (no disadvantage) 539 106.0 14.05 538 105.4 14.15
1 660 104.6 13.84 663 103.8 14.50
2 540 99.1 14.38 544 99.5 14.30
3 339 94.9 14.11 337 94.9 14.61
4 211 93.2 13.35 220 93.5 13.12
5 plus (high disadvantage) 179 91.7 13.44 177 92.4 13.77
Early years home learning environment (HLE)
environment during the early years, the better the child‟s attainment at Year 6 (see Figures 1.9 and 1.10). The difference is similar to that for family SES.
Figure 1.9: Cognitive attainment at Year 6 by Early years HLE index: English
Raw Attainment by Early Years HLE: English
94.8
92.6
96.6 99.3
102.5
109.7
0 20 40 60 80 100 120 140
1
Me
an (
S
tand
ar
d
ise
d
S
core
)
Unknown 0-13 14-19 20-24 25-32 33-45
N = 132 N = 247 N = 576 N = 625 N = 813 N = 284
Figure 1.10: Cognitive attainment at Year 6 by Early years HLE index: Mathematics
Raw Attainment by Early Years HLE: Mathematics
95.8 95.0 97.3
99.6 101.8
107.4
0 20 40 60 80 100 120 140
1
Me
an (
S
tand
ar
d
ise
d
S
core
)
Unknown 0-13 14-19 20-24 25-32 33-45
N = 133 N = 246 N = 585 N = 629 N = 815 N = 293
Pre-school
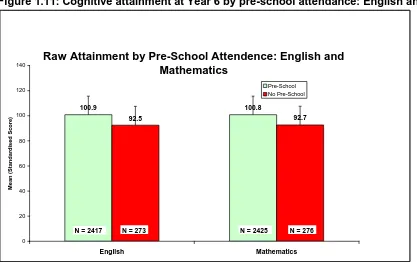
Due to the very different characteristics of the „home‟ group (disadvantaged children are over-represented in this group) and very different characteristics of children who went to different types of pre-school, these raw differences need to be interpreted with considerable caution. Further analyses are required to separate the „net‟ pre-school effects from those related to background factors. Section 4 investigates the impact of attendance, quality and effectiveness of pre-school in more detail, controlling for the influence of differences in children‟s background characteristics.
Figure 1.11: Cognitive attainment at Year 6 by pre-school attendance: English and Mathematics
Raw Attainment by Pre-School Attendence: English and Mathematics
100.9 100.8
92.5 92.7
0 20 40 60 80 100 120 140
English Mathematics
Me
an (
S
tand
ar
d
ise
d
S
core
)
Pre-School No Pre-School
N = 2417 N = 273 N = 2425 N = 276
Primary School Academic Effectiveness
[image:32.595.60.477.158.420.2]Value added academic effectiveness measures for primary schools were calculated using National assessment data for all primary schools in England linking Key Stage 1 and Key Stage 2 results; separate indicators were calculated for the different core curriculum subjects English, Mathematics and Science (Melhuish et al., 2006a; 2006b). These measures are thus independently derived and based on full national pupil cohorts. They provide indicators of the academic success of the school in promoting its pupils‟ progress in the three core cur