Ymchwil gymdeithasol Social research
Number: 15/2012
Evaluation of the first three years
of RAISE: Final Report
Evaluation of the first three years
of RAISE: Final Report
Dr Duncan Holtom with Dr Sarah Lloyd-Jones and contributions from Rhodri Bowen
& Jodie Sims, The People and Work Unit
Views expressed in this report are those of the researcher and not necessarily
those of the Welsh Government
For further information please contact:
Alison Rees
Knowledge and Analytical Services
Welsh Government
Cathays Park
Cardiff
CF10 3NQ
Email: [email protected]
Welsh Government Social Research, 2012
ISBN: 978 0 7504 7419 1
ACKNOWLEDGEMENTS
Thanks are extended to the RAISE programme leader, Paul Morgan, the RAISE Evaluation
Manager, Alison Rees, current and former members of the RAISE Programme team,
including Graham Davies, Hillary Hill, Gordon MacDonald, Richard Matthews and Adam
Moorhouse; and members of the RAISE Regional Consortia, including Alan Boxford, David
Brunton, Hilary Cameron, Sue Davies, Brian George, Judith Hiller, Gareth Davies-Jones,
Nicola Lo Celso and Nerys Snowball for their help and support during the evaluation of
RAISE. Thanks are also extended to the 60 schools and their staff and pupils who
welcomed us and discussed RAISE with us and the eighteen interviewees who gave their
time to support the evaluation. Finally, thanks are extended to Bethan Wyn-Jones for her
role in the fieldwork. .
CONTENTS
Acknowledgements 2
1. Introduction 4
2. Main Findings & Recommendations 7
3. The Context For Raise 19
4. The Aims And Objectives Of The Evaluation 27
5. Methodology 29
6. Did RAISE Target Disadvantaged Pupils? 38
7. Has Raise Increased The Achievement And The Attainment Of
Disadvantaged Pupils? 53
8. Differences In Impact In Different Schools 67
9. The Impact Of Raise Funding Upon Schools 76
10. The Legacy Of Raise Funding for Schools 85
11. The Impact Of Raise Funding For Children looked after by Local
Authorities 88
12. The Impact Of Raise Funding For Children Looked After by Local
Authorities Upon Local Authorities 121
13. The Role Of The Welsh Government 126
14. The Role Of Regional Consortia And Local Authorities 151
15. The Role Of Schools 160
16. The Value For Money Of Raise 162
17. Conclusions 169
18. Bibliography 179
Appendix
A1. Interviewees 190
A2. Analysis Of Raise Schools’ First Year Proposals 191
A3. Sample Semi-Structured Interview Schedule 196
1.
INTRODUCTION
1.1. The Raising Attainment and Individual Standards of Education (RAISE)
programme was launched in 2006, initially as a two year programme that would
“target disadvantaged pupils and seek to raise their levels of performance” (WAG,
2006a). In 2008, the funding for schools was extended for a further two years and
funding to support Children Looked After by Local Authorities was extended for a
further three years.
1.2. Over the three year period (2006-2009) covered by this Final Report, £16.25m has
been available annually for the RAISE programme. Of this sum, around £14.5m
has been allocated to eligible schools1, £1 million has been allocated to Local Authorities to support the attainment of children looked after by Local Authorities in
years 10 and 11 and the remainder has been allocated to the administration of the
grant, centrally organised events and activities, evaluation and the support
provided to the programme by Regional Consortia and Regional Coordinators.
1.3. All schools with at least 50 statutory-school-age pupils, 20% or more of whom
were eligible for free school meals (FSMs), a proxy indicator of socio-economic
disadvantage, received RAISE funding. A total of 648 schools received funding in
2006-2007, made up of 535 primary schools; 69 secondary schools and 32 special
schools. This represented approximately 30% of primary schools, 28% of
secondary schools and 75% of special schools (Estyn, 2010). With the exception
of cases where a school closed or was amalgamated, these schools continued to
receive RAISE funding2 for three academic years, until summer 2009. The amount of funding that they received depended upon the numbers of pupils eligible for free
school meals. Primary schools received funding of between £11,000 and
1
14.6 million was allocated in 2006/07 and 14.4 million in 2007/08 2
Those schools whose percentage of pupils eligible for free school meals fell below 20% continued to be funded
£30,0003; secondary schools received funding of between £47,000 and £220,000 and special schools received funding of between £16,000 and £22,000.
1.4. Schools were required to target the funding at “pupils who are disadvantaged or
most at risk of low attainment – or of leaving full time education with no
qualifications”. The eligible uses of the fund were:
• additional support in the classroom including the use of learning mentors;
• individual or small group work focused on literacy, numeracy or other aspects of learning;
• out of hours activities;
• development of home–school links;
• support from the community or through development of activities under the community focused schools programme;
• collaboration with FE institutions or other partners;
• behaviour support;
• improving attendance;
• support for disadvantaged pupils in the transition from primary to secondary school;
• building links with Pupil Referral Units and specialised behavioural units so as to enhance the educational opportunities of pupils and assist their reintegration into
the mainstream;
• activities which link with development of other programmes such as the foundation phase and, in relevant areas, of the Flying Start programme;
• the purchase of specialist equipment or communication aids to enable pupils to access the curriculum;
• in the case of special schools development of projects with mainstream schools;
• revision and preparation to take any external qualification approved for use with
pupils under 16; [and]
3
By the third year of RAISE, this had fallen to 528 primary schools.
• other activity which the school can demonstrate is directed specifically at supporting the target groups of pupils (WAG, 2006a).
1.5. Given the breadth of eligible activities, the RAISE programme team encouraged
schools to first focus upon the purpose of the grant: to target pupils from
disadvantaged backgrounds and raise their attainment, and to use the list to help
them identify the most effective way of achieving this, rather than starting with the
list of activities in order to choose how to use their RAISE funding.
1.6. The purpose of the looked after children RAISE annual grant of £1 million was to
support the attainment of children looked after by Local Authorities and was
focused on improving their educational outcomes, particularly as they approach
public examinations at the age of 16. However, in 2008, the scope was extended
to enable Local Authorities to provide intervention at an earlier age. In addition,
more emphasis was placed on children looked after by Local Authorities who were
educated out-of-county but still within Wales.
2. MAIN FINDINGS & RECOMMENDATIONS
.The Context for RAISE
2.1. Literature reviewed for this evaluation showed a strong relationship between
poverty and poor educational attainment (paragraphs 3.1-3.3). The gap between
the attainment of children from socioeconomically disadvantaged backgrounds
and those from wealthier backgrounds is linked to differences in their individual
characteristics and capabilities; their families; and the schools they attend
(paragraphs 3.6-3.13).
The targeting of pupils from disadvantaged backgrounds by RAISE
2.2. Eligibility for free school meals (FSMs) is the best available proxy measure of the
socioeconomic disadvantage of pupils at a school level (paragraphs 6.2.-6.8).
2.3. Although, as the percentage of pupils eligible for FSMs in a school increases the
average attainment of pupils in the school decreases, there is no ‘tipping point’,
after which an increase in the percentage of pupils eligible for FSMs leads to a
disproportionate reduction in the average attainment of pupils within the school
(paragraphs 6.9-6.13).
2.4. The first threshold for inclusion in RAISE required that at least 20% of a school's
pupils were eligible for FSMs. The evaluation found in the absence of a “tipping
point” that this struck an appropriate balance between reaching as many
disadvantaged pupils as possible, whilst ensuring that the available resource was
not spread too thinly (paragraphs 6.14-6.15).
2.5. The second threshold for inclusion in RAISE required schools to have at least 50
pupils. The evaluation found this restriction less appropriate and meant that
pupils from socioeconomically disadvantaged backgrounds in approximately 75
small schools did not benefit from RAISE funding (paragraph 6.16).
2.6. Most RAISE schools targeted disadvantaged pupils. However, RAISE schools
also targeted a small number of pupils who were under-achieving but who were
not from socioeconomically disadvantaged backgrounds. Moreover, few pupils
from socioeconomically disadvantaged backgrounds with higher levels of
achievement were targeted (paragraphs 6.18-6.20).
The impact of RAISE upon pupils’ attainment and achievement
2.7. Across Wales, the attainment of pupils eligible for FSMs has increased in all four
Key Stages since RAISE started in 2007 (paragraphs 7.3-7.5). A key issue for
the evaluation was to assess the extent to which this increase was attributable to
RAISE.
2.8. The increase in the attainment of FSM pupils in Key Stages 1 and 2 has been
greater than that of non FSM pupils. Therefore, the gap between them closed a
little over the period 2007-2009 (paragraphs 7.3-7.5).
2.9. However, the increase in the attainment of non FSM pupils in Key Stages 3 and 4
has been greater than that of FSM pupils. Therefore, the gap between them
increased over the period 2007-2009 (paragraphs 7.3-7.5).
2.10. Historically, the performance of FSM pupils has tended to be lower in schools
with a high overall proportion of FSM pupils. These schools were eligible for
RAISE funding. During the period 2006-2008, in Key Stage 2, FSM pupils in
RAISE schools did better than FSM pupils in non-RAISE schools and the gap
between FSM pupils in RAISE and non RAISE schools fell from 10.2 percentage
points in 2006 to 4.4 percentage points in 2008. However, in Key Stages 3 and 4
the attainment gap between FSM pupils in RAISE and non RAISE schools
increased and in Key Stage 1, there was little change in the gap (paragraphs
7.6-7.7). Therefore, it is likely that much of the gain in FSM pupils’ performance in
Key stages 3 And 4 was not due to RAISE.
2.11. Schools, Regional Coordinators and Estyn Inspectors all reported that most
RAISE supported pupils were making good progress. This assessment may
appear to be inconsistent with the data on pupil attainment. However, this
assessment reflects gains in pupils’ basic skills and their social and emotional
skills and dispositions, meaning it is a broader measure than attainment
(paragraphs 7.8-7.13).
Differences in impact in different schools
2.12. The impact of RAISE upon pupils has not been uniform: pupils in some schools
have achieved more than others. The evaluation concludes that much of this
variation is because the effectiveness of schools and the challenges they faced
differed (paragraphs 8.2. 8.8).
2.13. The most effective schools were best placed to exploit the opportunities RAISE
provided to develop strategies to tackle the link between socioeconomic
disadvantage and low levels of attainment. Some schools were able to use
RAISE funding to build on their existing work to become more strategic, testing
out new approaches, and becoming more effective in both targeting and tackling
needs (paragraphs 8.7. 8.8).
2.14. Evidence suggests holistic strategies that apply systems thinking to tackling the
link between socioeconomic disadvantage and low levels of attainment are the
most effective. This is because there is no single causal factor associated with
socioeconomic disadvantage, so addressing more factors increases the chances
that the specific needs of a child will be addressed and that specific weaknesses
in a school that contribute to under-achievement are addressed; there is the
potential for synergies between different interventions; and holistic strategies
reduce the risk that different interventions will conflict with, or cancel, each other
out (paragraphs 8.9. 8.12).
The impact of RAISE funding upon schools
2.15. RAISE had a range of positive impacts upon schools. They included a growing
awareness and, in some cases, understanding of the link between
socioeconomic disadvantage and poor educational attainment (paragraph
9.2-9.3); the enabling, sustaining and, in some cases, catalysing of action to address
the link (paragraph 9.4-9.5); staff development and the introduction of new ways
of working (paragraph 9.6-9.8); developing and extending the curriculum
(paragraph 9.9-9.10); enhanced support for pupils from socioeconomically
disadvantaged backgrounds (paragraphs 9.9-9.10); and improvements in
monitoring and evaluation (paragraphs 9.11.-9.12).
The legacy of RAISE funding for schools
2.16. Almost all RAISE funded schools are keen to ensure RAISE has a legacy but
some changes will be easier to sustain than others. Changes in culture and
working practices that are “embedded” in the school, such as changes in
teachers’ understanding of the links between socioeconomic disadvantage and
low levels of attainment, will be easier to sustain than those, such as the
employment of additional support staff that “extended” the school (paragraphs
10.1-10.3).
The impact of RAISE funding for Children looked after by Local Authorities 2.17. At a national level, the proportion of children looked after by their Local Authority
in Wales achieving at least one and at least five GCSEs A*-G increased over the
period 2002-2008 (paragraphs 11.3-11.9).
2.18. The rate of increase in the proportion of children looked after by their Local
Authority gaining at least one GCSE A*-G was slightly higher in the RAISE period
(2007-2009) than it was in the preceding five years (2002-2006) (paragraphs
11.3-11.9).
2.19. The rate of increase in the proportion of children looked after by Local Authorities
gaining at least five GCSE A*-G was similar in the RAISE period (2007-2009) to
that of the preceding five years (2002-2006) (paragraphs 11.3-11.9).
2.20. Overall, although the evidence of a positive impact upon of the attainment of
children looked after by Local Authorities is limited, there is stronger evidence
from both RAISE Looked After Children’s Coordinators and children looked after
by Local Authorities, that RAISE has had a positive impact upon their educational
experiences and their social and emotional skills and dispositions. This finding is
consistent with evaluations of comparable initiatives in England (paragraphs
11.22-11.23, 11.34-11.35).
2.21. The evidence of the impact of RAISE funding for children looked after by Local
Authorities upon schools and Local Authorities is positive but patchy (paragraphs
12.1-12.4).
The Welsh Government’s role
2.22. Although presented as a single programme, the two strands of RAISE funding for
schools and for children looked after by Local Authorities have in effect operated
as distinct programmes. (paragraph 13.1).
2.23. Proposals for RAISE funding for schools were made swiftly and initially there was
limited engagement with Local Authorities. This, combined with concerns that the
proposals sidelined Local Authorities, meant that many schools were not
effectively supported and challenged by Local Authorities when developing their
proposals for the use of RAISE funding. Local Authority engagement with RAISE
improved considerably as the programme developed, but the initial problems
contributed to weaknesses in many schools proposals (paragraphs 13.2-13.15).
2.24. Each of the themes identified for the fourth year of RAISE funding are
appropriate, although there was evidence of a greater need and/or greater
evidence of the efficacy of some themes. Taken in isolation the themes do not
include important areas such as leadership and pedagogy. However, when
viewed in the context of other Welsh Government policies, which include these
areas and which emphasise the need for systems thinking, they provide a useful
starting point for schools wishing to identify actions to tackle the link between
socio-economic disadvantage and poor educational attainment (paragraphs
13.7.-13.25).
2.25. Proposals for RAISE funding to support children looked after by Local Authorities
were simpler to administer because funding was devolved directly to Local
Authorities. However, there were also weaknesses in the range and type of
proposals that were put forward by Local Authorities (paragraph 13.26-13.27).
2.26. The objective of RAISE, to target pupils from socioeconomically disadvantaged
backgrounds and raise their attainment, was clearly aligned with objectives in the
Learning Country: Vision into Action. However, at an operational level, RAISE
has been less well aligned with other Welsh Government programmes and
policies intended to support these strategic objectives (paragraphs 13.28-13.29).
Regional Consortia and Local Authorities’ role
2.27. Local Authorities support for schools has been patchy (paragraph 14.2-14.3).
2.28. In two Consortia there has been strong leadership from senior officers, which has
helped to develop a more strategic approach to tackling the link between
socioeconomic disadvantage and poor educational attainment. In the other two
consortia, Regional Coordinators have taken on leadership roles. In one of these
consortia, the Regional Coordinator worked closely with Local Authorities and
schools to develop the RAISE programme while, in the other consortium, the
work was more focused upon individual schools (paragraphs 14.4).
2.29. Assessments of the impact of Regional Coordinators are disputed: some schools
have valued their work whilst other schools and Estyn have been more sceptical
of their impact. Regional Coordinators strongly dispute this assessment, which
they believe rests upon a misunderstanding of their role, which includes, but
goes beyond simply working with schools (paragraphs 14.6-14.11).
2.30. RAISE funded work was often poorly integrated with Local Authority strategies to
tackle child poverty (paragraphs 14.13-14.16).
Schools’ Role
2.31. Initially, schools had little time to prepare and many chose narrowly focused but
‘tried and tested’ approaches, often focused upon literacy. In many schools
proposals developed over time, becoming more holistic (paragraph 15.1).
2.32. School’s monitoring of RAISE funded work has been more effective than their
evaluation of it (paragraph 15.2-15.4).
The value for money of RAISE
2.33. It is not possible to quantify the cost or financial benefit per pupil of RAISE,
limiting the scope to assess the programme’s value for money (paragraph
16.3.-16.6)
2.34. A qualitative assessment of the programme’s value for money suggests it offered
a reasonably efficient way of disbursing funding but that the impact (or value) of
this funding was limited by weaknesses in the programme (paragraph 16.5).
Conclusions
2.35. RAISE aimed to target disadvantaged pupils and to raise their attainment.
Targeting was imperfect and, in effect, many schools opted to promote equality of
outcomes over equality of opportunity by targeting under-achievement rather
than socioeconomic disadvantage. Nevertheless, the programme reached large
numbers of disadvantaged pupils. The evidence of an impact on their attainment
is strongest for pupils in Key Stage 2, although there is evidence of positive
impacts upon pupils’ basic skills and their social and emotional skills and
dispositions in all four Key Stages (paragraph 17.1, 17.27).
2.36. The evidence from RAISE, and the literature, suggests that schools serving
disadvantaged areas whose pupils do better than would be expected given their
socioeconomic background, do so principally because they embody the
characteristics of an effective school. They are effective, in part, because
interventions, such as programmes to improve basic skills, are part of a holistic
strategy aimed at narrowing the gap between the educational attainment and
experiences of pupils from more and less socioeconomically disadvantaged
backgrounds, (paragraph 17.3).
2.37. The RAISE programme has illustrated how additional funding can help schools
become more effective at ensuring that all pupils achieve their potential, but is
not of itself sufficient. RAISE demonstrates that what a school does is more
important than how much it spends. Moreover, although there is large body of
evidence and a broad consensus on what schools can do to help children
achieve more, there is much less consensus on how a school can apply and
implement this knowledge and become more effective. Whilst RAISE has
contributed to this understanding, illustrating both the value and some of the
limits of the impact of additional funding, the evidence it provides is incomplete.
(See paragraphs 17.4-17.5).
2.38. Similar conclusions apply to RAISE funding for children looked after by Local
Authorities. Evidence suggests the most effective Local Authorities achieve good
outcomes not simply because they provide additional support; it is because this
support is part of a systems wide approach (paragraph 17.8).
2.39. The key strengths of the RAISE programme included the devolution of funding
directly to schools (paragraphs 17.10-17.12); the way in which it addressed the
impact of both pupil level and school level socioeconomic disadvantage
(paragraphs 17.16); and the impetus given to strengthening consortium working
in two areas (paragraphs 17.17).
2.40. The key weaknesses of the RAISE programme included the way in which funding
was devolved directly to schools paragraph (17.19); the rush to develop the
programme and the initial failures to adhere to either systems thinking or tri-level
reform in its planning or operation (paragraph 17.20); schools’ planning for the
transition of RAISE pupils from Key Stage 2 to 3 (paragraph 17.23); the time
limited nature of the funding (paragraph 17.24-17.25); and the limited overall
impact upon pupils who were not targeted for support (paragraph 17.26).
Recommendations
2.41. RAISE supported the commitment in the Learning Country: Vision Into Action
(WAG, 2006c), the Welsh Government’s overarching strategy for learning, to
“narrow the gap” between the attainment of pupils from more and less
socio-economically disadvantaged backgrounds. It represented one of a range of
initiatives that supported this goal4 and a key conclusion of this evaluation is that all these activities should clearly relate to an overall strategy for raising the
achievement of disadvantaged learners and narrowing the gap in performance
between them and other learners. In that context, this evaluation has identified
the need for specific action on the part of schools, Local Authorities and the
Welsh Government. It is critical that these actions combine to form a coherent
approach across all three of these levels of the education system.
Schools should:
2.41.1. Ensure that the nature of the link between socioeconomic disadvantage and poor
educational attainment is both widely recognised and understood by school
leaders, teachers and support staff.
2.41.2. Ensure that school leaders, teachers and support staff have high expectations of
socioeconomically disadvantaged pupils, so that the link between socioeconomic
4
These include and included initiatives that are part of the School Effectiveness Framework, the National Attendance and Behaviour Review and Strategy, the statutory guidance and regulation on inclusion and pupil support and on the health, education and well-being of children looked after by Local Authorities and the forthcoming child poverty strategy, which all include measures to support socioeconomically disadvantaged pupils and their families.
disadvantage and poor educational attainment is never an excuse for
under-achievement.
2.41.3. Improve their capacity to both identify and meet the needs of all
socioeconomically disadvantaged pupils, including children looked after by Local
Authorities and those with moderate and high levels of achievement.
2.41.4. Integrate interventions aimed at raising the attainment of socioeconomically
disadvantaged pupils, such as literacy support, into whole school strategies to
raise attainment.
2.41.5. Work with others so that the symptoms of socioeconomic disadvantage and its
root causes can be tackled in a coordinated way. This is likely to involve
engagement with parents, carers and the community and a range of public and
voluntary sector partners.
2.41.6. Improve the evaluation of the impact of their work to identify and support
socioeconomically disadvantaged pupils, using both headline indicators, such as
the achievement of expected levels at each Key Stage, and complementary
indicators, such as measures of gains in basic skills and social and emotional
skills and dispositions.
2.41.7. Work with others schools in their cluster to ensure a continuity of support when
socioeconomically disadvantaged pupils make the transition from primary to
secondary school.
RAISE suggests that Local Authorities should:
2.41.8. Work with schools to help them embed changes that successfully support
socioeconomically disadvantaged pupils so they can be more easily sustained.
2.41.9. Target additional support at socioeconomically disadvantaged pupils in schools
with a high proportion of pupils eligible for FSMs, who are likely to be doubly
disadvantaged.
2.41.10. Monitor and evaluate the performance of FSM pupils in schools and use this
information to inform strategies to support and, where appropriate, challenge
schools that are not raising the attainment of socioeconomically disadvantaged
pupils.
2.41.11. Robustly monitor and evaluate the performance of socioeconomically
disadvantaged pupils (including children looked after by Local Authorities) at a
Local Authority level, benchmarking their performance against other Local
Authorities, including those in their regional consortia, and other groups of pupils
2.41.12. Develop integrated strategies for raising the attainment of disadvantaged
learners that will ensure coherence across local child poverty strategies, the
Children and Young People’s Plan and all social services and education policies.”
RAISE suggests a need for the Welsh Government to:
2.41.13. More effectively analyse the performance of FSM pupils at a Local Authority and
national level, improve access to and publicise this analysis.
2.41.14. Work with inspectorates, such as Estyn, to strengthen the evaluation of the
performance of socioeconomically disadvantaged pupils at a school, Local
Authority and national level.
2.41.15. Ensure that future policies and programmes in this area apply systems-thinking
and tri-level working, so that future funding and initiatives to support
socioeconomically disadvantaged pupils are developed in partnership and
integrated with social justice and social care policies at the national, local and
school level.
2.41.16. Ensure that future funding to support socioeconomically disadvantaged pupils
uses the School Effectiveness Framework for Wales to provide clear objectives,
support and challenge and accountability structures and processes.
2.41.17. Increase the differentiation of school funding to more effectively support the
attainment of socioeconomically disadvantaged pupils.
3. THE CONTEXT FOR RAISE*
5Introduction: the attainment gap
3.1. The relationship between disadvantage and poor educational attainment is clear.
Evidence from the Millennium Cohort Study, a major longitudinal study of
childhood development in the UK, has identified differences in the development of
children from advantaged and disadvantaged families from as early as nine
months. By the age of three, children from disadvantaged backgrounds (defined in
terms of family poverty and low level parental education) are up to a year behind
children from more advantaged families (Feinstein, et al, 2007).
3.2. The gap in early childhood development contributes to the gap in educational
attainment as children progress through school. Children from disadvantaged
backgrounds tend to start behind their more advantaged peers and tend to fall
further behind as they progress through school. Perhaps even more strikingly,
evidence from the 1958 and 1970 Cohort studies shows that even when children
from disadvantaged backgrounds start off in the top quarter of pupils in reading
and maths they tend to fall behind as they progress through school (Feinstein, et
al, 2008). A similar pattern was found in a recent Joseph Rowntree Foundation
sponsored study of children’s progress between 1998 and 2003 (Cassen &
Kingdon, 2008).
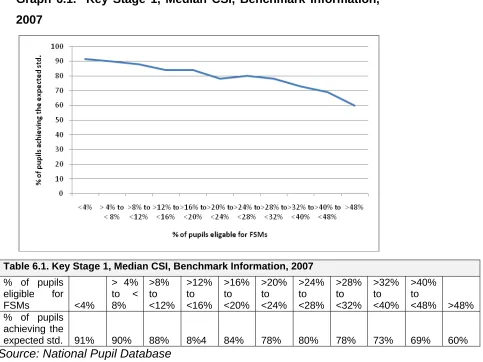
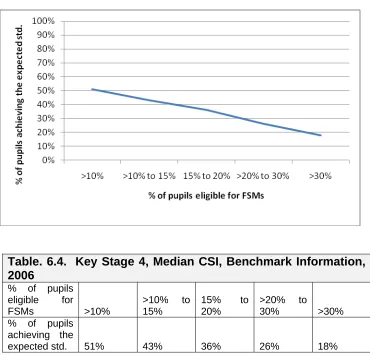
3.3. Benchmarking data can be used to explore the attainment gap. This groups
schools with similar proportions of pupils eligible for FSMs into bands, such as
schools with less than 10% of their pupils eligible for FSMs. It enables the
performance of schools, measured by the percentage of pupils reaching the
expected level at each key stage, to be compared with that of pupils in other
schools in the same band and with schools in other bands.
5
This section is adapted from Holtom & Sims, 2008
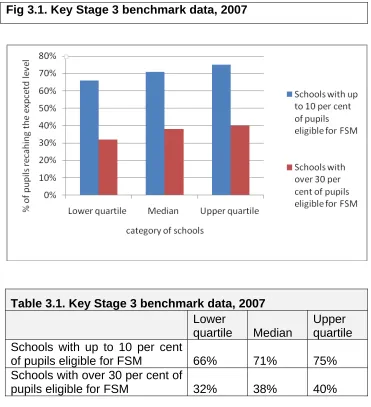
3.4. Graph 3.1. uses benchmarking data for 2007, the first year of RAISE to explore
and illustrate the attainment gap between the performance of pupils in schools in
Wales with high (>30%) and low (<10%) overall proportions of pupils eligible for
FSMs, in Key Stage 3, where the gap is widest. In order to compare the range of
performance of pupils in schools in these two categories of schools (i.e. high and
low FSM schools), three measures are used:
• the upper quartile, the value that separates the average attainment of pupils in the top quarter of schools from the remaining three quarters of schools, which
provides an indication of the performance of pupils in a relatively high performing
school in each of the two categories;
• the median, the value that separates the average attainment of pupils in the top half of schools from the bottom half of schools, and which provides an indication of
the performance of pupils in middling performing schools in each of the two
categories; and
• the lower quartile, the value that separates the average attainment of pupils in the bottom quarter of schools from the remaining three quarters of schools, and which
provides an indication of the performance of pupils in lower performing schools in
each of the two categories.
3.5. Graph 3.1 uses these three measures to compare the performance of pupils in
each of the two categories. Most notably it illustrates the difference between the
performance of pupils in the upper quartile of schools with more than 30% of their
pupils eligible for FSMs which represent relatively high performing schools in this
category, and the performance of pupils in the lower quartile of schools with less
than 10% of their pupils eligible for FSMs, which represent relatively low
performing schools in this category. The comparison shows that the performance
of pupils, in even the relatively high performing schools in the high FSM category
lags behind the performance of pupils in relatively poorly performing schools in the
low FSM category.
Fig 3.1. Key Stage 3 benchmark data, 2007
Table 3.1. Key Stage 3 benchmark data, 2007 Lower
quartile Median
Upper quartile Schools with up to 10 per cent
of pupils eligible for FSM 66% 71% 75% Schools with over 30 per cent of
pupils eligible for FSM 32% 38% 40%
Source: National Pupils Database
Factors that influence educational attainment
3.6. In exploring why the attainment of children from different backgrounds differs so
much, research has identified a range of factors that influence attainment. These
can be grouped under three themes, which we discuss in detail below:
• Individual characteristics and capabilities;
• The family; and
• Schools.
3.7. The key individual characteristics that are positively linked to attainment include
gender (girls typically performing better than boys)6; belonging to certain ethnic groups7; good behaviour and attendance; cognitive and non-cognitive skills; the absence of special educational needs; being born earlier in the school year; strong
prior attainment; high aspirations and a strong motivation and desire to learn
(Duckworth et al, 2009; Feinstein, et al, 2004). Crucially many of these factors are
associated, meaning they can have a cumulative effect when a child or young
person is exposed to multiple risk factors due to, for example, their gender,
ethnicity and special educational needs.
3.8. The key family characteristics that are positively linked to attainment include: a high socioeconomic status (including factors such as having parents who are
employed and have a high income); a rich “home learning environment” (e.g.
reading regularly to children) and parental engagement in education; parental
aspirations and interest in their child’s education8; not growing up in care (i.e. not a looked after child); growing up in a stable family with good relationships between
family members; growing up in a smaller family; having parents, and in particular
mothers, with high levels of prior education; and not being born to a teenage
mother (Duckworth et al, 2009; Feinstein, et al, 2004). As with an individual’s
characteristics and capabilities, many of these family factors are associated or
inter-related with each other, so that for example:
• Family size is correlated with parental education;
• Teenage mothers tend to have lower levels of educational attainment than older mothers; and
6
For example, at Key Stage 3, where the gap is largest, the percentage of girls achieving the CSI has been between 9 and 10 percentage points above the percentage of boys achieving the CSI (WAG, 2010).
7
For example, a higher percentage of pupils from a Chinese or Chinese British ethnic background achieved the CSI than any other ethnic group at all the Key Stages; while the Black ethnic group had the lowest percentage of pupils achieving the CSI at each Key Stage (WAG, 2010).
8
“parental aspirations are key factors in the attainment of young people, perhaps even more important than other family and parent characteristics. Recent studies indicate that parental aspirations may have a greater effect on national test scores than other parental variables such as health, values, and involvement in learning.” (p. v, Duckworth et al, 2009)
• Many children looked after by Local Authorities have grown up in unstable, sometimes fractious families with poor home learning environments.
3.9. The key school characteristics that are positively linked to attainment include: attending “effective” schools (that is to say, schools that “add value”, and whose
pupils do better than the norm when factors such as their prior attainment,
ethnicity and socio-economic status are taken into account); schools with a low
proportion of pupils eligible for free school meals (FSMs)9 (a proxy indicator of socioeconomic disadvantage); schools with a low proportion of pupils whose
second language is English; schools with high levels of attainment; and attending
schools with a high proportion of girls (Duckworth, et al, 2009).
The link between disadvantage and poor educational attainment
3.10. Some of these factors, such as the quality of teaching in a school or the quality of
interactions between parents and children, directly influence attainment or
children’s capabilities. Others, such as parental levels of education and the
socioeconomic context in which a school operates, have a more indirect effect:
they “influence” and “constrain” other factors. (Feinstein, et al, 2004). For example,
parents’ education is one of range of factors that influences the way they interact
with their children and as we explore further below, the socioeconomic context in
which a school operates is one of a range of factors that can influence the quality
of teaching in the school. This helps explains how factors such as socioeconomic
disadvantage can influence attainment.
3.11. As we summarise below, many, but by no means all of these factors, are
correlated with, linked to or caused by socioeconomic disadvantage. Nevertheless,
there is no intrinsic link between socioeconomic disadvantage and poor
educational attainment. Not all children from disadvantaged backgrounds are
exposed to risk factors associated with poorer educational attainment, such as low
9
Although there is an inverse relationship between the proportion of pupils eligible for free school meals and average attainment of pupils, because the relationship is non linear, there is no tipping point, or tipping phase, after which average attainment drops precipitously.
levels of parental education and attending schools in socioeconomically
disadvantaged areas, and some children from disadvantaged backgrounds
achieve ‘against the odds’.
• Individual characteristics and capabilities – the British Cohort studies
demonstrate that children from disadvantaged backgrounds tend to have lower
levels of cognitive development (the ability to learn) and have more behavioural
problems. In school this can manifest itself in poor literacy and numeracy and
weak social and emotional skills, leading to problems in accessing the curriculum
and forming relationships with peers and teachers and, consequently, alienation
from school. This failure can undermine children and young people’s belief in their
ability to learn (their self-efficacy), and consequent motivation to learn. Children
and young people who don’t see the value or point of education are also likely to
have low levels of motivation to learn (Feinstein, et al, 2007)
• Poor or ineffective support – research suggests that children from more
disadvantaged backgrounds tend to get less effective support and encouragement
from adults, most notably parents, but also from professionals such as teachers,
youth workers, education welfare and social workers (Jones, 2005; Desforge &
Aboucher, 2003).
• The challenges facing schools with a high proportion of disadvantaged
pupils – Ruth Lupton’s work (2004, 2005) suggests that without additional funding, schools with a high proportion of pupils eligible for FSMs often find it more difficult
to establish the elements of an ‘effective school’. For example, teachers and
school leaders may be forced to spend more time ‘fire-fighting’, coping with
problems such as poor behaviour, than teaching and planning.
3.12. These factors are interlinked, and often mutually reinforcing, so a pupil who enters
school with poor levels of literacy, numeracy and weak social and emotional skills
will often struggle in school and may become disaffected and disruptive. As a
consequence their parents may provide less support and encouragement, whilst
their teachers find they are devoting more time to trying to control their behaviour
and less time to teaching them, further slowing their progress.
3.13. In conclusion, the evidence from research suggests that schools account for
approximately 15% of the differences in pupil attainment in secondary schools
(Cassen & Kingdon, 2007) and potentially more when family and individual
characteristics are particular weak (Duckworth, et al, 2009). Moreover, the
Narrowing the Gap studies (see boxed text) clearly demonstrate that some schools
are more successful than others in tackling the link between disadvantage and
poor educational attainment.10 Equally, given the range of different factors that influence attainment, there are limits to what schools acting alone can achieve.
Narrowing the Gap
The Narrowing the Gap studies, reports of a task-and-finish group of the Welsh
Government and the Welsh Local Government Association, examined the factors
that contribute to the gap in performance between primary schools (phase 2) (WAG
& WLGA, 2004) and secondary schools (phase 1) (WAG & WLGA, 2002) serving
disadvantaged and more advantaged areas. The studies identified a number of
factors necessary for driving school effectiveness, which in turn contributed to
higher attainment, including:
• Effective leadership and management11,
• Being community focused and working with others12
10
Although given the range of factors, there is inevitably a limit to the difference a school alone can make to pupil attainment.
11
The phase 1 study highlights the importance of “Having key personnel in a position to drive school improvement” and the phase 2 highlights the importance “Leadership: the head teacher’s leadership, leadership throughout the school and the leadership of the governing body”; and “Efficient and effective organisation and management”.
12
The phase 1 study highlights that “Developing the community focus of the school as a resource to be used by all ages in the community raises the profile of education and brings with it the potential for multiple benefits for learners, schools and their communities.” The phase 2 study highlights the importance of “The engagement and commitment of pupils and their parents”; and “Mutual support,
• A strong focus upon Improvement and Accountability13 • Effective Intervention and Support14
• Monitoring of learning and teaching and promotion of effective practice
• Making effective use of attainment data; and
• Effective curriculum and teaching, underpinned by Networks of Professional
Practice.15
These are consistent with research into school effectiveness, reflected in the School
Effectiveness Framework for Wales (WAG, 2008b).
validation and valuing from all those connected with the school”. “All the schools had a central characteristic: A productive, strong and highly inclusive culture that focused on ensuring effective and enriched teaching and learning for all pupils and improving and further enriching teaching for learning for all pupils”
13
The phase 1 study highlights the importance of “Monitoring of learning and teaching”; and “Making effective use of attainment data”.
14
The phase 1 study highlights the importance“[supporting] Key Stage 2 to Key Stage 3 transition”, “Behaviour management”; “ Securing regular pupil attendance” and the “development of literacy skills”. 15
The phase 1 study highlights the importance of the “promotion of effective practice” and the phase 2 study highlights the importance of “The teaching team: working together to fully utilise and improve their expertise”.
4. AIMS AND OBJECTIVES OF THE EVALUATION
4.1. The aim of this evaluation is to assess the impact and effectiveness of the RAISE programme and the objectives of the evaluation are to:
• Assess the extent to which the overall aims and objectives of RAISE have been met;
• Determine the contribution of RAISE to improvements in individual standards of education of the pupils targeted for support[16];
• Identify the keys strengths of RAISE and any constraints/issues that may have
impeded its effectiveness;
• Assess the value for money of the programme including its contribution to improvement in individual standards of education in schools in Wales; on long
term capacity building in school improvement and in improving the educational
attainment of children looked after by Local Authorities as well their attainment in
further education, higher education and training;
• Provide recommendations as to how the Welsh Government, Local Authorities and schools can best build upon the RAISE programme, drawing on best practice
and lessons learned from the initiative and, where appropriate, other similar
schemes; and
• Consider the effectiveness of the role played by the Welsh Government and Local Authorities in supporting the RAISE programme and, in particular, any new
posts created to support the implementation of the RAISE initiative and the work
undertaken by Schools Improvement Professionals in connection with RAISE
funding.
4.2. The evaluation was also required to consider the following questions and issues:
16
This objective was potentially ambiguous because “standards” are used to describe both the standards of education attained and the quality of education (Cambridge Primary Review, 2009). It was agreed with the RAISE Project Leader that the evaluation objective referred to the standards of education attained and this objective is therefore addressed through our discussion of the impact of RAISE upon pupils’ attainment and achievement.
• The RAISE programme’s alignment with Welsh Government objectives and with local policy and strategies;
• Evidence of the impact of RAISE in terms of improving individual standards of achievement in schools; the delivery of educational outcomes (or potential for
delivering) on pupils receiving support, including looked after children;
• The programme’s overall cost effectiveness, value for money and any continuing
need to spend;
• The impact of RAISE in promoting integrated and coherent responses to pupils’ needs including the use made of established good practice in school
improvement and multi-agency working; and
• RAISE’s impact on Local Authority’s role as both corporate parent and educating authority for looked after children
And to capture what can be learned from the programme including:
;
• Any unintended or unexpected impacts that occur
• The aspects of the programme that are most effective, the barriers that have been faced and what could be improved;
• How effectively the Welsh Government's vision and objectives in making the RAISE funding available was communicated to, and shared by, schools and
Local Education Authorities; and
• The sustainable of projects supported by RAISE.
5. METHODOLOGY
Evaluation of RAISE funding for schools
5.1. There was a widespread fear at the start of the evaluation of RAISE that the
programme was going to be “over-evaluated”. Interviewees from schools and
Local Authorities consistently pointed to the multiple layers of monitoring and
evaluation, including, on an annual basis:
• Schools’ self-evaluations;
• Local Authorities’ reviews of RAISE;
• RAISE Regional Co-ordinators’ evaluation reports; and
• Estyn’s remit to review RAISE funding.
5.2. In response, the People and Work Unit committed itself to working with and
making full use of these different layers of evaluation and only undertaking
fieldwork and analysis where these different layers of evaluation could not supply
the information required by the external evaluation. This both minimised the risk of
unnecessary duplication of time and effort, reducing the burdens placed upon
RAISE’s stakeholders, and enabled the triangulation of data, by using multiple
sources. As a consequence, the external evaluation of RAISE funding for schools
draws upon six key sources, which we discuss in detail below:
• A review of the RAISE database;
• A rolling literature review;
• Visits to 60 RAISE funded schools;
• A review of the reports prepared by Regional Coordinators;
• A review of Estyn’s three reports on RAISE (Estyn, 2007, 2008, 2009); and
• Interviews with seventeen key stakeholders.
5.3. It was envisaged that school self-evaluations could also be used. However an
initial review of a sample of 80 school self-evaluation returns, drawn from five
Local Authorities17, in order to assess their potential for use by the evaluation found that because different schools had measured different things in different
ways, it was not possible to use the self-evaluations to generate comparable data
on pupil performance. The review also suggested there were some methodological
weaknesses in most schools’ self-evaluations, including the lack of time series
data and data on comparison groups, that made their use problematic (Holtom,
2008).
5.4. Because school self-evaluations could not be used to assess the aggregate impact
of RAISE upon pupil attainment, an analysis of the attainment of pupils eligible for
FSMs, as a proxy indicator of their inclusion in the RAISE programme, was
planned. There were delays in the release of the data and the team working on the
data encountered technical problems, which meant that they were overtaken by
Estyn, who undertook and published a similar analysis in 2008 and 2009, which
we make full use of.
5.5. It was also planned that the evaluation would also draw upon an in-depth analysis
of data on pupil attainment over the last six years. However, delays in the release
of this data meant that it was not possible to complete the analysis in time for this
report.
5.6. Analysis of the RAISE Database: Schools eligible for RAISE funding were
required to prepare a pro-forma outlining their proposed use of grant and to then
agree this with their Local Authority. In early 2007 we reviewed 626 of the 648
school proposals18 (pro-formas) and recorded information on the expected outcomes of the work (e.g. improvements in literacy and numeracy, improvements
in children and young people’s social and emotional skills) and the means of
achieving these outcomes (e.g. employing a Learning Support Assistant,
17
Flintshire, Gwynedd, Cardiff, RCT and Pembrokeshire .The counties were selected to provide a reasonable spread across primary and secondary, rural/urban settings, English/Welsh medium, and the four regions. We looked at returns from primary and secondary schools in each of these counties
18
A small number of school proposals were either not in the files during the time of review or were inadvertently missed.
establishing a nurture group). We used this to develop a database that provided an
overview of RAISE funded work in schools.
5.7. Literature review: As part of the scoping work for this evaluation a short focused
review of the literature was undertaken. Although there was not sufficient time nor
resource to undertake a systematic review of the literature, this review was able to
draw upon a number of earlier reviews, including the Narrowing the Gap studies
(WAG & WLGA, 2002, 2004); a rapid evidence assessment of interventions that
attempt to overcome the link between deprivation and educational attainment
(Arad, 2007) commissioned for RAISE, and a series of reviews of education and
poverty commissioned by the Joseph Rowntree Foundation (Cassen & Kingdon,
2007; Egan, 2007; Raffo, et al, 2007).
5.8. The initial scoping review had been ‘refreshed’ throughout the evaluation, drawing
upon a range of studies published after the initial review, including the Bramley
review of school funding (Bramley & Watkins, 2007) and subsequent research into
outcomes based funding (Matrix Evidence, 2009); a rapid evidence assessment of
the interventions that attempt to improve behaviour and attendance in schools and
other learning settings (Sims, et al, 2008); reviews by the Child Poverty Expert
Group (2008) and National Assembly for Wales’ Children’s Committee into the
links between poverty and poor educational attainment (NAfW, 2008); research
into the impact of support staff upon pupils and teachers (Blatchford, 2009);
research from England into the links between poverty and poor educational
attainment (e.g. DCSF, 2009); and a systematic review of the literature on young
people’s disengagement from learning (Bowen, et al, 2010).
5.9. Visits to RAISE schools: Analysis undertaken for our first interim report on
RAISE funding for schools (Holtom, 2008a) identified a number of issues that
warranted further investigation through visits to schools, including:
• The relationship between RAISE funded work and non-RAISE funded work in the school and the contribution and ‘added value’, if any, of RAISE funded work to
non-RAISE funded work, and of non-RAISE funded work to RAISE funded work;
• The relationship between RAISE funded work in primary and secondary schools in different clusters;
• The impact, if any, of RAISE funded work on pupils, the school itself, the
community and Local Authority;
• The efficacy of different RAISE funded approaches;
• The links between RAISE funded strategies in schools and local policies, such as Children and Young People Plans, Community First Partnership plans and RAISE
funding for Children looked after by Local Authorities; and
• How schools responded to the opportunities created by RAISE’s devolved
structure, and the effectiveness of the support provided by Local Authorities
(including Regional Coordinators).
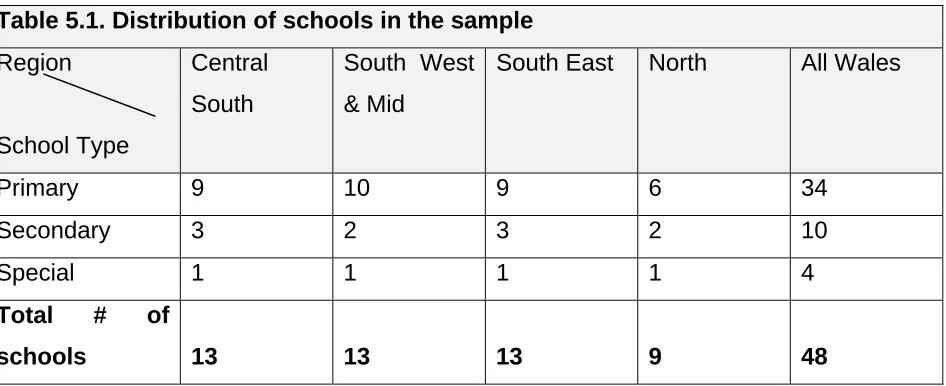
5.10. 48 schools were visited in the second year of evaluation. In order to construct the
sample, a methodology for identifying schools was developed. The methodology
was intended to ensure that the sample of schools that we visited included a range
of schools that had adopted one of the three broad approaches to using RAISE
funding highlighted in the analysis for the first Interim report, i.e.:
• A focus in particular upon enhancing literacy and numeracy through classroom based interventions;
• A focus in particular upon developing a supportive environment for young people,
such as, developing home-school links, developing their social and emotional skills
and enhancing pastoral support; and
• A focus in particular upon systemic change by, for example, using RAISE funding to develop their school improvement strategies.
5.11. The methodology was also intended to ensure that the sample included a range:
• of schools from the four different regions (Central South, North Wales, South East and South West and Mid Wales); and
• Primary, secondary and special schools with different characteristics (e.g. rural/urban).
[image:33.612.74.547.216.409.2]5.12. The methodology produced the sample outlined in table 5.1.
Table 5.1. Distribution of schools in the sample Region
School Type
Central
South
South West
& Mid
South East North All Wales
Primary 9 10 9 6 34
Secondary 3 2 3 2 10
Special 1 1 1 1 4
Total # of
schools 13 13 13 9 48
5.13. Having identified the number of schools we wished to visit in each region, schools
were selected in consultation with Regional Coordinators and then were
approached by members of the PWU’s research team (Sarah Lloyd-Jones, Rhodri
Bowen, Bethan Wyn-Jones and Duncan Holtom). Participation in the evaluation
was voluntary and a small number of schools chose not to participate.
5.14. Schools were visited over a two month period in late 2008. Wherever possible, the
research team spoke to a member of the school’s senior management team,
teachers and support staff involved in RAISE and children or young people
targeted by RAISE. Semi-structured interviews were used.
5.15. Our second Interim Report on RAISE funding for schools (Holtom, 2008) identified
the need to better understand a series of themes, issues and challenges:
• multi-agency working;
• schools approaches to measuring and evaluating the impact of RAISE upon attainment and achievement;
• the role, potential and impact of support staff, such as Learning Support
Assistants (LSAs), given research suggesting a mixed impact (Blatchford, et al,
2009); and
• the scope to use short term project funding, like RAISE, as an investment in sustainable change.
5.16. In total, 12 primary and secondary schools from across Wales were visited over
the period January-March 2010. As before, potential schools were identified
through consultations with Regional Coordinators, and then approached, and if
willing, visited by members of the People and Work Unit’s Research team who
spoke to school leaders and, in some cases, teachers and support staff and pupils.
5.17. This approach, which relied upon the knowledge and judgment of Regional
Coordinators in identifying schools to visit, was not intended to result in finding a
representative sample and the sample of 60 schools visited cannot necessarily be
considered representative of all RAISE schools. However, as the emerging
findings have been regularly presented to, and discussed with, Local Authority
representatives and the school visits have been contextualised with the findings of
Regional Coordinators and Estyn (discussed below), we are confident that, taken
together, the different sources of data enable us to make evaluative judgements
about RAISE with a reasonable degree of confidence.
5.18. Regional Coordinators Reports: Regional Consortia are required to produce an
annual report based upon visits to schools and discussions with Local Authorities
which the Coordinators’ agreed should outline responses to five key questions
developed through discussions between the Welsh Government Regional
Coordinators and the PWU:
• How well do schools understand the overall aim of RAISE?
• How effectively are schools monitoring and evaluating their RAISE activities?
• How well are schools progressing in respect of the aims and key features of the RAISE programme?
• How well are schools planning to sustain the benefits of the RAISE programme?
• How could the RAISE programme develop further?
5.19. Estyn: Estyn’s remit has included a review of the impact of RAISE. Their first
report (Estyn, 2007) evaluated “the extent to which schools that receive the RAISE
grant are working with their Local Authorities to promote the Welsh Government’s
social justice agenda by addressing the link between socioeconomic disadvantage
and under achievement” (p. 1, ibid). The report is based upon visits to a sample of
RAISE schools and eight Local Authorities19 and explores how schools and Local Authorities initially took forward RAISE funded work, including planning and
managing the work and establishing monitoring and evaluation systems (ibid.).
5.20. Estyn’s second report has a “particular focus on how effective it [RAISE] was in
helping schools and Local Authorities to tackle the underachievement of pupils
with socioeconomic disadvantage” (p. 5., Estyn, 2008). It is based upon findings
from the visits of HM Inspectors to 19 primary schools, 10 secondary schools, six
specials schools and five Local Authorities. It considers the “impact of RAISE upon
standards”, including the gap between the performance of learners entitled to
FSMs and other learners; “the implementation of RAISE in schools”; and “National,
regional and Local Authority issues” (pp. 6-7, ibid.).
5.21. Estyn’s third report (2009) evaluates the third year of the RAISE programme, the
“focus...[of the report] ...is on the effectiveness of the programme in helping to
raise the performance of disadvantaged pupils” (p. 1, Estyn, 2009). The report is
based upon visits to 25 primary schools, 13 secondary schools, three special
schools and eight Local Authorities. The report considers the impact and legacy of
19
27 primary schools, 10 secondary schools and three special schools.
RAISE, the use of RAISE funding by schools and the leadership and management
of RAISE.
5.22. Estyn’s fourth report (2010), considers RAISE, but has a wider focus, and “looks at
how schools are tackling child poverty and disadvantage in Wales” (p. 1, ibid). It
draws upon evidence from the three earlier Estyn reports on and from inspection
reports on schools and Local Authorities.
5.23. Key stakeholder interviews: over the three years of the evaluation, seventeen
key stakeholders from the Welsh Government, Local Authorities and academic
and voluntary sectors were interviewed. A full list is included in Section 18.
Evaluation of RAISE funded work for Children looked after by Local Authorities
5.24. As with RAISE funding for schools, because Local Authorities were required to
undertake their own self-evaluations and maintain a detailed database of each
looked after child supported by RAISE, there was a considerable amount of data
that could be used by the external evaluation, although unlike RAISE funding for
schools, this was not covered by Estyn’s remit. This was complemented, where
needed, by additional fieldwork. This report therefore draws primarily upon seven
key sources of data:
• An initial scoping review of the literature on the educational experiences and achievement of children looked after by Local Authorities (Holtom, 2008),
updated and refreshed throughout the course of the evaluation;
• A review of Local Authorities’ self-evaluation returns;
• Two rounds of interviews with looked after children’s education (LACE) coordinators or other Local Authority staff involved in RAISE funded work for
children looked after by Local Authorities;
• Interviews with children looked after by Local Authorities in two Local Authorities (Pembrokeshire and the Vale of Glamorgan)
• A statistical analysis of the quantitative data on the characteristics, circumstances and attainment of children looked after by Local Authorities,
drawing upon the RAISE LAC database and data published by the Data Unit
Wales;
• A systematic review of Children and Young People’s Plans, noting any references to RAISE funded or other work to support children looked after by
Local Authorities; and
• Interviews with three key stakeholders from the Welsh Government and Voluntary Sector (a full list is included in the appendix).
6. DID RAISE TARGET DISADVANTAGED PUPILS?
6.1. As outlined in the introduction, RAISE funding was directed at schools with 50 or
more statutory-school-age pupils, where 20% or more of those pupils were eligible
for FSMs.20 Schools were then required to target disadvantaged pupils within their schools. In order to assess whether RAISE targeted disadvantaged pupils, we
have focused upon three questions in our evaluation:
• Was eligibility for FSM an effective way of identifying disadvantaged pupils?
• Was the threshold for inclusion in RAISE (i.e. that at least 20% of the pupils needed to be eligible for FSMs), an effective way of targeting support for
disadvantaged pupils? And
• Did RAISE funded schools target disadvantaged pupils appropriately and effectively?
Is eligibility for free school meals an effective way of identifying disadvantaged pupils?
6.2. Although as outlined in section 3, the link between socioeconomic disadvantage
and poor educational attainment is clear, there are no direct measures of pupil
poverty at a school level, making the identification of disadvantaged pupils difficult.
FSMs are the most widely used proxy indicator, but remain an imperfect measure.
For example, rates of FSMs:
• vary considerably between schools, due in part to differences in take up of FSMs;
• provide only a proxy indicator of disadvantage, reflecting, in part, the well-established link between low income and poor educational attainment but not
capturing the other factors, such as the mother’s levels of education, which are
associated, but not synonymous, with low incomes and which contribute to this
link; and
20
It is important to note that the criteria was eligibility rather than take up, which is more inclusive, because, as we discuss on page 26, not all pupils eligible for Free School Meals take up this entitlement.
• is a binary measure, which does not allow for the degree of disadvantage to be considered; for example, it does not discriminate between those children and
young people who are in families just above the thresholds for eligibility for FSM
(and who may be little more disadvantaged than those just below the threshold)
and those who are substantially above the thresholds (and who are unlikely to be
disadvantaged). (DCSF, 2009; Shepherd, 2009 citing research undertaken by
Caci).
Eligibility for Free School Meals
Children are only eligible for FSMs if their parents or guardians are entitled to:
• Income Support, payable to those on a low income who are not required to look for work (e.g. lone parents, carers and those who are sick or disabled);
• Income Based Job Seekers Allowance (JSA), payable to those on a low income who are required to look for work in order to qualify for benefits; or
• Immigration Asylum Seekers Allowance
6.3. Given the problems with FSMs as a measure of the disadvantage of a school’s
pupil population, alternative ways of identifying disadvantaged pupils have been
considered. The principal alternative has been proposals to use an area based
measure of disadvantage such as the Welsh Index of Multiple Deprivation (WIMD)
(see boxed text). This would avoid problems such as the variations in the take up
of FSM. It is also a more holistic measure that captures important factors linking
disadvantage and poor attainment, such as lower levels of parental education, that
are not reflected in eligibility for FSM. As an area based measure, the WIMD
could also help target pupils who are doubly disadvantaged by the poverty of their
family and by the poverty of the area in which they live in.
The Welsh Index of Multiple Deprivation
The Welsh Index of Multiple Deprivation (WIMD) is the official measure of
deprivation in small areas in Wales. The small areas the WIMD covers are known
as Lower-Layer Super Output Areas (LSOA). In total, there are 1,896 LSOAs in
Wales and each has about 1,500 people in it. The index provides a measure of the
relative deprivation of these different areas (the LSOAs). Areas are ranked from
one, the most deprived, to 1,896, the least deprived. An area has a higher
deprivation rank than another if the proportion of people living there who are classed
as deprived is higher.
As assessment of the deprivation of the people in each area is based upon eight
factors known as “domains”:
• income • housing • employment • access to services • education
• health
• community safety • physical environment.
Because it is a relative measure, the WIMD only tells you that an area is more or
less deprived than another area on the index; it cannot be used, for example, to say
an area is twice as deprived as another, only that an area is more deprived than
another.
Source: the Welsh Index of Multiple Deprivation,
http://wales.gov.uk/topics/statistics/theme/wimd/?lang=en
6.4. Nevertheless, there are potential problems with using the WIMD. It is highly
probable that there is a correlation between living in a deprived area (as defined by
the WIMD) and pupil attainment, but we cannot be sure of this. Research in England