www.biogeosciences.net/6/1563/2009/
© Author(s) 2009. This work is distributed under the Creative Commons Attribution 3.0 License.
Biogeosciences
Spatial trends in leaf size of Amazonian rainforest trees
A. C. M. Malhado1,*, Y. Malhi1,**, R. J. Whittaker1,**, R. J. Ladle1,**, H. ter Steege2,**,***, O. L. Phillips3,**,***, N. Butt1,**, L. E. O. C. Arag˜ao1,***, C. A. Quesada3,***, A. Araujo-Murakami4,***, L. Arroyo4,***, J. Peacock3,***, G. Lopez-Gonzalez3,***, T. R. Baker3,***, L. O. Anderson1,**, S. Almeida5,***, N. Higuchi6,***, T. J. Killeen7,***, A. Monteagudo8,***, D. Neill9,***, N. Pitman10,***, A. Prieto11,***, R. P. Salom˜ao5,***, R. V´asquez-Mart´ınez8,***, and W. F. Laurance6,***
1School of Geography and the Environment, Oxford University, UK
2Dept. of Plant Ecology and Biodiversity, Utrecht University, The Netherlands 3Earth and Biosphere Institute, School of Geography, University of Leeds, UK 4Museo Noel Kempff Mercado, Santa Cruz, Bolivia
5Museu Paraense Emilio Goeldi, Bel´em, Brazil
6Instituto National de Pesquisas Amazˆonicas, Manaus, Brazil
7Center for Applied Biodiversity Science, Conservation International, Washington, DC, USA 8Herbario Vargas, Universidad Nacional San Antonio Abad del Cusco, Cusco, Per´u
9Herbario Nacional del Ecuador, Quito, Ecuador
10Center for Tropical Conservation, Duke University, Durham, USA
11Instituto de Investigaci´on de Recursos Biol´ogicos Alexander von Humboldt, Bogot´a DC, Colombia *Conceived the study, collected leaf data, undertook the analysis, wrote manuscript.
**Developed the idea, reviewed and improved manuscript. ***Provided data.
Received: 17 December 2008 – Published in Biogeosciences Discuss.: 23 February 2009 Revised: 17 June 2009 – Accepted: 3 August 2009 – Published: 10 August 2009
Abstract. Leaf size influences many aspects of tree function such as rates of transpiration and photosynthesis and, con-sequently, often varies in a predictable way in response to environmental gradients. The recent development of pan-Amazonian databases based on permanent botanical plots has now made it possible to assess trends in leaf size across environmental gradients in Amazonia. Previous plot-based studies have shown that the community structure of Amazo-nian trees breaks down into at least two major ecological gra-dients corresponding with variations in soil fertility (decreas-ing from southwest to northeast) and length of the dry sea-son (increasing from northwest to south and east). Here we describe the geographic distribution of leaf size categories based on 121 plots distributed across eight South American countries. We find that the Amazon forest is predominantly populated by tree species and individuals in the mesophyll size class (20.25–182.25 cm2). The geographic distribution of species and individuals with large leaves (>20.25 cm2) is complex but is generally characterized by a higher proportion
Correspondence to: A. C. M. Malhado
of such trees in the northwest of the region. Spatially cor-rected regressions reveal weak correlations between the pro-portion of large-leaved species and metrics of water availabil-ity. We also find a significant negative relationship between leaf size and wood density.
1 Introduction
rainfall at low elevation, and to increase and then decrease with elevation in more arid regions. Givnish (1987) also observed that older plants often possess smaller leaves than younger ones of the same species.
The existence of broad-scale (macrogeographic) environment-leaf size correlations probably reflect the evolutionary response of this trait to its environment (Givnish, 1987; Westoby et al., 2002). The size of leaves on a tree can therefore be productively considered as a “so-lution” to the complex environmental “problems” of, most notably, light capture for photosynthesis (Falster and West-oby, 2003), economics of gas and water vapour exchange (Givnish and Vermeij, 1976; Givnish, 1984), avoidance of heat stress from intense sunlight, mechanical stability (West-oby et al., 2002), and defence against herbivores (Moles and Westoby, 2000). Certainly the size of a leaf is by no means ecologically trivial since, as Givnish (1987) points out, leaf size variation will have a direct effect on whole-plant growth rate, mainly through size-related changes in the conductance of the boundary layer, which affects heat exchange, uptake of carbon dioxide and loss of water vapour.
Leaf size theory predicts that the costs and benefits of a “large leaf” or a “small leaf” strategy should vary in a predictable way with environmental parameters such as hu-midity, water availability, and soil fertility (Parkhurst and Loucks, 1972; Givnish and Vermeij, 1976; Givnish, 1978, 1979, 1984; Westoby et al., 2002). Larger leaves have a thicker boundary layer of slow-moving, non-turbulent air and slower convective heat loss and therefore tend to be hotter than ambient air temperature when exposed to net incoming radiation. This can be disadvantageous, especially in areas where water is limiting, because it may lead to higher rates of respiration and decreased rates of photosynthesis (Lloyd and Farquhar, 2008) through the following mechanism: higher leaf temperatures cause a higher water vapour deficit that, in turn, leads to increased transpiration/water loss. The plant adaptively responds to this by closing stomata, which has the net effect of reducing CO2 uptake and reducing the rate of
photosynthesis. Reduced water availability might therefore be expected to favour smaller leaves (Givnish, 1987). With respect to soil fertility, trees growing in oligotrophic (low nutrient) soils may, all other things being equal, be limited in their rate of construction of photosynthetic enzymes and therefore benefit less from temperature-related increases in photosynthetic metabolism – once again favouring the evo-lution and development of smaller leaves (Givnish, 1984, 1987). However, predictions such as these need to be treated with caution and may not hold true under all circumstances since leaves may have other adaptations (e.g. sclerophylly) that strongly influence the optimal leaf size strategy under any particular set of environmental conditions.
The complex nature of the relationship between environ-ment and leaf size is also reflected by the considerable vari-ation in leaf size that can be observed within areas with sim-ilar macroclimatic conditions (Cornelissen, 1999). In other
words, many different leaf size strategies frequently co-exist in physically similar environments. It is likely that within-site (or within plot) variation in leaf size arises because the ecological opportunities for each species are also strongly de-pendent on the other species present in the community (West-oby et al., 2002). Thus, the ability of a species to establish successfully in a habitat may be dependent upon which other species are present and may be influenced by other traits apart from leaf form and size. These complex trade-offs and the multiple selective pressures on leaf size have generated considerable diversity in this trait, even between ecologically similar species (Ackerly, 1996).
Care should also be taken not to interpret everything purely in terms of optimisation of a single trait (leaf size) since developmental and physiological constraints and trade-offs (cf. Dawkins, 1982) may also play a role in determining leaf size. This is clearly illustrated by the associations be-tween leaf size and canopy architecture and branching mor-phology (Midgley and Bond, 1989; Ackerly and Donoghue, 1998). Furthermore, these latter traits may, in turn, influence leaf size evolution independent of ecophysiological function (Ackerly and Reich, 1999). An example of the importance of such trade-offs could be the commonly observed neg-ative relationship between wood density and leaf size (viewed in Wright et al., 2007). The explanation for this re-lationship is still uncertain but may relate to the higher hy-draulic conductivity of trees with low-density wood that al-lows them to deploy a larger total leaf area per stem (Wright et al., 2007). Alternatively, this relationship is perhaps re-lated to the “pioneer-climax” tree gradient or may be due to co-varying factors that do not directly interact and are there-fore difficult to identify. However, the fact that there is still considerable variation in leaf size between species with simi-lar wood densities suggests that this is by no means the whole story.
Despite the fact that ecologists have had a long-standing interest in explaining variations in leaf size between, and within, species and habitats it is still a subject that appears far from resolution. For instance, Westoby et al. (2002) con-sider the leaf size–twig size spectrum of ecological variation as being fundamental to our understanding of the texture and function of forest canopies, but acknowledge that the costs and benefits of large versus small leaf and twig size are still poorly understood. Ackerly and Reich (1999, p. 1279) also feel obliged to admit that, “variation (in leaf size) among species within habitats is still poorly explained”.
to biases stemming from a range of genetic influences such as linkage, epistasis and pleiotropy that are peculiar to the study population, in addition to any influence of natural selection.
In this paper we adopt the broader comparative approach advocated by Givnish (1987). With the recent creation of very large databases of Amazonian trees based on permanent plots scattered throughout the Amazon region it has now be-come possible to conduct a comprehensive study of broad scale patterns of leaf size variation within the largest block of rainforest in the world. Here, we use the RAINFOR database of 121 permanent plots to: 1) describe the spatial distribution of leaf size categories across the Amazon Basin and Guyana Shield, and; 2) investigate the environmental factors driving regional scale patterns in leaf size. We do this to gain further insights into the ecological significance of leaf size and im-prove our understanding of the functioning of the Amazonian rainforest.
Specifically, we seek answers to the following questions: – Which leaf size categories dominate the canopy of the
Amazon rainforest?
– Are there spatial patterns in leaf size distribution in Amazonia?
– Are the frequencies of different leaf size categories as-sociated with environmental variables that reflect their adaptive function (e.g. rainfall, soil fertility, and length of dry season)?
– Are leaf size categories associated with the growth strat-egy of trees?
– Are leaf size and wood density negatively correlated? We will test the following key hypotheses about leaf size in Amazonia: a) small leaves are an adaptation to relatively drier conditions and will show a macrogeographic pattern that reflects this; b) small leaves are favoured on oligotrophic soils; and c) there is a negative relationship between leaf size and wood density.
2 Material and methods 2.1 Database construction
Our main source of data and research tool for exploring spatial variation in leaf size categories across the Amazon basin was the RAINFOR database (Peacock et al., 20071) and 26 plots from the Guyanas and Suriname compiled by the ATDN network (ter Steege et al., 2003). The combined database uses information from 141 permanent plots dis-tributed across eight South American countries. However,
1http://www.rainfor.org
not all data were available for all plots, so plots lacking rel-evant environmental data were removed from certain analy-ses. 20 plots were also excluded from the study because they had>30% of species that were either unidentified at species level (475 species from entire database) or for which herbar-ium/flora data were not available (61 species). As a conse-quence, the number of plots included in the analyses varied from 51 to 121. The database at the time of extraction for this study (August 2006) contained 111 123 individual trees (≥100 mm DBH) from 3324 species.
The plots used in this study span local and regional en-vironmental gradients that naturally occur in Amazonia, in-cluding mature forests that are seasonally flooded, water-logged and non-flooded lowland terra firme forests (88% of plots) on both clay-rich and white-sand substrates. All sites consisted of an apparently mature old-growth for-est with natural gap-phase dynamics and a canopy dom-inated by non-pioneer species. None of the plots is be-lieved to have experienced any recent human-caused dis-turbance. The individual plots range in size from 0.25 to 9 ha (1.17 ha±1.04 = mean±SD) and in total encompass 141.5 ha of forest. The density of stems per plot (includ-ing undetermined stems) ranged from 265 to 1307 per ha (672±167 per ha = mean±SD).
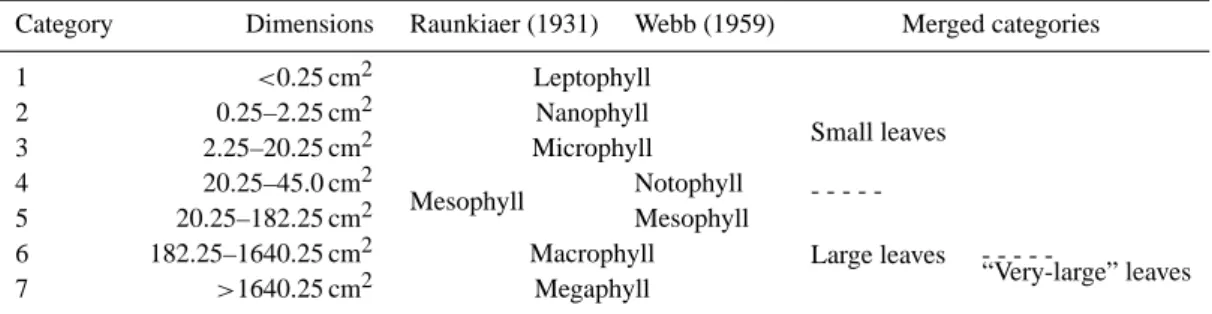
To this existing database, information was added on leaf size for each species (2788) using digital images from flo-ras and herbaria (Table 1). A digital image, representing an average leaf for a particular species, was located us-ing a number of online herbaria. Leaf-size was determined from the herbarium or flora specimen using the geometric leaf-size classification of Raunkiaer (1934) as modified by Webb (1959). Raunkiaer (1934) defined six leaf-size classes: leptophyll (leaves up to 0.25 cm2in area), nanophyll (0.25– 2.25 cm2), microphyll (2.25–20.25 cm2), mesophyll (20.25– 182.25 cm2), macrophyll (182.25–1640.25 cm2), and mega-phyll (>1640.25 cm2). Webb (1959) divided the mesophyll size class into two further size classes (see Table 2): noto-phyll (20.25–45.0 cm2) and mesophyll (45.0–182.25 cm2). 2.2 Leaf size metrics
Table 1. List of floras and herbaria used as information sources and number of species retrieved from each source.
Source Total species
1. Neotropical Herbarium Specimens – The Field Museum 1918
2. New York Botanical Garden 160
3. The Nationaal Herbarium Nederland (NHN) 159
4. Fl´orula de las Reservas Biol´ogicas de Iquitos, Per´u. V´asquez-Mart´ınez (1997) 154
5. Mobot – Missouri Botanical Gardens Herbarium 140
6. Centre IRD de Cayenne, French Guiana 99
7. Instituto Nacional de Pesquisas da Amazˆonia Herbarium, INPA, Brazil 55 8. Botanic Garden and Botanical Museum, Berlin, Germany 18
9. Cain et al. (1954) 18
10. Museu Paraense Emilio Goeldi Herbarium, Brazil 16
11. Oxford University – Plant Science Herbarium, UK 13
12. The Herbarium of the University of Aarhus, AAU, Denmark 9
13. HerbW – Virtual Herbaria Austria 4
14. http://images.nbii.gov/ 2
15. Others 23
Table 2. Derivation and correspondence of leaf size categories used in study. Collapsed categories are used as dependent variables in analyses.
Category Dimensions Raunkiaer (1931) Webb (1959) Merged categories
1 <0.25 cm2 Leptophyll
Small leaves
2 0.25–2.25 cm2 Nanophyll
3 2.25–20.25 cm2 Microphyll
-4 20.25–45.0 cm2
Mesophyll Notophyll
5 20.25–182.25 cm2 Mesophyll
Large leaves
-6 182.25–1640.25 cm2 Macrophyll
“Very-large” leaves
7 >1640.25 cm2 Megaphyll
2.3 Geographic trends in leaf size
Previous studies using the RAINFOR database have sug-gested that forests in Western Amazonia have higher wood productivity (Malhi et al., 2004), higher turnover (Phillips et al., 2004), and lower wood density and biomass (Baker et al., 2004) than forests growing on infertile soils further east. Here, to aid direct comparisons with these studies (including a variety of leaf traits – e.g. Malhado et al., 2009), we follow the practice of splitting the Amazon into four main regions: Region 1, North Amazonia, containing plots from Guyana, Suriname and Venezuela; Region 2, Northwest Amazonia, containing plots from Ecuador, Colombia, and North Peru; Region 3, Central and East Amazonia, all Brazilian plots (states of Amazonas and Par´a only); Region 4, Southwest Amazonia, containing plots from Bolivia and South Peru.
The regional distribution of leaf size might be affected by the distribution of the largest family, the Fabaceae, so anal-yses were repeated both with the Fabaceae removed dataset and within the Fabaceae dataset.
To better detect and visualize regional patterns in leaf size categories, and accounting for tree diameters, we also quantified the relative contribution (proportion) of each leaf size (Categories 1 to 6) across eight tree trunk diame-ter (DBH) classes (100–190 mm, >190–280 mm, >280– 370 mm, >370–480 mm, >480–550 mm, >550–640 mm,
>640–730 mm, >730 mm) for each region. The relative abundance was quantified through a two-stage process: first, the proportion of trees within each DBH category within a re-gion was calculated; second, the relative proportion of each size class across the four regions was calculated (proportion of trees in DBH categoryi and regioni/sum of proportions in
category for all regions). 2.4 Life history metrics
perceived to be pioneers (plants that are specialists in for-est gaps and other disturbed areas). This index reflects the degree of consensus among botanists familiar with the taxa, in this case Oliver Phillips, Rodolfo V´asquez-Mart´ınez, and Abel Monteagudo, and was cross-referenced with herbarium material collector’s labels. To calculate the index each taxon was judged independently by each botanist and given a value between zero (“non-pioneer”) and one (“pioneer”). The pio-neer index was then calculated as the average score for each species. Wood density for each species was calculated using information available in the RAINFOR database (Baker and Lopez-Gonzalez, 2006) and derived from published sources (Baker et al., 2004; Peacock et al., 2007).
2.5 Environmental variables
The choices of independent (predictor) variables for our spa-tially controlled regression models were based on both obser-vation and theory. Since one of the main hypotheses is that small leaves in tropical forests are an adaptation to relatively drier conditions (Givnish, 1984, 1987), we used a series of metrics of precipitation retrieved from the monthly TRMM (Tropical Rainfall Measuring Mission – TRMM 3B43-V6, 0.25◦ spatial resolution). This product combines multiple data sources including satellite information on rainfall with ground precipitation gauge adjustment (Huffman and Bolvin, 2007). These data have recently been shown to accurately represent the rainfall patterns over the Amazonian region (Arag˜ao et al., 2007). For each month we calculate the av-erage mean from 1998 to 2005. The monthly mean sur-faces (one for each month of the year, combining twelve geo-referenced surfaces) were then used to estimate for each pixel: (1) the annual rainfall (mm year−1), based on the sum of the monthly values; (2) the standard deviation (SD) of rainfall within the year, as a measure of seasonality; (3) the maximum climatological water deficit (MWD; mm), calcu-lated by assuming that the evapotranspiration rate is approxi-mately 100 mm month−1in tropical forests and a cumulative deficit is thus incurred if the rainfall is less than this value (Arag˜ao et al., 2007); and (4) the length of the dry season, as the number of months with rainfall<100 mm (Fig. 1). Al-though crude, the MWD is Al-thought to be a useful indicator of meteorologically-induced water stress without taking into account local soil conditions and plant adaptations, and its annual variation has been shown to strongly affect tree mor-tality (Phillips et al., 2009).
Small leaves may also be favoured on oligotrophic soils even under wet conditions (Givnish, 1987) and we there-fore used data on soil fertility (sum of bases), where avail-able (51 plots, Quesada et al., 2009). Soil sampling for the sites was carried out in accordance with a standard proto-col developed for the RAINFOR project2. Soil pits were sit-uated at representative locations for the dominant soil and
2http://www.geog.leeds.ac.uk/projects/rainfor/projdocs.html
topographic positions, usually located a few metres outside the permanent sample plots in order to reduce potential dis-turbances. All soil samples were analysed (Quesada et al., 2009) and exchangeable Ca, Mg, K, Na and Al were de-termined by the silver thiourea method (Pleysier and Juo, 1980) as described in detail in ISRI (1995). The sum of bases (SB) was calculated as: [SB]=[Ca]+[Mg]+[K]+[Na] (Units: mmol kg−1). Soil analyses ranged from regional to global scales and used individual leaf size categories (leaf Categories 1, 2, 3, 4, 5, 6) and clustered categories (small, large, “very-large”) for partial datasets (all trees, Fabaceae removed, only Fabaceae).
2.6 Statistical analysis
Leaf size varied considerably within taxonomic groups in the study, suggesting that it is unnecessary to control formally for phylogeny. However, RAINFOR plots do show a degree of spatial clustering and ecological and physical variables may therefore be more similar (or dissimilar) because of spatial proximity, and it is therefore appropriate to account statisti-cally for spatial autocorrelation (Legendre, 1993). With mul-tiple variables it is a common strategy to perform Ordinary Least Squares (OLS) regressions of response variables (in this case metrics of leaf size) on the raw environmental fac-tors and use Moran’sI correlograms to check for the pres-ence of spatial autocorrelation in the residuals (Rangel et al., 2006). When correlograms showed evidence of spatial auto-correlation we used a spatial filtering approach to control for the influence of spatial position on the relationship between explanatory and response variables. Furthermore, we tested for an association between the sum of bases (plot soil fertil-ity data) and proportion of leaf size categories adjusting for the number of degrees of freedom using Dutilleul’s (1993) method. All spatial analyses were performed using the soft-ware Spatial Analysis in Macroecology (SAM v2) (Rangel et al., 2006).
Trends in the distribution of the various leaf size metrics (see Materials and Methods) in relation to the four Amazo-nian regions (regional analyses) were assessed using a one-way analysis of variance (ANOVA). We used Kruskal Wal-lis test to assess relationship between leaf size categories and pioneer index and wood density. These analyses were performed using SPSS 14.0. Significance level was set at 5% (0.05) for all inferential statistics.
3 Results
3.1 Abundance of leaf size categories
Figure 1
Fig. 1. The spatial distribution of four water availability variables across Amazonia: total annual rainfall, maximum water deficit (MWD), length of the dry season, and standard deviation of total annual rainfall. These data were derived from the Tropical Rainfall Measuring Mission (TRMM – from 1998 to 2005).
0 10 20 30 40 50 60 70
leptophyll nanophyll
P
ro
p
o
rt
io
n
(
%
)
i
n
e
a
ch
s
iz
e
c
a
te
g
o
ry Species
Individuals
nanophyll microphyll notophyll mesophyll macrophyll Species
Individuals
macrophyll megaphyll
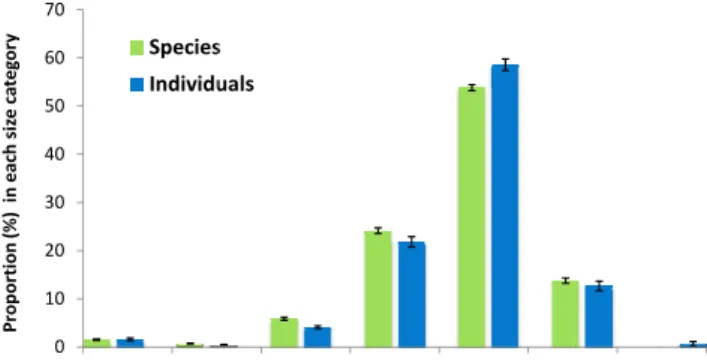
Fig. 2. Mean percentage of species and individual trees in different leaf size categories in 121 Amazonian plots. Error bars=1 standard error of the mean.
excluded from further analysis. The proportion of individual trees that fall into different leaf size categories closely mirror the observed proportion of species: 52.4% of 84 554 individ-ual trees fell into mesophyll category, 1.3% were leptophyll, 0.6% nanophyll, 4.1% microphyll, 18.5% notophyll, 11.9% macrophyll, and 0.6% megaphyll (Fig. 2). Palms account for 10.5% of the total number of individual trees across the stud-ied plots.
Leaf size classes are broadly distributed within and be-tween families. This is clearly illustrated by the proportion of families that contain species in two leaf size categories (24.7%), three leaf size categories (29.6%) or four leaf size
categories (30.9%). Only 13.6% of the families were charac-terized by all their species belonging to a single leaf size cat-egory – although it is important to note that the vast majority of these families contained only 1 or 2 species. The species-rich Fabaceae family is the group with the largest distribu-tion of leaf size categories and is characterised by species that are represented in 6 (out of the 7) leaf classes.
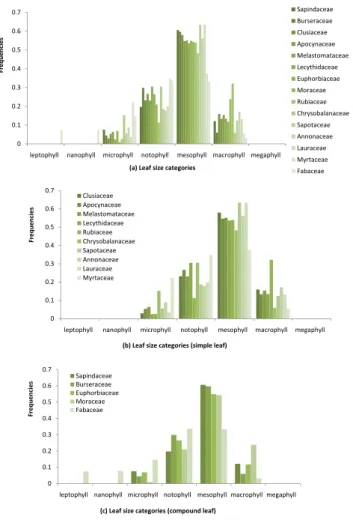
The leaf size distribution of the largest families (those with
>60 species) follows a unimodal distribution with a distinct peak in the mesophyll leaf size category (Fig. 3a). Further analyses on families where all species possess simple leaves and on families displaying at least one species with com-pound leaves (leaflets) also followed a unimodal distribution (Fig. 3b, c). Two families deviate from the general form: the
Fabaceae and Myrtaceae, both of which are characterized by
a flatter distribution (lower kurtosis) of leaf size categories. 3.2 Spatial trends in leaf size
Figure 3
0 0.1 0.2 0.3 0.4 0.5 0.6 0.7
leptophyll nanophyll microphyll notophyll mesophyll macrophyll megaphyll
F
re
q
u
e
n
ci
e
s
(a) Leaf size categories
Sapindaceae Burseraceae
Clusiaceae Apocynaceae
Melastomataceae Lecythidaceae
Euphorbiaceae
Moraceae Rubiaceae
Chrysobalanaceae Sapotaceae
Annonaceae Lauraceae
Myrtaceae
Fabaceae
0 0.1 0.2 0.3 0.4 0.5 0.6 0.7
leptophyll nanophyll microphyll notophyll mesophyll macrophyll megaphyll
F
re
q
u
e
n
ci
e
s
(b) Leaf size categories (simple leaf) Clusiaceae
Apocynaceae Melastomataceae Lecythidaceae Rubiaceae Chrysobalanaceae Sapotaceae Annonaceae Lauraceae Myrtaceae
0 0.1 0.2 0.3 0.4 0.5 0.6 0.7
leptophyll nanophyll microphyll notophyll mesophyll macrophyll megaphyll
F
re
q
u
e
n
ci
e
s
(c) Leaf size categories (compound leaf) Sapindaceae
Burseraceae Euphorbiaceae Moraceae Fabaceae
Fig. 3. Leaf size distributions of the largest (most species rich) fam-ilies (>60 species) in the RAINFOR dataset: (a) all large families; (b) excluding families that have any species with compound leaves; (c) families that have one or more species displaying compound leaves.
found in plots in Region 2. When the analysis is repeated using the two largest leaf size categories (Categories 6 and 7), a significant difference is found between the mean pro-portion of species with leaves in these classes between all 4 regions. In this case, Northwest Amazonia (Region 2) once again has the greatest proportion of species with the largest leaves, followed by Southwest Amazonia (Region 4), Central and Eastern Amazonia (Region 3), and finally, North Ama-zonia (Region 1).
Very similar geographical patterns are observed when we consider relative abundance of individual trees with large leaves (Categories 5 to 7), or “very-large” leaves (Cate-gories 6 and 7).
There is still a significant difference among the four re-gions in terms of the mean proportion of trees with large leaves (and “very-large” leaves) when we control for the pos-sible influence of the numerically abundant Fabaceae family. Specifically, when all the Fabaceae trees are removed from the analysis there was a significant difference observed for
Region 1
Region 2
Region 3
Region 4
Fig. 4. Map of the incidence of species with large leaf size category (Categories 5 to 7) in each plot organized by proportion categories and regions (Region 1, North Amazonia; Region 2, Northwest Ama-zonia; Region 3, Central and East AmaAma-zonia; Region 4, Southwest Amazonia). For the purposes of clear visualisation the positions of some plots within clusters have been adjusted, and may not corre-spond to exact geographic location.
individual trees with large leaves among the regions (n=118,
df =3, F=13.068, p<0.001). Tukey’s post-hoc test reveals two distinct clusters: 1) North and Southwest Amazonia (Regions 1 and 4) that display a lower mean proportion of trees with large leaves, and 2) Northwest Amazonia and Central-Eastern Amazonia (Regions 2 and 3) that display a higher mean proportion of trees with large leaves. An iden-tical geographical pattern and level of significance was ob-served when the proportion of trees with “very-large” leaves (classes 6 and 7) was used as the dependent variable (n=118,
df =3,F=7.464,p<0.001).
When the analysis was repeated within the Fabaceae only we found a weakly significant difference among the regions in the mean proportion of trees with large leaves (n=118,
df =3, F=2.715, p=0.048). In this case Northwest Amazo-nia (Region 2) still contains the largest mean proportion of
Fabaceae trees with large leaves although Tukey’s post hoc
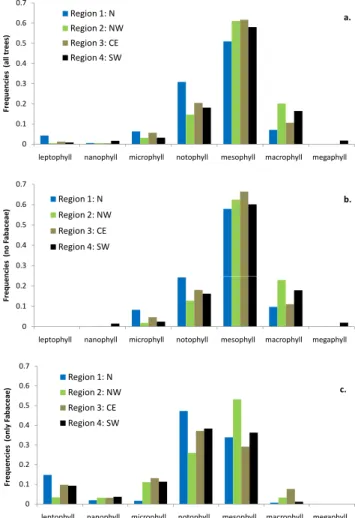
The mean frequency of different leaf size categories shows a consistent pattern across the four Amazonian regions and is characterized by the dominance of individual trees in the mesophyll category (Fig. 5a). Region 1 (North Amazonia) has a slightly larger frequency of smaller-leaved individuals (Fig. 5a). An almost identical pattern of mesophyll domi-nance is repeated when the most numerically abundant and species rich family, the Fabaceae, are removed from the dataset with Region 1 conforming most closely to the “typi-cal” pattern (Fig. 5b). When the size distribution of individ-uals within the Fabaceae is plotted each region appears to have its own singular distribution (Fig. 5c).
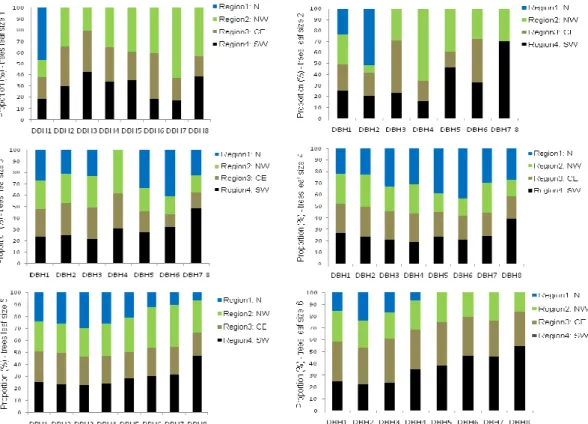
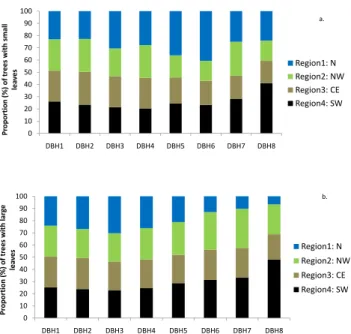
We also looked at the relative proportion of individual trees in each leaf size category in relation to regions and DBH classes (Fig. 6). The distribution of trees in leaf size Categories 1 and 2 is in concordance with the distribution of Fabaceae across the regions and DBH size classes. Rel-ative proportions of trees in leaf size Categories 3 and 4 are relatively even among our regions, although it is possible to detect a slight increase in relative proportion for Region 4 for trees in the higher DBH ranks (Fig. 6). The relative propor-tions of trees in leaf size classes 5 and 6 are very consistent in smaller DBH categories but show a trend of increasing re-gional separation in the higher DBH categories (Fig. 6). Re-gional analysis of small (classes 1 to 4 combined) and large leaves (classes 5 to 7 combined) reveals a singular pattern in Region 4 (Southwest Amazonia), which is distinguished by a higher proportion of large DBH trees that possess either smaller leaves or larger leaves (Fig. 7). Region 1 shows a trend of a relatively lower proportion of large leaved trees in larger DBH categories (Fig. 7).
3.3 Leaf size and tree characteristics
Species with small leaves show significantly lower “pio-neer” scores than species with large leaves (x2=10.215, df =1,
p=0.001). A more detailed analysis using leaf categories one to six also shows a significant difference in identified growth strategy among the classes (x2=18.332, df =5, p=0.003). Further analysis reveals that the significance is being pri-marily driven by the growth strategy of species with large leaves (Category 6)3, which are characterized by almost 40% higher mean scores than species with smaller leaf sizes (Cat-egories 3, 4 and 5).
Species with large leaves (Categories 5 to 7) have lower wood density (approximately 10% less) when compared with
species with small leaves (Categories 1 to 4) (x2=23.885,
df =1,p<0.001; mean wood density large leaves: 0.62; small leaves: 0.68). Individual trees with small leaves tend to have larger diameters (DBH), while larger leaves present smaller diameters although, interestingly, it is also possible to find individual trees with large DBH possessing large leaves.
3Species in the largest leaf size category (7) were not significant
in this test, possibly because they account for a very small
propor-0 0.1 0.2 0.3 0.4 0.5 0.6 0.7
leptophyll nanophyll microphyll notophyll mesophyll macrophyll megaphyll
F re q u e n ci e s ( a ll t re e s)
Region 1: N Region 2: NW Region 3: CE Region 4: SW
a. 0.3 0.4 0.5 0.6 0.7 F re q u e n ci e s ( n o F a b a ce a e )
Region 1: N Region 2: NW Region 3: CE Region 4: SW
b.
0 0.1 0.2
leptophyll nanophyll microphyll notophyll mesophyll macrophyll megaphyll
F re q u e n ci e s 0 0.1 0.2 0.3 0.4 0.5 0.6 0.7
leptophyll nanophyll microphyll notophyll mesophyll macrophyll megaphyll
F re q u e n ci e s (o n ly F a b a ce a e )
Region 1: N Region 2: NW Region 3: CE Region 4: SW
c.
Figure 5
Fig. 5. The mean frequency (0 to 1) of different leaf size cate-gories across the four Amazonian regions (Region 1, north; Re-gion 2, northwest; ReRe-gion 3, central and east; ReRe-gion 4, Southwest Amazonia). Figure (a) represents all individual trees; figure (b) il-lustrates all individual trees with the exception of members of the
Fabaceae; figure (c) shows only trees from the Fabaceae taxa.
3.4 Environmental correlates of leaf size
The proportion of species per site with large leaves was sig-nificantly correlated with three precipitation metrics used in the study: length of the dry season (months<100 mm rain-fall), maximum water deficit, and a metric of the variation in water availability based on the standard deviation of to-tal rainfall (full results given in Table 3). However, no sig-nificant relationships were seen at the individual level or for species or individuals when the leaf size metric was the proportion of trees per plot with “very-large” leaves (Cate-gories 6 and 7).
Fig. 6. Relative abundance (percentage) of trees in each diameter (DBH) class for each individual leaf size category. The relative abundance is calculated following two steps: firstly, relative abundance within the region; secondly, relative abundance among regions to allow compar-ison. DBH1=100–190 mm; DBH2=>190–280 mm; DBH3=>280–370 mm; DBH4=>370–460 mm; DBH5=>460–550 mm; DBH6=>550– 640 mm; DBH7=>640–730 mm; DBH8=>730 mm. The regions are: Region 1, North Amazonia; Region 2, Northwest Amazonia; Region 3, Central and East Amazonia; Region 4, Southwest Amazonia.
and with only Fabaceae trees included - also resulted in a small number of significant correlations (Table 3). When the Fabaceae were removed, the proportion of trees with large leaves and “very-large” leaves did not correlate with any variables. However, when the Fabaceae were analysed separately significant correlations were found between the proportion of trees with large leaves and length of the dry season. The proportion of Fabaceae individuals with “very-large” leaves only correlated with the coefficient of variation (SD) of rainfall (Table 3).
The relationship between soil fertility and leaf size was complex and revealed no strong patterns or consistent asso-ciations. From the global dataset (individual and clustered leaf categories of proportion of individual trees and species) only one correlation was significant – between the proportion of individual trees with in the smallest leaf size category and soil fertility (Table 4). No correlations were found when we removed the Fabaceae, while only Categories 6 and “very-large” leaves were correlated within the Fabaceae trees sub-set (Table 4). We also explored total phosphorus availability (as an additional measure of soil fertility) and, once again, no correlations were found.
Analyses within Region 2 did not reveal any significant correlation with soil fertility and leaf size, while analyses
within Region 3 (Central-East Amazonia) produced only one significant (positive) correlation between individual trees and leaf size Category 1. An interesting contrast is found in Re-gion 4 (Southwest Amazonia) with 18 significant results sup-porting an inverse correlation between the proportions of in-dividual trees with large leaves and soil fertility (Table 4) – the opposite trend to that observed by previous authors (Wright et al., 2007).
4 Discussion
Figure 7 0 10 20 30 40 50 60 70 80 90 100
DBH1 DBH2 DBH3 DBH4 DBH5 DBH6 DBH7 DBH8
Pr o p o rt io n ( % ) o f tr e e s wi th s m a ll le a v e
s Region1: N
Region2: NW Region3: CE Region4: SW a. 0 10 20 30 40 50 60 70 80 90 100
DBH1 DBH2 DBH3 DBH4 DBH5 DBH6 DBH7 DBH8
Pr o p o rt io n ( % ) o f tr e e s wi th l a rg e le a v e
s Region1: N
Region2: NW
Region3: CE
Region4: SW b.
Fig. 7. Relative abundance of trees in each diameter (DBH) class for clustered (small and large) leaf size category. The relative abun-dance is calculated following two steps: firstly, relative abunabun-dance within the region; secondly, relative abundance among regions to allow comparison. DBH1=100–190 mm; DBH2=>190–280 mm; DBH3=>280–370 mm; DBH4=>370–460 mm; DBH5=>460– 550 mm; DBH6=>550–640 mm; DBH7=>640–730 mm; DBH8=>730 mm. The regions are: Region 1, North Amazo-nia; Region 2, Northwest AmazoAmazo-nia; Region 3, Central and East Amazonia; Region 4, Southwest Amazonia. (a) Trees with small leaves (size Categories 1 to 4). (b) Trees with large leaves (size Categories 5 and 6).
proposes that trees in this category normally constitute ap-proximately three-quarters of all species in lowland tropical rainforests across the globe. The current pan-Amazon study supports these findings, with 73.6% of species identified be-longing to this size category. This result also supports the ob-servation that the mesophyll category dominates in Neotrop-ical rainforests (Grubb et al., 1963; Thompson et al., 1992; Kelly et al., 1994). Another characteristic feature of trop-ical rainforests is to have a small proportion of (non-palm) species with very large leaves. Once again this was further supported by this study in that we observed 0.01% of species with leaves in the megaphyll size category.
4.1 Spatial trends and environmental correlates in leaf size
Our study demonstrates complex patterns of variation in leaf size characteristics across the Amazon rainforest. At the crudest level of analysis there is a trend towards greater pro-portions of individuals and species in large leaf size cate-gories in the western plots. The relatively lower proportion of trees with large leaves in the Guiana Shield may be due to the unusual ecology of the area (see ter Steege et al., 2006)
re-sulting in a high proportion of Fabaceae, many of which are characterized by the possession of small leaves (or leaflets).
These spatial trends in leaf size can be interpreted in re-lation to previous macrogeographic studies in the Amazon. Most significantly, ter Steege et al. (2006) recently used in-ventory data to identify two major gradients in tree com-position and function across Amazonia. The first gradient stretches from the Guiana Shield to Southwestern Amazonia and is primarily characterized by changes in the abundance of several common species of legumes in the Guyanas. This ob-served gradient in tree composition is paralleled by declines in functional traits such as wood density and seed mass. The main ecological driver of this gradient is hypothesized to be the increasingly poor soils as one approaches the northeast-ern corner of Amazonia. The second gradient stretches from Colombia to Southeastern Amazonia and is characterized by the increasing presence of more drought-adapted species in the forests on the southeastern edge of Amazonia, which is postulated to be driven by a parallel gradient of dry season length (ter Steege et al., 2006).
In the present study the relative predominance of larger-leaved species in West and Southwest Amazonia closely aligns with the scores for the second axis of ter Steege’s DCA analysis of genus level community composition (ter Steege et al., 2006) and indicates a possible influence of length of the dry season on leaf size. This interpretation is further supported, although weakly, by the spatially-corrected OLS regressions, which identified three metrics of water avail-ability (see Materials and Methods) as being significantly associated with the proportion of tree species with large leaves. However, the data do not generate a clear signal when the Fabaceae are excluded from the dataset, or when the Fabaceae are analysed independently. It is worth noting that ter Steege et al. (2006) did not correct for spatial autocor-relation, and it is not clear if the pattern would be the same if it had been accounted for.
In summary, the data presented here do not provide any clear support for the hypothesis that leaf size in rainforests is positively correlated with annual rainfall. This may be due to the geographic scale of the study. However, the results do broadly support the work of Dolph and Dilcher (1980), who reported distinct leaf size proportions in different tropi-cal forest life zones (dry forests, wet forests, montane forests) rather than a positive environment gradient that correlates leaf size and climate, reflecting an increase in temperature and/or precipitation and increase in the proportion of leaf size (Dolph and Dilcher, 1980).
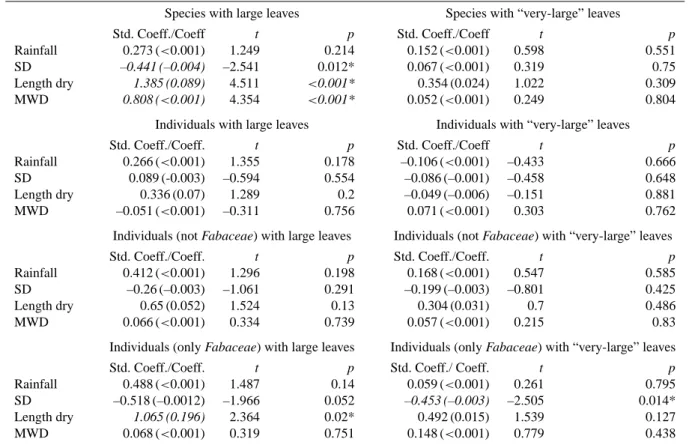
Table 3. OLS regression analysis of large leaves of species and individual trees (and variation of sub-datasets: only Fabaceae trees, Fabaceae trees removed) in relation to climatic variables controlled for spatial autocorrelation. Spatial structure was accounted for in all regressions by adding eigenvector filters produced with the PCNM. Filters were omitted and only plots with measurements for all variables were used in the regressions. SD=standard deviation of annual rainfall (see Material and Methods) MWD=maximum water deficit.
Species with large leaves Species with “very-large” leaves
Std. Coeff./Coeff t p Std. Coeff./Coeff t p
Rainfall 0.273 (<0.001) 1.249 0.214 0.152 (<0.001) 0.598 0.551
SD –0.441 (–0.004) –2.541 0.012* 0.067 (<0.001) 0.319 0.75
Length dry 1.385 (0.089) 4.511 <0.001* 0.354 (0.024) 1.022 0.309
MWD 0.808 (<0.001) 4.354 <0.001* 0.052 (<0.001) 0.249 0.804
Individuals with large leaves Individuals with “very-large” leaves
Std. Coeff./Coeff. t p Std. Coeff./Coeff t p
Rainfall 0.266 (<0.001) 1.355 0.178 –0.106 (<0.001) –0.433 0.666
SD 0.089 (-0.003) –0.594 0.554 –0.086 (–0.001) –0.458 0.648
Length dry 0.336 (0.07) 1.289 0.2 –0.049 (–0.006) –0.151 0.881
MWD –0.051 (<0.001) –0.311 0.756 0.071 (<0.001) 0.303 0.762
Individuals (not Fabaceae) with large leaves Individuals (not Fabaceae) with “very-large” leaves
Std. Coeff./Coeff. t p Std. Coeff./Coeff. t p
Rainfall 0.412 (<0.001) 1.296 0.198 0.168 (<0.001) 0.547 0.585
SD –0.26 (–0.003) –1.061 0.291 –0.199 (–0.003) –0.801 0.425
Length dry 0.65 (0.052) 1.524 0.13 0.304 (0.031) 0.7 0.486
MWD 0.066 (<0.001) 0.334 0.739 0.057 (<0.001) 0.215 0.83
Individuals (only Fabaceae) with large leaves Individuals (only Fabaceae) with “very-large” leaves
Std. Coeff./Coeff. t p Std. Coeff./ Coeff. t p
Rainfall 0.488 (<0.001) 1.487 0.14 0.059 (<0.001) 0.261 0.795
SD –0.518 (–0.0012) –1.966 0.052 –0.453 (–0.003) –2.505 0.014*
Length dry 1.065 (0.196) 2.364 0.02* 0.492 (0.015) 1.539 0.127
MWD 0.068 (<0.001) 0.319 0.751 0.148 (<0.001) 0.779 0.438
order of magnitude of total soilP (range 22–2063µg g−1) and used continuous measurements of leaf dimensions rather than size categories (McDonald et al., 2003). This illustrates one of the limitations of the present study and methodology, and demonstrates the critical need in macrogeographic stud-ies for establishing the appropriate scale of analysis in order to uncover genuine ecological patterns.
4.2 Leaf size and tree characteristics
The postulated functional association between water avail-ability and leaf size may also underlie the observed nega-tive relationship between leaf size and wood density. Wright et al. (2007) argue that trees with lower wood density have larger-diameter stem vessels and can therefore transport more water and have a greater total leaf area per stem. As interspecific variation in leaf area per stem is driven more by leaf size than number of leaves (e.g. Ackerly, 2004), all other things being equal, species with low density wood tend to have larger leaves. Wood density might therefore contribute to the observed relationship between the water availability metrics and leaf size if the enhanced water transport abilities
of large-leaved, low wood density species is a disadvantage in sites with lower water availability.
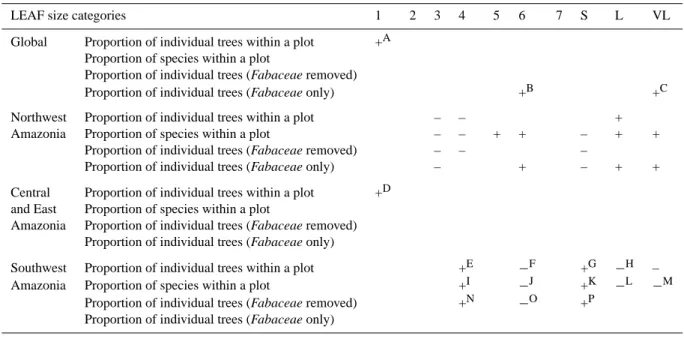
Table 4. Correlation analyses of leaf size categories and soil fertility (sum of bases). Blank cells represent no correlation. “-” and “+” indicate the direction of the correlation. A capitalized letter represents a significant spatially corrected correlation (details below table). S, L, VL=merged categories: small leaves, large leaves, and “very-large” leaves.
LEAF size categories 1 2 3 4 5 6 7 S L VL
Global Proportion of individual trees within a plot +A Proportion of species within a plot
Proportion of individual trees (Fabaceae removed)
Proportion of individual trees (Fabaceae only) +B +C
Northwest Proportion of individual trees within a plot – – +
Amazonia Proportion of species within a plot – – + + – + +
Proportion of individual trees (Fabaceae removed) – – –
Proportion of individual trees (Fabaceae only) – + – + +
Central Proportion of individual trees within a plot +D and East Proportion of species within a plot
Amazonia Proportion of individual trees (Fabaceae removed) Proportion of individual trees (Fabaceae only)
Southwest Proportion of individual trees within a plot +E −F +G −H –
Amazonia Proportion of species within a plot +I −J +K −L −M
Proportion of individual trees (Fabaceae removed) +N −O +P Proportion of individual trees (Fabaceae only)
Correlation results (n, Pearson’sFcorrected,dfcorrected,pcorrected). A)n=51, Pearson’sFcorrected=4.953, DFcorrected=43.9,pcorrected=0.031;
B and C) 51, 0.468, 14.018, 28, 0.008; D) 15, 0.599, 7.137, 12.765, 0.019; E) 16, 0.579, 5.818, 11, 0.034; F) 16,−0.503, 5.094, 16, 0.031; G) 16, 0.585, 6.944, 13, 0.02; H) 16,−0.585, 6.944, 13, 0.02; I) 16, 0.307, 9.153, 87, 0.003; J) 16,−0.493, 5.391, 16, 0.03; K) 16, 0.379, 7.081, 42, 0.011; L) 16,−0.379, 7.081, 42, 0.011; M) 16,−0.516, 4.989, 13.7, 0.043; N) 16, 0.482, 7.62, 25.22, 0.011; O) 16,−0.544, 4.991, 11.878, 0.045; P) 16, 0.471, 5.66, 19.85, 0.027.
comparative work is clearly desirable in order to better un-derstand the complex trade-offs and selective pressures on these two traits.
5 Conclusions
This study set out to address three key hypotheses. First, that small leaves are an adaptation to relatively dry conditions and will show a macrogeographic pattern that reflects this. The regional distribution of leaf size categories is broadly con-sistent with this hypothesis, although the spatially corrected regressions failed to provide strong evidence for quantita-tive relationships between leaf size and precipitation metrics. Second, that small leaves are favoured on oligotrophic soils. No evidence was found in support of this hypothesis, possi-bly because of the numerous trade-offs with other ecological and physiological factors, or the limitations of the data used in the analysis. Finally, that there is a negative relationship between leaf size and wood density. Like many other studies we found strong support in favour of this hypothesis, sug-gesting that this relationship is one of the fundamental con-straints on leaf size evolution.
Although the regional trends in leaf size described here fit well with our current understanding of the macroecology of
Acknowledgements. We thank I. K¨uhn for advice about spatial
analyses; M. Ladle for comments and copy-editing; and the whole RAINFOR network. C. Vriesendorp, F. Borchsenius, B. M. Thiers, and L. Willemse have provided herbaria data. A. Malhado’s PhD was funded by Oxford University’s Clarendon scholarship and Overseas Research Scheme award. We thank J. Lloyd and one anonymous referee for useful and challenging comments.
Edited by: J. Lloyd
References
Ackerly, D. D.: Canopy structure and dynamics: integration of growth processes in tropical pioneer trees, in: Tropical Forest Plant Ecophysiology, Chapman & Hall, NY, US, 619–658, 1996. Ackerly, D. D. and Donoghue, M. J.: Leaf size, sapling allometry, and Corner’s rules: phylogeny and correlated evolution in maples (Acer), Am. Nat., 152, 767–791, 1998.
Ackerly, D. D. and Reich, P. B.: Convergence and correlations among leaf size and function in seed plants: a comparative test using independent contrasts, Am. J. Bot. 9, 1272–1281, 1999. Ackerly, D. D.: Functional strategies of chaparral shrubs in relation
to seasonal water deficit and disturbance, Ecol. Monogr., 74, 25– 44, 2004.
Arag˜ao, L. E. O. C., Malhi, Y., Roman-Cuesta, R. M., Saatchi, S., Anderson, L. O., and Shimabukuro, Y. E.: Spatial patterns and fire response of recent Amazonian droughts, Geophys. Res. Lett., 34, L07701, doi:10.1029/2006GL028946, 2007.
Baker, T. R., Phillips, O. L., Malhi, Y., Almeida, S., Arroyo, L., Di Fiore, A., Erwin, T., Killeen, T., Laurance, S. G., Laurance, W. F., Lewis, S. L., Lloyd, J., Monteagudo, A., Neill, D. A., Pati˜no, S., Pitman, N. C., Silva, J. N. M., and V´asquez-Mart´ınez, R.: Variation in wood density determines spatial patterns in Amazo-nian forest biomass, Glob. Change Biol., 10, 1–18, 2004. Baker, T. R. and Lopez-Gonzalez, G.: Wood density, in:
RAIN-FOR: Functional Traits Database: Date of extraction: August 2006.
Barajas-Morales, J.: Wood specific gravity in species from two trop-ical forests in Mexico, IAWA Journal, 8, 143–148, 1987. Cain, S. A., Oliveira Castro, G. M., Pires, J. M., and da Silva, N. T.:
Application of some phytosociological techniques to Brazilian rain forest, Am. J. Bot., 43, 911–941, 1956.
Chave, J., Muller-Landau, H. C., Baker, T. R., Easdale, T. A., ter Steege, H., and Webb, C. O.: Regional and phylogenetic varia-tion in wood density among 2456 Neotropical tree species, Ecol. Appl., 16, 2356–2367, 2006.
Cornelissen, J. H. C.: A triangular relationship between leaf size and seed size among woody species: allometry, ontogeny, ecol-ogy and taxonomy, Oecologia, 118, 248–255, 1999.
Dawkins, R.: The Extended Phenotype, Oxford University Press, Oxford, 1982.
Dolph, G. E. and Dilcher, D. L.: Variation in leaf size with respect to climate in the tropics of the Western Hemisphere, B. Torrey Bot. Club., 107, 154–162, 1980.
Dutilleul, P.: Modifying the t-test for assessing the correlation be-tween 2 spatial processes, Biometrics, 49, 305–314, 1993. Falster, D. S. and Westoby, M.: Leaf size and angle vary widely
across species: what consequences for light interception?, New. Phytol., 158, 509–525, 2003.
Gillison, A. N. and Carpenter, G.: A generic plant functional at-tribute set and grammar for dynamic vegetation description and analysis, Funct. Ecol., 11, 775–783, 1997.
Givnish, T. J.: On the adaptive significance of compound leaves, with particular reference to tropical trees, in: Tropical Trees as Living Systems, Cambridge University Press, New York, US, 351–380, 1978.
Givnish, T. J.: On the adaptive significance of leaf form, in: Topics in Plant Population Biology, Columbia University Press, New York, USA, 375–407, 1979.
Givnish, T. J.: Leaf and canopy adaptations in tropical forests, in: Physiological Ecology of Plants in the Wet Tropics, Junk, The Hague, Netherlands, 51–58, 1984.
Givnish, T. J.: Comparative studies of leaf form – assessing the relative roles of selective pressures and phylogenetic constraints, New Phytol., 106, 131–160, 1987.
Givnish, T. J. and Vermeij, G. J.: Sizes and shapes of liana leaves, Am. Nat. 110, 743–778, 1976.
Grubb, P. J., Lloyd, J. R., Pennington, T. D., and Whitmore, T. C.: A comparison of montane and lowland rain forest in Ecuador I. The forest structure, physiognomy, and floristics, J. Ecol., 51, 567–601, 1963.
Huffman, G. J. and Bolvin, D. T.: TRMM and Other Data Precip-itation Data Set Documentation. Laboratory for Atmospheres, NASA Goddard Space Flight Center and Science Systems and Applications, Inc. 2007.
Kelly, D. L., Tanner, E. V. J., Nic Lughadha, E. M., and Kapos, V.: Floristics and biogeography of a rain forest in the Venezuelan Andes, J. Biogeogr., 21, 421–440, 1994.
Legendre, P.: Spatial autocorrelation: trouble or new paradigm?, Ecology, 74, 1659–1673, 1993.
Lloyd, J. and Farquhar, G. D.: Effects of rising temperatures and [CO2] on the physiology of tropical forest trees, Philos. T. Roy.
Soc. B, 363, 1811–1817, 2008.
Malhado, A. C. M., Whittaker, R. J., Malhi, Y., Ladle, R. J., ter Steege, H., Butt, N., Arag˜ao, L. E. O. C., Quesada, C. A., Murakami-Araujo, A., Phillips, O. L., Peacock, J., L´opez-Gonz´alez, G., Baker, T. R., Anderson, L. O., Arroyo, L., Almeida, S., Higuchi, N., Killeen, T. J., Monteagudo, A., Neill, D. A., Pitman, N. C. A., Prieto, A., Salom˜ao, R. P., V´asquez-M., R., Laurance, W. F., and Ram´ırez A., H.: Spatial distribution and functional significance of leaf lamina shape in Amazonian forest trees, Biogeosciences, 6, 1577–1590, 2009,
http://www.biogeosciences.net/6/1577/2009/.
Malhi, Y., Baker, T. R., Phillips, O. L., Almeida, S, Alvarez, E., Arroyo, L., Chave, J., Czimczik, C. I., Di Fiore, A., Higuchi, N., Killeen, T. J., Laurance, S. G., Laurance, W. F., Lewis, S. L., Mercado, L. M., Monteagudo, A., Neill, D. A., N´u˜nez Vargas, P., Pati˜no, S., Pitman, N. C. A., Quesada, C. A., Silva, N., Torres Lezama, A., V´asquez-Mart´ınez, R., Terborgh, J., Vinceti, B., and Lloyd, J.: The above-ground coarse woody productivity of 104 Neotropical forest plots, Glob. Change Biol., 10, 563–591, 2004. McDonald, P. G. M., Fonseca, C. R., Overtons, J., and Westoby, M.: Leaf-size divergence along rainfall and soil-nutrient gradients: is the method of size reduction common among clades?, Funct. Ecol., 17, 50–57, 2003.
large leaves, and do shorter expansion times reduce herbivore damage?, Oikos, 90, 517–524, 2000.
Parkhurst, F. and Loucks, L.: Optimal leaf size in relation to envi-ronment, J. Ecol., 60, 505–537, 1972.
Peacock, J., Baker, T. R., Lewis, S. L., Lopez-Gonzalez, G., and Phillips, O. L.: The RAINFOR database: monitoring forest biomass and dynamics, J. Veg. Sci., 18, 535–542, 2007. Phillips, O. L., Arag˜ao, L. E., Lewis, S. L., Fisher, J. B., Lloyd, J.
L., L´opez-Gonz´alez, G., Malhi, Y., Monteagudo, A., Peacock, J., Quesada, C. S., van der Heijden, G. M., Almeida, S., Ama-ral, I., Arroyo, L., Aymard, G., Baker, T. R., B´anki, O., Blanc, L., Bonal, D., Brando, P., Chave, J., Alves de Oliveira, A. C., D´avila Cardozo, N., Czimczik, C. I., Feldpausch, T. R., Freitas, M. A., Gloor, E. U., Higuchi, N., Jim´enez, E., Lloyd, G., Meir, P., Mendoza, C., Morel, A., Neill, D. A., Nepstad, D, Pati˜no, A., Pe˜nuela, M. C., Prieto, A., Ram´ırez, F., Schwarz, M., Silva, J. E., Silveira, M., Sota Thomas, A., ter Steege, H., Stropp, J., V´asquez, R., Zelazowski, P., Alvarez D´avila, E., Andelman S., Andrade, A., Chao, K. J., Erwin, T., Di Fiore, A., Honorio, E., Keeling H. C., Killeen, T. J., Laurance, W. F., Pe˜na Cruz, A., Pit-man, N. C. A., N´u˜nez Vargas, P., Ram´ırez-Angulo, H., Rudas, A., Salam˜ao, R., Silva, N., Terborgh, J., and Torres-Lezama, A.: Drought sensitivity of the Amazon rainforest, Science, 323, 1344–1347, 2009.
Phillips, O., Baker T. R., Arroyo, L., Higuchi, N., Killeen, T., Lau-rance, W. F., Lewis, S. L., Lloyd, J., Malhi, Y., Monteagudo, A., Neill, D., N´u˜nez Vargas, P., Silva, N., Terborgh, J., V´asquez-Mart´ınez, R., Alexiades, M., Almeida, S., Brown, S., Chave, J., Comiskey, J. A., Czimczik, C. I., Di Fiore, A., Erwin, T., Kue-bler, C., Laurance, S. G., Nascimento, H. E. M., Palacios, W., Pati˜no, S., Pitman, N., Olivier, J., Quesada, C. A., Saldias, M., Torres Lezama, A., and Vinceti, B.: Pattern and process in Ama-zon tree turnover, 1976–2001, Philos. T. Roy. Soc. B, 363, 381– 407, 2004.
Pleysier, J. L. and Juo, A. S. R.: A single-extraction method us-ing silver-thiourea for measurus-ing exchangeable cations and effec-tive CEC in soils with variable charges, Soil Sci., 129, 205–211, 1980.
Quesada, C. A., Lloyd, J., Schwarz, M., Pati˜o, S., Baker, T. R., Cz-imczik, C., Fyllas, N. M., Martinelli, L., Nardoto, G. B., Schmer-ler, J., Santos, A. J. B., Hodnett, M. G., Herrera, R., Luiz˜o, F. J., Arneth, A., Lloyd, G., Dezzeo, N., Hilke, I., Kuhlmann, I., Raessler, M., Brand, W. A., Geilmann, H., Moraes Filho, J. O., Carvalho, F. P., Araujo Filho, R. N., Chaves, J. E., Cruz Junior, O. F., Pimentel, T. P., and Paiva, R.: Chemical and physical prop-erties of Amazon forest soils in relation to their genesis, Biogeo-sciences Discuss., 6, 3923–3992, 2009,
http://www.biogeosciences-discuss.net/6/3923/2009/.
Rangel, T. F. L. V. B., Diniz-Filho, J. A. F., and Bini, L. M.: Towards an integrated computational tool for spatial analysis in macroe-cology and biogeography, Global Ecol. Biogeogr., 15, 321–327, 2006.
Raunkiaer, C.: The Life Forms of Plants and Statistical Plant Geog-raphy, Oxford University Press, Oxford, 632 pp., 1934. Richards, P. W.: The Tropical Rain Forest: an Ecological Study,
Cambridge University Press, Cambridge, 1952.
ter Steege, H. and Hammond, D. S.: Character convergence, diver-sity, and disturbance in tropical rain forest in Guyana, Ecology, 82, 3197–3212, 2001.
ter Steege, H., Pitman, N., Sabatier, D., Castellanos, H., Van der Hout, P., Daly, D. C., Silveira, M., Phillips, O., V´asquez-Mart´ınez, R, Van Andel, T., Duivenvoorden, J., de Oliveira, A. A., Ek, R., Lilwah, R., Thomas, R., Van Essen, J., Baider, C., Maas, P., Mori, S., Terborgh, J., Vargas, P. N., Mogoll´on, H., and Morawetz, W.: A spatial model of tree alpha-diversity and tree density for the Amazon, Biodivers. Conserv., 12, 2255–2277, 2003.
ter Steege, H., Pitman, N. C. A., Phillips, O. L., Chave, J., Sabatier, D., Duque, A., Molino, J. F., Pr´evost, M. F., Spichiger, R., Castellanos, H., von Hildebrand, P., and V´asquez-Mart´ınez, R.: Continental-scale patterns of canopy tree composition and func-tion across Amazonia, Nature, 443, 444–447, 2006.
Thompson, J., Proctor, J., Viana, V., Milliken, W., Ratter, J. A., and Scott, D. A.: Ecological studies on a lowland evergreen rain for-est on Maraca Island, Roraima, Brazil. I. Physical environment, forest structure and leaf chemistry, J. Ecol., 80, 689–703, 1992. Turner, I. M.: The Ecology of Trees in the Tropical Rainforest,
Cambridge University Press, Cambridge, 2001.
V´asquez-Mart´ınez, R.: Fl´orula de las Reservas Biol´ogicas de Iqui-tos, Per´u, St Louis: Missouri Botanical Garden Press, 1997. Webb, L. J.: A physiognomic classification of Australian rain
forests, J. Ecol., 47, 551–570, 1959.
Westoby, M., Falster, D. S., Moles, A. T., Vesk, P. A., and Wright, I. J.: Plant ecological strategies: some leading dimensions of variation between species, Annu. Rev. Ecol. Syst., 33, 125–159, 2002.
Wiemann, M. C. and Williamson, G. B.: Geographic variation in wood specific gravity: effects of latitude, temperature, and pre-cipitation, Wood Fiber Sci., 34, 96–107, 2002.