METHOD FOR THE SIMULTANEOUS DETERMINATION
OF CODEINE PHOSPHATE AND TRIPROLIDINE
HYDROCHLORIDE IN COUGH SYRUP FORMULATION
Dissertation
Submitted to
THE TAMILNADU DR. M. G. R. MEDICAL UNIVERSITY,
CHENNAI
In Partial Fulfillment of the Requirements
For the Award of Degree of
MASTER OF PHARMACY
IN
PHARMACEUTICAL ANALYSIS
DEPARTMENT OF PHARMACEUTICAL ANALYSIS
K. M. COLLEGE OF PHARMACY,
UTHANGUDI, MELUR MAIN ROAD,
MADURAI - 625 107, TAMIL NADU.
This is to certify that the dissertation entitled "DEVELOPMENT AND VALIDATION OF NEW RP-HPLC METHOD FOR THE SIMULTANEOUS DETERMINATION OF CODEINE PHOSPHATE AND TRIPROLIDINE HYDROCHLORIDE IN COUGH SYRUP FORMULATION" Submitted by Ms. K. SUGANYA (Reg. No. 261630051) in partial fulfillment of the requirements for the award of degree of Master of Pharmacy in Pharmaceutical Analysis under THE TAMILNADU Dr. M.G.R. MEDICAL UNIVERSITY, Chennai, done at K.M. COLLEGE OF PHARMACY, Uthangudi, Madurai. It is a bonafide work carried out by them under my guidance and direct supervision during the academic year of 2017 - 2018. This dissertation partially or fully has not been submitted for any other degree or diploma of this university or other universities.
GUIDE PRINCIPAL
Mr. D. Shankar, M. Pharm., DSM., (Ph.D.), Dr. M. Sundarapandian, M. Pharm., Ph.D., Associate Professor & Research Coordinator, Professor and HOD,
Dept. of Pharmaceutical Analysis, Dept. of Pharmaceutical Analysis, K.M. College of Pharmacy, K.M. College of Pharmacy,
Uthangudi, Madurai - 625 107. Uthangudi, Madurai - 625 107. Tamil Nadu. Tamil Nadu.
ACKNOWLEDGEMENT
Milestones in life are achieved, not by individual efforts but by blessings and guidance of elders, near and dear ones of collective wisdom and experience of all those who have shared their views for this dissertation is the product beyond those found within the covers of book. I therefore take this opportunity to express my acknowledgement to all of them.
First and foremost I express my deepest sense of gratitude and faithfulness to God’s grace which has enabled me to finish my dissertation work successfully. It’s a dream come true for me to present this book, which has turned into a reality due to the blessings and prayers of a whole lot of people whom I am really grateful to.
It is an honour to pay my heartfelt thanks to My Most Respected Founder Chairman Prof. M. Nagarajan, M. Pharm., M.B.A., DMS (IM)., DMS (BM)., K.M. College of Pharmacy, Uthangudi, Madurai, for providing necessary facilities to carry out this dissertation work successfully.
I also express my sincere thanks to Principal Dr. M. Sundarapandian, M. Pharm., Ph.D., Professor and HOD, Department of Pharmaceutical Analysis and
Vice Principal Dr. N. Chidambaranathan, M. Pharm., Ph.D., Professor and HOD, Department of Pharmacology, K.M. College of Pharmacy, Uthangudi, Madurai, for their timely instigation and immeasurable esteemed help to complete this dissertation.
I wish to place my deep regards to Mr. P. Sakthivel, B. Pharm., Factory Manager, Pharmafabrikon, Unit-II, Vilathur, Madurai, Tamil Nadu, for his permission to carry out my dissertation work in their industry.
My heartfelt thanks to Prof. M. S. Prakash, M. Pharm., Department of Pharmaceutical Analysis, K.M. College of Pharmacy, Uthangudi, Madurai, for his ideas and constant inspiration at every stage of my dissertation.
I am also grateful to Mrs. M. Shobana, B. Pharm., Quality Control Manager,
Mr. R. Balamurugan, M. Pharm., Quality Assurance Manager, Mr. J. Sivakumar,
M. Sc., Quality Control Chemist and Mr. S. Rajkumar, M. Sc., Quality Control
Chemist, Pharmafabrikon, Unit-II, Vilathur, Madurai, Tamil Nadu, for their excellent guidance throughout my dissertation work.
My special thanks to Teaching and Non teaching staffs of K.M. College of Pharmacy, Uthangudi, Madurai, for their wishes and encouragement during my course.
With deep sense of affection my express my endless gratitude to all
My Friends who helped me in need, Thank you friends for your valuable help
throughout my dissertation work.
I pay tribute to My Father and Mother for lifting me up till this phase of life. I thank them for their love, trust, patience, support and bearing all kinds of stress to make me what I am.
Finally, a word of thanks to all those gentle people associated with this work directly or indirectly whose names, I have been unable to mention here as they are like the countless stars in numerous galaxies.
DEDICATED
DEDICATED
DEDICATED
DEDICATED
TO
TO
TO
TO
MY BELOVED
MY BELOVED
MY BELOVED
MY BELOVED
PARENTS, GUIDE
PARENTS, GUIDE
PARENTS, GUIDE
PARENTS, GUIDE
& FRIENDS
& FRIENDS
& FRIENDS
LIST OF TABLES
Table No. Name of the Table Page No.
1 List of Instrumental Methods Vs Principle 3
2 Common HPLC Solvents and their Properties 16
3 Common HPLC Buffers and their Respective pKa
and UV Cut-off Wavelength
17
4 System Suitability Parameters and
Recommendations
34
5 List of Instruments Used 58
6 List of Chemicals Used 58
7 List of Active Pharmaceutical Ingredients Used 58
8 Results of Trial:3 - Optimized Method (Codeine
phosphate and Triprolidine hydrochloride)
65
9 Results of System Suitability (Codeine phosphate) 78
10 Results of System Suitability (Triprolidine
hydrochloride)
79
11 Results of Accuracy (50% Spike Solution) 80
12 Results of Accuracy (100% Spike Solution) 80
13 Results of Accuracy (150% Spike Solution) 81
14 Results of Accuracy (Overall Mean, SD, % RSD
for Codeine phosphate and Triprolidine
hydrochloride)
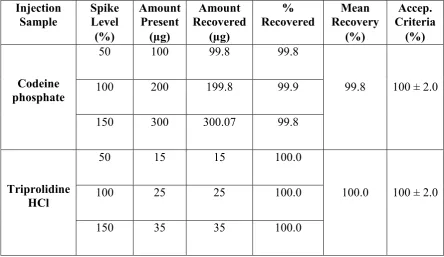
15 Results of % Recovery for Codeine phosphate and
Triprolidine hydrochloride
82
16 Results of System Precision (Standard) 83
17 Results of Method Precision (Sample - 1) 84
18 Results of Method Precision (Sample - 2) 84
19 Results of Method Precision (Sample - 3) 85
20 Results of Method Precision (Sample - 4) 86
21 Results of Method Precision (Sample - 5) 86
22 Results of Method Precision (Sample - 6) 87
23 Results of Method Precision (Overall Mean, SD,
% RSD for Codeine phosphate and Triprolidine
hydrochloride)
87
24 Results of Specificity (Standard - 1) 88
25 Results of Specificity (Standard - 2) 89
26 Results of Specificity (Standard - 3) 90
27 Results of Specificity (Standard - 4) 90
28 Results of Specificity (Standard - 5) 91
29 Results of Specificity (Standard - 6) 92
30 Results of Specificity (Overall Mean, SD, % RSD
for Codeine phosphate and Triprolidine
hydrochloride)
92
31 Results of Linearity - 1 (50 µg/ml) 93
32 Results of Linearity - 2 (75 µg/ml) 94
34 Results of Linearity - 4 (125 µg/ml) 95
35 Results of Linearity - 5 (150 µg/ml) 96
36 Results of Linearity Level 1 - 5 (50 to 150 µg/ml)
for Codeine phosphate
97
37 Results of Linearity Level 1 - 5 (50 to 150 µg/ml)
for Triprolidne hydrochloride
98
38 Results of Robustness - Standard Solution 1
(Flow Rate - 1.2 ml/min)
99
39 Results of Robustness - Standard Solution 2
(Flow Rate - 1.2 ml/min)
100
40 Results of Robustness - Standard Solution 3
(Flow Rate - 1.2 ml/min)
100
41 Results of Robustness - Standard Solution 4
(Flow Rate - 1.2 ml/min)
101
42 Results of Robustness - Standard Solution 5
(Flow Rate - 1.2 ml/min)
102
43 Results of Robustness - Standard Solution 1
(Flow Rate - 1.4 ml/min)
102
44 Results of Robustness - Standard Solution 2
(Flow Rate - 1.4 ml/min)
103
45 Results of Robustness - Standard Solution 3
(Flow Rate - 1.4 ml/min)
104
46 Results of Robustness - Standard Solution 4
(Flow Rate - 1.4 ml/min)
104
47 Results of Robustness - Standard Solution 5
(Flow Rate - 1.4 ml/min)
48 Results of Robustness - Standard Solution
(pH - 2.2)
106
49 Results of Robustness - Standard Solution
(pH - 2.4)
106
50 Results of Robustness - Flow Rate
Variation/Standard Solution 1 to 5 (Overall Mean,
SD, % RSD for Codeine phosphate and
Triprolidine hydrochloride)
107
51 Results of Ruggedness - Day 1 (Analyst - 1) for
Codeine phosphate and Triprolidine hydrochloride
108
52 Results of Ruggedness - Day 2 (Analyst - 2) for
Codeine phosphate and Triprolidine hydrochloride
109
53 Results of Ruggedness - Day 1 & 2 (Analyst - 1)
for Codeine phosphate and Triprolidine
hydrochloride
109
54 Results of Ruggedness - Day 1 & 2 (Analyst - 2)
for Codeine phosphate and Triprolidine
hydrochloride
110
LIST OF FIGURES
Figure No. Name of the Figure Page No.
1 Block Diagram of Analytical Instruments Showing the Stimulus and Measurements of Response
2
2 Classification of Chromatography 8
3 Preparative HPLC Apparatus 9
4 Normal Phase Chromatography 11
5 Reverse Phase Chromatography 11
6 Ion Exchange Chromatography 12
7 Size Exclusion Chromatography 12
8 Components of High Performance Liquid Chromatography
15
9 Reciprocating Pump 18
10 Injector 20
11 Chromatogram of Trial:1 (Codeine phosphate and Triprolidine hydrochloride)
62
12 Chromatogram of Trial:2 (Codeine phosphate and Triprolidine hydrochloride)
63
13 Chromatogram of Trial:3 - Optimized Method (Codeine phosphate and Triprolidine hydrochloride)
64
16 Chromatogram of Accuracy (100% Spike Solution) 80 17 Chromatogram of Accuracy (150% Spike Solution) 81
18 Chromatogram of Precision (Blank) 82
38 Chromatogram of Overlay of Linearity 1 - 5 (50 to 150 µg/ml)
96
39 Chromatogram of Linearity Level 1 - 5 (50 to 150 µg/ml) for Codeine phosphate
96
40 Chromatogram of Linearity Level 1 - 5 (50 to 150 µg/ml) for Triprolidne hydrochloride
97
41 Chromatogram of Robustness (Blank) 98 42 Chromatogram of Robustness - Standard Solution 1
(Flow Rate - 1.2 ml/min)
99
43 Chromatogram of Robustness - Standard Solution 2 (Flow Rate - 1.2 ml/min)
99
44 Chromatogram of Robustness - Standard Solution 3 (Flow Rate - 1.2 ml/min)
100
45 Chromatogram of Robustness - Standard Solution 4 (Flow Rate - 1.2 ml/min)
101
46 Chromatogram of Robustness - Standard Solution 5 (Flow Rate - 1.2 ml/min)
101
47 Chromatogram of Robustness - Standard Solution 1 (Flow Rate - 1.4 ml/min)
102
48 Chromatogram of Robustness - Standard Solution 2 (Flow Rate - 1.4 ml/min)
103
49 Chromatogram of Robustness - Standard Solution 3 (Flow Rate - 1.4 ml/min)
103
50 Chromatogram of Robustness - Standard Solution 4 (Flow Rate - 1.4 ml/min)
51 Chromatogram of Robustness - Standard Solution 5 (Flow Rate - 1.4 ml/min)
105
52 Chromatogram of Robustness - Standard Solution (pH - 2.2)
105
53 Chromatogram of Robustness - Standard Solution (pH - 2.4)
106
54 Chromatogram of Ruggedness (Blank) 108 55 Chromatogram of Ruggedness - Day 1 (Analyst - 1)
for Codeine phosphate and Triprolidine hydrochloride
108
56 Chromatogram of Ruggedness - Day 2 (Analyst - 2) for Codeine phosphate and Triprolidine hydrochloride
LIST OF ABBREVIATIONS
HPLC : High Performance Liquid Chromatography
LC : Liquid Chromatography
RP-HPLC : Reverse Phase High Performance Liquid Chromatography
UV : Ultra Violet
MS : Mass Spectrometry
NMR : Nuclear Magnetic Resonance
IR : Infra Red
ESR : Electron Spin Resonance
ELSD : Evaporative Light Scattering Detector
RSD : Relative Standard Deviation N : Number of Theoretical Plates
SD : Standard Deviation
NMT : Not More Then
NLT : Not Less Then
K’ : Capacity Factor
RS : Resolution
T : Tailing Factor
nm : Nanometer
mm : Millimeter
mg : Milligram
ml : Milliliter mM : Millimolar
µg : Microgram
µm : Micrometer
µ : Micron
ºC : Degree Centigrade
RP : Reverse Phase
pH : Hydrogen ion Concentration
PDA : Photo Diode Array
tRor RT : Retention Time
vR : Retention Volume
S. No. : Serial Number
v/v : Volume/Volume
% : Percentage
Sec : Second
Min : Minute
RH : Relative Humidity
RI : Refractive Index
CP : Codeine Phosphate
TH : Triprolidine Hydrochloride
e.g. : Example
USP : United States of Pharmacopoeia
FDA : Food Drug Administration
API : Active Pharmaceutical Ingredient
INDEX
Chapter No. Contents Page No.
List of Tables i
List of Figures v
List of Abbreviations ix
I Introduction 1
II Drug Profile 39
III Literature Review 44
IV Aims and Objectives 57
V Instruments and Chemicals 58
VI Method Development 59
VII Method Validation 66
VIII Results and Discussion 78
IX Summary and Conclusion 111
CHAPTER - I
INTRODUCTION
1.1 Pharmaceutical Analysis:
Pharmaceutical analysis is the branch of science which deals with identification
of substances and determination of amount present in particular sample. Also
pharmaceutical analysis deals with bulk materials, dosage forms and more
recently, biological samples in support of Bio-pharmaceutical and
Pharmacokinetic studies.
Analysis can be divided into areas called qualitative and quantitative analysis.
Pharmaceutical products synthesized and identified using Instrumental
Techniques.1 These methods are used extensively in the qualitative assurance of
raw materials, in process quality assessment, stability of the drugs on storage
monitoring drugs concentrations in various body fluids or tissues.
The types of analysis can be distinguished in two ways:
a. Qualitative Analysis:
To refer identity of product, i.e., it yields useful clue from which the molecular
or atomic species, the structural features or the functional groups in the sample can be
identified.
b. Quantitative Analysis:
To refer the purity of the product, i.e., the results are in the form of
numerical data corresponding to the concentration of analytes.
1.2 Types of Analytical Methods:
The various methods of analysis 2 can be grouped into two categories namely
a. Chemical Methods
b. Instrumental Methods
a. Chemical Methods:
In these methods, volume and mass are used as means of detection.
Titrimetrical methods like acid-base, oxidation-reduction,
non-aqueous, complexometric and precipitation titrations
Gravimetric and thermo gravimetric methods
Volumetric methods
b. Instrumental Methods:
These methods are based on the measurement of specific and non-specific
physical properties of substances. The Block diagram of analytical instruments 3 and
different instrumental methods based on principle are shown in Figure No. 1 and
Table No. 1 repectively.
Figure No. 1. Block Diagram of Analytical Instruments Showing
Table No. 1. List of Instrumental Methods Vs Principle
S. No. Principle Instrumental Methods
1 Emission of Radiation X-ray Emission Spectrometry
and Fluorescence Spectrometry
2 Absorption of Radiation UV/Visible Spectrophotometry,
NMR and IR Spectrometry,
ESR Spectroscopy and
Atomic Absorption Spectrometry
3 Mass to Charge Ratio Mass Spectrometry (MS)
4 Refraction of Radiation Refractometry
5 Scattering of Radiation Nephelometry
6 Rotation of Radiation Polarimetry
7 Electrical Potential Potentiometry
8 Electrical Current Amperometry and Polarography
9 Electrical Resistance Conductometry
10 Thermal Properties Differential Thermal Analysis,
Differential Scanning Calorimetry
and Thermogravimetry
1.3 Chromatography: 4
Chromatography (from Greek chroma, color and graphein to write) is the
collective term for a set of laboratory techniques for the separation of mixtures. It
involves passing a mixture dissolved in a “Mobile Phase” through a stationary
phase, which separates the analyte to be measured from other molecules in the
mixture based on differential partitioning between the mobile and stationary
phase. Subtle differences in a compound’s partition coefficient result in
differential retention on the stationary phase and thus changing the separation.
Chromatography may be preparative or analytical. The purpose of preparative
chromatography is to separate the component of a mixture for further use (and is
thus a form of purification). Analytical chromatography is done normally with
smaller amounts of material and is for measuring the relative proportions of
analytes in a mixture.
The two are not mutually exclusive. The history of chromatography begins during
the mid-19th century. Chromatography, literally “color writing”, was used and
named in the first decade of the 20th century, primarily for the separation of plant
pigments such as chlorophyll.
New type of chromatography developed during the 1930s And 1940s made the
technique useful for many types of separation process. Some related techniques
were developed during the 19th century (and even before), but the first true
chromatography.
1.3a Chromatographic Terms:
The analyte is the substance to be separated during chromatography.
Analytical chromatography is used to determine the existence and possibly
also the concentration of analyte (s) in a sample.
A bonded phase is a stationary phase that is covalently bonded to the support
particles or to the inside wall of the column tubing.
A chromatogram is the visual output of the chromatograph. In the case of an
optimal separation, different peaks or patterns on the chromatogram
correspond to different components of the separated mixture. Plotted on the
x-axis is the retention time and plotted on the y-axis a signal (for example
obtained by a spectrophotometer, mass spectrometer or a variety of other
detectors) corresponding to the response created by the analytics exiting the
system. In the case of an optimal system the signal is proportional to the
concentration of the specific analytes separated.
A chromatograh is equipment that enables a sophisticated separation e.g.gas
chromatographic or liquid chromatographic separation.
Chromatography is a physical method of separation in which the compounds
to be separated are distributed between two phases, one of which is stationary
(stationary phase) while the other (mobile phase) moves in a definite direction.
The eluent is the mobile phase leaving the column.
An eluotropic series is a list of solvents ranked according to their eluting
power.
An immobilized phase is stationary phase which immobilized support
The mobile phase is the phase that moves in a definite direction. It may be a
liquid (Liquid Chromatography, Capillary Electro Chromatography, Gas
Chromatography and Supercritical Fluid Chromatography). The mobile phase
consists of the sample being separated and the solvent that moves the sample
through the column. In the case of HPLC the normal phase or polar solvents in
reverse phase moves through the chromatography column where the sample
interacts with the stationary phase and is separated.
Preparative chromatography is used to purify sufficient quantities of a
substance for further use, rather than analysis.
Theretention timeis the characteristic time it takes for a particular analyte to
pass through the system (from the column inlet to the detector) under set
conditions.
The sample is the matter analyzed in chromatography. It may consist of a
single component or it may be a mixture of components.
The soluterefers to the sample components in partition chromatography.
Thesolvent refers to any substance capable of solubilizing another substance,
and especially the liquid mobile phase in liquid chromatograph.
The stationary phase is the substance fixed in place for the chromatography
procedure. Example includes the silica layer in thin layer chromatography.
The detector refers to the instrument used for qualitative and quantitative
detection of analytes after separation.
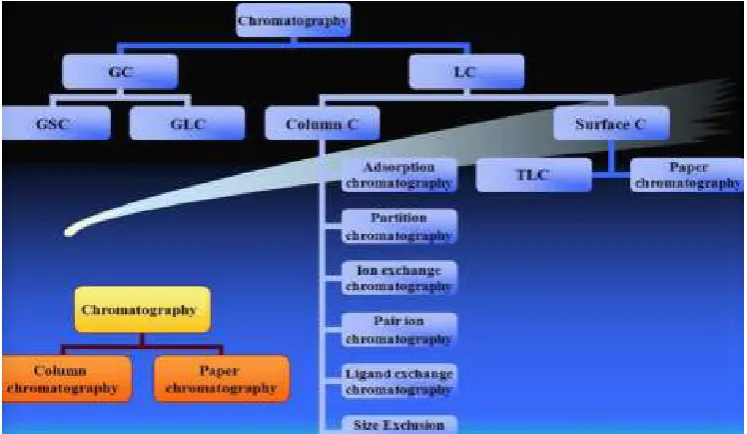
1.3bTypes of Chromatography:
Chromatography can be classified into many types are shown in Figure No. 2.
Based upon the nature of stationary and mobile phase:
Gas-Solid Chromatography
Gas-Liquid Chromatography
Solid-Liquid Chromatography
Liquid-Liquid Chromatography
Based on the principle of separation:
Adsorption Chromatography
e.g. Gas-Solid Chromatography, Thin Layer Chromatography, Column
Chromatography and High Performance Liquid Chromatography
(HPLC)
Partition Chromatography
e.g. Gas-Liquid Chromatography, Paper Chromatography,
Column Chromatography
Based on the modes of chromatography:
Normal Phase Chromatography
Reverse Phase Chromatography
Other types of chromatography:
Ion Exchange Chromatography
Gel Permeation Chromatography
Chiral Chromatography
Figure No. 2. Classification of Chromatography
1.4 High Performance Liquid Chromatography (HPLC):
Initially, pressure was selected as the principal criterion of modern liquid
chromatography and thus the name was "High Pressure Liquid Chromatography"
or HPLC. This was, however, an unfortunate term because it seems to indicate
that the improved performance is primarily due to the high pressure. This is,
however, not true. In fact, high performance is the result of many factors: Very
small particles of narrow distribution range and uniform pore size and
distribution, high pressure column slurry packing techniques, accurate low
volume sample injectors, and sensitive low volume detectors and, of course, good
pumping systems. Naturally, pressure is needed to permit a given flow rate of the
mobile phase.
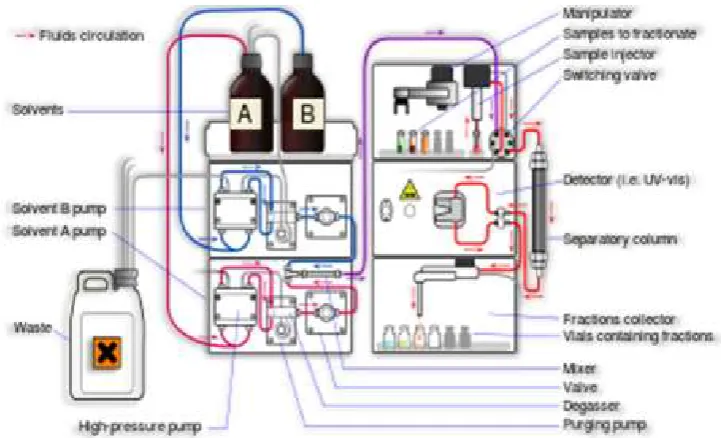
High Performance Liquid Chromatography (HPLC) is a versatile analytical
technology widely used for the analysis of pharmaceuticals, biomolecules,
polymers and many organic and ionic compounds. The preparative HPLC
Figure No. 3. Preparative HPLC Apparatus
1.4a Types of HPLC Techniques:
A) Based on Modes of Separation
Normal Phase Chromatography
Reversed Phase Chromatography
B) Based on Principle of Separation
Adsorption Chromatography
Ion Exchange Chromatography
Size Exclusion or Gel Permeation Chromatography
Affinity Chromatography
Chiral Phase Chromatography
C) Based on Elution Techniques
Isocratic Separation
D) Based on the Scale of Operation
Analytical HPLC
Preparative HPLC
E) Based on the Type of Analysis
Qualitative Analysis
Quantitative Analysis
A) Based on Modes of Separation:
There are two modes of chromatography viz-normal phase mode and reverse
phase mode. These modes are based on the polarity of stationary and mobile
phase. Before explaining the modes, it is important to know the interactions
which occur between solute, stationary and mobile phase.
Polar-Polar - Interaction or affinity is more
Nonpolar-Nonpolar - Interaction or affinity is more
Polar-Nonpolar - Interaction or affinity is less
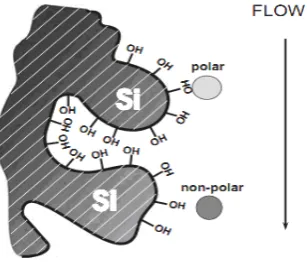
Normal Phase Chromatography:
In normal phase mode, the stationary phase is polar in nature and the
mobile phase is non polar (Figure No. 4). In this technique, non-polar
compounds travel faster and are eluted first. This is because of less affinity
between solute and stationary phase. Polar compounds are retained for longer
time in the column because of more affinity towards stationary phase and take
more time to be eluted from the column. This is not advantageous in
pharmaceutical applications since most of the drug molecules are polar in
Figure No. 4. Normal Phase Chromatography
Reverse Phase Chromatography:
In reverse phase mode, the stationary phase is non polar in nature and
the mobile phase is polar (Figure No. 5). Hence polar components get eluted
first and non-polar compounds are retained for a longer time. Since most of
the drugs are polar in nature, they are not retained for a longer time and eluted
faster, which is advantageous.
Figure No. 5. Reverse Phase Chromatography
B)Based on Principle of Separation:
Adsorption Chromatography:
The principle of separation is adsorption. Separation of components
takes place because of the difference in affinity of compounds towards
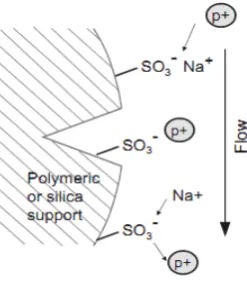
[image:27.595.248.386.475.616.2]Ion Exchange Chromatography:
The principle of separation is ion exchange, which is reversible
exchange of functional groups. In ion exchange resin is used to separate a
mixture of similar charged ions. Typical stationary phases are cationic
exchange (Sulfonate) or anionic exchange (quaternary ammonium) groups
bonded to polymeric or silica materials (Figure No. 6). Mobile phases consist
of buffers, often with increasing ionic strength, to force the migration of the
[image:28.595.261.385.322.468.2]analytes.
Figure No. 6. Ion Exchange Chromatography
Size Exclusion or Gel Permeation Chromatography:
In this type of chromatography, a mixture of components with different
molecular sizes is separated by using gels (Figure No. 7).
Affinity Chromatography:
This uses the affinity of the sample with specific stationary phases.
This technique is mostly used in the field of biotechnology, microbiology and
biochemistry.
Chiral Phase Chromatography:
This technique involves the separation of optical isomers can be done
by using chiral stationary phases.
C) Based on Elution Techniques:
Isocratic Separation:
In this the same mobile phase combination is used throughout the
process of separation.
Gradient Separation:
In this a mobile phase combination of lower polarity is used followed
by gradually increasing the polarity.
D)Based on the Scale of Operation:
Analytical HPLC:
Where only analysis of the samples can be done. Recovery of the
samples for reusing is not done, since the sample used is very low.
Preparative HPLC:
Where the individual fractions of pure compounds can be collected
using fraction collector. The collected samples are reused.
E)Based on the Type of Analysis:
Qualitative Analysis:
This is used to identify the compound, detect the presence of impurities,
Quantitative Analysis:
This is done to determine the quantity of the individual or several
components in a mixture. This is done by comparing the peak area of the
standard and sample.
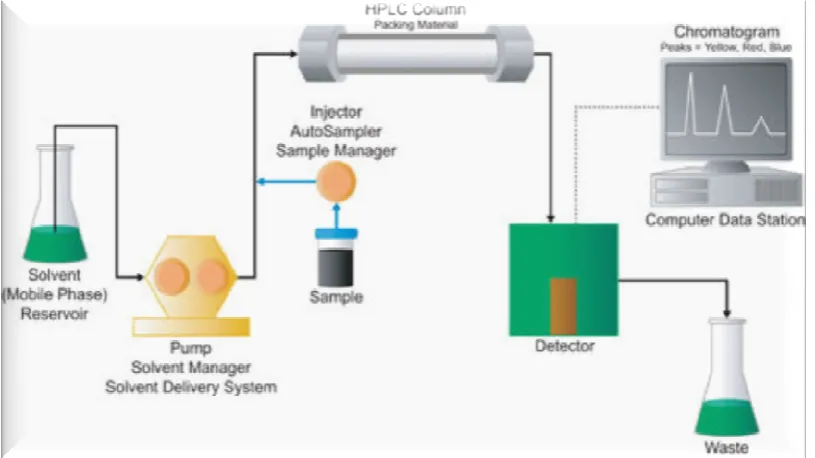
1.4b Instrumentation of HPLC: 5
HPLC instrumentation includes a pump, injector, column, detector and data
system (Figure No. 8). The heart of the system is the column where separation
occurs. Since the stationary phase is composed of micrometer size porous
particles, a high pressure pump is required to move the mobile phase through the
column. The chromatographic process begins by injecting the solute onto the top
of the column. Separation of components occurs as the analytes and mobile phase
are pumped through the column. Eventually, each component elutes from the
column as a narrow band (or Peak) on the recorder.
Detection of the eluting components is important, and this can be either selective
or universal, depending upon the detector used. The response of the detector to
each component is displayed on a chart recorder or computer screen and is known
as a chromatogram. To collect, store and analyse the chromatographic data,
computer, integrator and other data processing equipment are frequently used.
The Main Components of HPLC are:
a) Solvent Reservoir
b) Pump
c) Injection Port
d) Column
e) Detector
Figure No. 8. Components of High Performance Liquid Chromatography
a) Solvent Reservoir:
Solvent Reservoir is used to store mobile phase. Scott Duran bottles are
commonly used as solvent reservoirs. The solvent reservoir must be made of inert
material such as glass and must be smooth so as to avoid growth of microorganisms
on its walls. It can be transparent or can be amber colored. A graduated bittle gives a
rough estimate of mobile phase volume in the bottle. Solvent reservoirs are placed
above HPLC system (at higher level) in a tray. They should never keep directly above
the system as any spillage of solvent on the system may damage electronic parts of
HPLC.
Mobile Phase:
The power of HPLC in terms of being able to resolve many compounds is
mainly due to the diversity of mobile phase or mobile solvents available. The mobile
separation of component mixtures. Table No. 2 summarizes the commonly used
HPLC solvents and their properties.
Table No. 2. Common HPLC Solvents and their Properties
Ideally, solvents used as HPLC mobile phases should have these
characteristics:
High solubility for the sample components
Non corrosive to HPLC system components
High purity, low cost and UV transparency
Other desirable characteristics include low viscosity, low toxicity and non
flammability.
Buffers:
The pH of the aqueous component in the mobile phase can have a dramatic
effect on the retention of ionizable (acidic or basic) analytes. In RP-HPLC, the
ionized form of the solute does not partition well into the hydrophobic stationary
phase and has significantly lower pKa than the neutral form. Buffers are required to
control the pH of the mobile phase. Table No. 3 summarizes the commonly used
Table No. 3. Common HPLC Buffers and their Respective
pKa and UV Cut-off Wavelength
b) Pump:
The HPLC pump is very important in component of the system. The pump
delivers the constant flow of the mobile phase so that the separation of the
components of the mixture occurs in a reasonable time. There are two types of
pumping systems namely Isocratic and Gradient. The gradient type of pumps also
classified into two types, those are:
High pressure mixing, e.g. Mechanical and Piston pumps
Low pressure mixing, e.g. Pneumatic and Quaternary pumps
Modern pumps have the following parameters:
Flow rate range: 0.01 to 5 ml/min
Flow rate stability: NMT 1%
For SEC flow rate stability should be less than 0.2%
There are three types of pumps commonly used:
Reciprocating Pump:
Reciprocating pumps usually consist of a small chamber in which the solvent
is pumped by the back and forth motion of a motor driven piston. Two check valves
control the flow of solvent. Reciprocating pumps (Figure No. 9) have a disadvantage
of producing pulsed flow, which must be damped as its presence is manifested as base
line noise on the chromatogram. Advantages of this pump include their small internal
volume, high output pressure, ready adaptability to gradient elution and independent
of column backpressure and viscosity of solvent.
Figure No. 9. Reciprocating Pump
Displacement Pump:
Displacement pumps usually consist of large syringe like chambers equipped
with a plunger that is activated by a screw driven mechanism powered by stepping
motor. Displacement pumps also produce a flow that tends to be independent of
viscosity and backpressure. In addition, the output is pulse free. Disadvantages
include limited solvent capacity (250 ml) and considerable inconvenience when
solvents must be changed.
Pneumatic Pump:
In pneumatic pumps, the mobile phase is contained in a collapsible container
inexpensive and pulse free. They suffer from limited capacity, pressure output,
dependence of flow rate on solvent viscosity and column backpressure. In addition,
they are not amenable to gradient elution and are limited to pressures less than about
2000 psi.
c) Injection Port: 6
Sample introduction can be accomplished in various ways. The simplest method
is to use an injection valve. In more sophisticated LC systems, automatic
sampling devices are incorporated where the sample is introduced with the help
of auto samplers and microprocessors. In liquid chromatography, liquid samples
may be injected directly and solid samples need only be dissolved in an
appropriate solvent. The solvent need not be the mobile phase, but frequently it is
judiciously chosen to avoid detector interference, column/component
interference, and loss in efficiency or all of these.
It is always best to remove particles from the sample by filtering over a 5 µm
filter or centrifuging, since continuous injections of particulate material will
eventually cause blockages in injection devices or columns. Sample sizes may
vary widely. The availability of highly sensitive detectors frequently allows use
of the small samples which yield the highest column performance.
The most widely used sample injection system is loop injection valve. These
valves provide precise injection volumes against high-pressures. In this sample
load mode, the sample is flushed through the sample loop with the excess going
to the drain. For sample is flushed through the sample loop with excess going to
the drain. For sample injection, the valves are rotated so that the mobile phase
flows through the sample loop flushing the sample to column. Precision of the
In Rheodyne 7125 valve (Figure No. 10), sample from a microlitre syringe is
loaded into the needle port, filling the sample loop, which is a small piece of
stainless steel tube connected between ports. Any excess goes to waste from
another port. On turning to ‘inject’, the loop contents are flushed on to the
column. A variety of loop volumes is available, commonly 10-50 µl.
Figure No. 10. Injector
d) Column: 7
Typical HPLC columns are 5, 10, 15 and 25 cm in length and are filled with
small diameter (3, 5 or 10 µm) particles. The internal diameter of the columns are
usually 4.6 mm; this is considered the best compromise for sample capacity,
mobile phase consumption, speed and resolution. However, if pure substances are
to be collected (preparative scale), then larger diameter columns may be needed.
Packing the column tubing with small diameter particles requires high skill and
specialized equipment. For this reason, it is generally recommended that all but
the most experienced chromatographers purchase prepacked columns, since it is
difficult to match the high performance of professionally packed LC columns
In general, LC columns are fairly durable and one can expect a long service life
unless they are used in some manner which is intrinsically destructive, as for e.g.
with highly acidic or basic eluents, or with continual injections of 'dirty'
biological or crude samples.
There are three types of columns namely:
Analytical columns
Preparative columns
Guard columns
Column Packing Materials (Adsorbents):
In liquid-liquid chromatography the stationary phase is a liquid film coated on a
packing material consisting of 3-10 µm porous silica particles. The stationary
phase may be partially soluble in the mobile phase, causing it to “bleed” from the
column over time. To prevent this loss of stationary phase, it is covalently bound
to the silica particles. Bonded stationary phases are attached by reacting the silica
particles with an organochlorosilane of the general form Si(CH3)2RCl, where R is
an alkyl or substituted alkyl group.
To prevent unwanted interactions between the solutes and any unreacted –SiOH
groups, the silica frequently is “capped” by reacting it with Si(CH3)3Cl; such
columns are designated as end-capped.
The properties of a stationary phase are determined by the nature of the
organosilane alkyl group. If R is a polar functional group, then the stationary
R contains a cyano (–C2H4CN), diol (–C3H6OCH2CHOHCH2OH), or amino
(–C3H6NH2) functional group. Since the stationary phase is polar, the mobile
phase is a nonpolar or moderately polar solvent. The combination of a polar
stationary phase and a nonpolar mobile phase is called normal-phase
chromatography.
In reverse-phase chromatography, which is the more commonly encountered
form of HPLC, the stationary phase is nonpolar and the mobile phase is polar.
The most common nonpolar stationary phases use an organochlorosilane for
which the R group is an n-octyl (C8) or n-octyldecyl (C18) hydrocarbon chain.
Most reverse-phase separations are carried out using a buffered aqueous solution
as a polar mobile phase. Because the silica substrate is subject to hydrolysis in
basic solutions, the pH of the mobile phase must be less than 7.5.
e) Detector: 8
Detectors detect various compounds as they elute out from column. The detector
gives response in terms of a milivolt (mv) signal that is then processed by the
computer (integrator) to obtain you a chromatogram. Basically detector consists
of a flow cell through which the mobile phase and resolved. Sample moves optic
shine through the detector cell and variation in optical properties are detected.
Various types of HPLC detector:
UV-Visible detector
Photo diode array detector (PDA)
Fluorescence detector
Conductometric and colorimetric detector
Mass detector
Among these detector, photo diode array detector (PDA) is the most used
detector in LC today. The PDA gives a three dimensional view of chromatogram
(intensity Vs time) and spectra (intensity Vs wavelength) simultaneously. It can
be called as Spectro- chromatogram. The detailed analysis of the data reveals
more information on the complexity of coelution and helps in identifying the
merged peaks and gives information on peak purity.
Ideal characteristics of a detector:
Either is equally sensitive to all eluted peaks.
The ideal detector give the response (area) proportional to the amount
injected, irrespective of the size of sample.
Cheap, reliable and easy to use.
Should not be affected by change in temperature or mobile phase
composition.
It should be able to monitor small amount of compound.
f) Data Acquisition System:
Since the detector signal is electronic, using modern data collection techniques
can aid the signal analysis. In addition, some systems can store data in a
retrievable form for highly sophisticated computer analysis at a later time. The
main goal is using electronic data system is to increase analysis accuracy and
precision, while reducing operator attention.
There are several types of data systems, each differing in terms of available
features. In routine analysis, where no automation (in terms of data management
or process control) is needed, a pre-programmed computing integrator may be
sufficient. If higher control levels are desired, a more intelligent device is
processors in chromatographs are found in several areas. First, additional
automation options become easier to implement. Second, complex data analysis
becomes more feasible. These analysis options include such features as run
parameter optimisation and deconvolution (i.e. resolution) of overlapping peaks.
Finally, software safeguards can be designed to reduce accidental misuse of the
system.
1.5 Chromatography Parameters: 9
Retention Time (tR):
The time between the sample injection and the peak maximum is called
retention time. Retention time is measured in minutes or seconds.
Retention Volume (vR):
Retention volume is the volume of mobile phase required to elute 50% of the
component from the column. It is the product of retention time and flow rate.
vR = Retention time (tR) x Flow rate
Resolution (RS):
Resolution (Rs) is a measure of the degree of separation of two adjacent
analytes. Rs is defined as the difference in retention time of the two peaks divided by
the average peak width.
Where,
tR1and tR2 = Retention time or baseline distances between the
point of injection and the perpendicular dropped
Wb1and Wb2 = Respective peak widths determined at half peak
height, measured in the same units as tR1 and tR2
Column Efficiency (N):
It is called as the number of theoretical plates (N). It is a measure of the
efficiency of the column. If the number of theoretical plates is high, the column is said
to be highly efficient. If the number of theoretical plates is low, the column is said to
be less efficient.
Number of theoretical plates, N =
Tailing Factor (T):
The tailing factor T, a measure of peak symmetry is unity for perfectly
symmetrical peaks and its value increases as tailing becomes more pronounced. In
some cases, values less than one may be observed. As peak asymmetry increases
integration and hence precision becomes less reliable.
T = W 0.05/2f
Where,
W 0.05 = Width of peak at 5% height
f = Distance from the peak maximum to the leading
edge of the peak, the distance being measured at
a point 5% of the peak height from the baseline
Peak Symmetry:
The peak symmetry can be represented in terms of peak asymmetry factor
which can be calculated by using the following formula:
Peak asymmetry factor = B/A
Where,
B = The distance at 50% peak height between leading edge
to the perpendicular drawn from the peak maxima
A = The width of the peak at half of the peak height
1.6 Method Development: 10
The number of drugs introduced into the market is increasing every year. These
drugs may be either new entities or partial structural modification of the exiting
one. Very often there is a time lag from the date of introduction of a drug into the
market to the date of its inclusion in pharmacopoeias.
This happens because of the possible uncertainties in the continuous and wider
usage of these drugs, reports of new toxicities (resulting in their withdrawal from
the market), Development of patient resistance and introduction of better drugs
by competitors under this condition, standards and analytical procedures for this
drug may not be available in the pharmacopoeias. It becomes necessary, therefore
to develop newer analytical methods for such drugs.
There are several valid reasons for developing new methods of analysis:
There may not be a suitable method for a particular analyte in the specific
sample matrix.
Existing method may be too erroneous or unreliable.
Existing method may not provide adequate sensitivity or analyte
selectivity in samples of interest.
Newer instrumentation and techniques may have evolved that
provide opportunity for improved methods, including improved analyte
identification or detection limits, greater accuracy or precision or better
There may be a need for an alternative method for legal or scientific
reasons, to confirm analytical data obtained by existing methods.
Goals for new or improved analytical method might include the following:
Qualitative identification of the specific analyte(s) of interest providing
some structural information to confirm “general behavior” (e.g. retention
time, colour change, pH etc).
Quantitative determination, at trace levels when necessary that is accurate,
precise and reproducible in any laboratory setting when performed
according to established procedures.
Ease of use, ability to be automated, high sample throughput and rapid
sample turnaround time.
Decreased cost per analysis from using simple quality assurance and
quality control procedures.
Sample preparations that minimize time, effort, materials and volume of
sample consumed.
Steps Involved in Method Development:
Solubility Profile:
Solubility information in different solvents is useful while selecting the
diluents for standard solutions and extraction solvents for test solutions.
Analytical Profile:
The spectral profile is useful in understanding the absorption characteristics,
which helps in selection of detector and the wavelength for analysis.
Stability Profile:
The information on the stability of the drug substance with respect to storage
while handling drug substance and its solutions.
Selection and Optimization of Mobile Phase:
The primary objective in selection and optimization of mobile phase is to
achieve optimum separation of all the individual impurities and degradants
from analyte (API) peak. The selection of mobile phase is done always in
combination with selection of column (stationary phase). The following are
the parameters, which shall be taken into consideration while selecting and
optimizing the mobile phase.
a) Buffer, if any and its strength
b) pH of the buffer or pH of the mobile phase
c) Mobile phase composition
a) Buffer, if any and its Strength:
Buffer and its strength play an important role in deciding the peak
symmetries and separations. Various types of buffers can be employed for
achieving the required separations. Some of the most commonly used buffers
are:
Phosphate buffers - KH2PO4, K2HPO4, NaH2PO4, Na2HPO4,
H3PO4 etc.,
Acetate buffers - Ammonium acetate, Sodium acetate etc.,
Triethylamine/Diethylamine buffers
Buffers with various ion-pair reagents like Tetra butyl ammonium
hydrogen sulphate
The retention time also depend on the molar strength of the buffer.
The selection of buffer and its strength is done always in combination
with selection of organic phase composition in mobile phase. The strength of
the buffer can be increased if necessary to achieve the required separations.
But it is to be ensured that the higher buffer strengths shall not result in
precipitations/turbidities either in mobile phase or in standard and test
solutions while allowed to stand in bench top or in refrigerator.
b)pH of the Buffer or pH of the Mobile Phase:
pH plays an important role in achieving the chromatographic
separations as it controls the elution properties by controlling the ionization
characteristics. Depending on the pKa, drug molecules change retention.
e.g. Acids show an increase in retention as the pH is reduced, while base show a
decrease.
c)Mobile Phase Composition:
In reverse phase chromatography, the separation is mainly controlled by
the hydrophobic interactions between drug molecules and the alkyl chains on
the column packing material. Most widely used solvents in reverse phase
chromatography are methanol and acetonitrile.
Selection of Column:
Column plays the most important role in achieving the chromatographic
separations. A column which separates all the impurities and degradants from
API peak and which is rugged for variation in mobile phase shall be selected.
Most chromatographic separations are achieved due to wide variety of
columns available and due to flexibility to change and control each of the
Length and diameter of the column
Pore volume
Packing material
Surface area
Shape of the particles
End capping
Size of the particles
% of carbon loading
Selection of Flow Rate:
Preferably the flow rate should NMT 2.5 ml/min. Check the ruggedness of the
method by varying the flow rate by ±0.2 ml from the selected flow rate. Select
the flow rate is based on the below parameters namely,
Retention time
Column back pressure
Separation of impurities
Peak symmetries
Selection of Injection Volume:
Generally an injection volume of 10 to 20 µL is recommended for the
estimation of API. However, if the extractions are found to be difficult, then
the injection volume can be increased up to 50 µL. But it is to be ensured that
at the selected injection volume, the column is not overloaded, resolution
between individual impurities from API peak and the peak symmetry are not
Selection of Column Temperature:
Always it is preferable to optimize the chromatographic conditions with
column temperature as ambient. However, if the peak symmetry could not be
achieved by any combination of column and the mobile phase, then the
column temperature above ambient can be adopted. The increase in column
temperature generally will result in reduction in peak symmetry and peak
retention. When found necessary, the column temperature between 30ºC and
80ºC shall be adopted. If a column temperature of above 80ºC is found to be
necessary, packing materials, which can withstand to that temperature shall be
chosen.
Selection of Detector Wavelength:
Selection of detector wavelength is a critical step in finalization of the
analytical method. In most cases HPLC method development is carried out
with UV detection using either a variable-wavelength or a photodiode array
detector, which can provide an adequate response for most samples.
Establishment of System Suitability:
System suitability parameter has to be selected based on the tailing factor,
resolution, plate count and percentage RSD.
1.7 Method Validation: 11, 12
Method validation can be defined as “Establishing documented evidence, which
provides a high degree of assurance that a specific activity will consistently
produce a desired result or product meeting its predetermined specifications and
quality characteristics”.
Method validation is an integral part of the method development. It is the process
preciseness of its intended purpose and demonstrating that analytical procedures
are suitable for their intended use that they support the identity, quality, purity
and potency of the drug substances and drug products. Data thus generated
become part of the methods validation package submitted to Center for Drug
Evaluation and Research (CDER). Simply, method validation is the process of
proving that an analytical method is acceptable for its intended purpose.
Methods should be reproducible when used by other analysts, on other equivalent
equipment, on other days or locations and throughout the life of the drug product.
Data that are generated for acceptance, release and stability or pharmacokinetic
will only be trustworthy if the methods used to generate the data are reliable. The
process of validation and method design also should be clear in the development
cycle before important data are generated. Validation should be on going in the
form of re-validation with method changes.
Though many types of HPLC techniques are available, the most commonly used
method, the reversed-phase HPLC with UV detection, is selected to illustrate the
parameters for validation. All the variables of the method should be considered,
including sampling procedure, sample preparation, chromatographic separation,
detection and data evaluation. For chromatographic methods used in analytical
applications there is more consistency in validation practice with key analytical
parameters including
A) System Suitability
B) Accuracy
C) Precision
D) Specificity
F) Limit of Detection
G) Limit of Quantitation
H) Robustness
I) Ruggedness
A) System Suitability:
According to the USP, system suitability tests are an integral part of
chromatographic methods. These tests are used to verify that the resolution and
reproducibility of the system are adequate for the analysis to be performed.
System suitability tests are based on the concept that the equipment, electronics,
analytical operations and samples constitute an integral system that can be
evaluated as a whole. The purpose of the system suitability test is to ensure that the
complete testing system (including instrument, reagents, columns and analysts) is
suitable for the intended application.
System suitability is the checking of a system to ensure system performance before
or during the analysis of unknowns. Parameters such as plate count, tailing factors,
resolution and reproducibility (%RSD, retention time and area for six repetitions)
are determined and compared against the specifications set for the method.
These parameters are measured during the analysis of system suitability "sample"
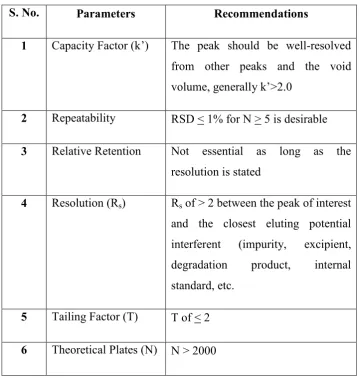
that is a mixture of main components and expected by-products. Below Table
(Table No. 4) shows thelist of parameters to be measured and their recommended
limits obtained from the analysis of the system suitability sample as per current
Table No. 4. System Suitability Parameters and Recommendations
S. No. Parameters Recommendations
1 Capacity Factor (k’) The peak should be well-resolved
from other peaks and the void
volume, generally k’>2.0
2 Repeatability RSD < 1% for N > 5 is desirable
3 Relative Retention Not essential as long as the
resolution is stated
4 Resolution (Rs) Rs of > 2 between the peak of interest
and the closest eluting potential
interferent (impurity, excipient,
degradation product, internal
standard, etc.
5 Tailing Factor (T) T of < 2
6 Theoretical Plates (N) N > 2000
B) Accuracy:
The accuracy of an analytical procedure expresses the closeness of agreement
between the value which is accepted either as a conventional true value or an
accepted reference value and the value found.
Accuracy can usually be determined in one of three ways:
The procedure was applied to the known concentration of
reference sample and the measured value to the true value was compared
The test results obtained were compared by the analytical procedure
which was proved to be accurate with the results obtained from an
existing alternate method that was known to be accurate.
Spiking concept, by spiking either analyte/impurities into sample matrix
with one another.
C) Precision:
The precision of an analytical procedure expresses the closeness of agreement
(degree of scatter) between a series of measurements obtained from multiple
sampling of the same homogeneous sample under the prescribed condition. ICH
has defined; precision may be considered at three levels namely repeatability,
intermediate precision and reproducibility.
Repeatability:
Repeatability expresses the precision under the same operating conditions
over a short interval of time. Repeatability is also termed intra- assay
precision.
Intermediate Precision:
Intermediate precision was previously known as part of ruggedness. The
objective is to ensure that the method will provide the same results when
similar samples are analyzed once the method development phase is over.
Depending on time and resources, the method can be tested on multiple
days, analysts, instruments, etc.
Reproducibility:
Reproducibility expresses the precision between laboratories as in
collaborative studies. Multiple laboratories are desirable but not always
D) Specificity:
The specificity of the method corresponds to the non-interaction of the placebo
with that of the active particle. Typically these might include impurities,
degradants, matrix, etc.
E) Linearity:
A linear relationship should be evaluated across the range of the analytical
procedure. Linearity should be evaluated by visual inspection of a plot of signals
as a function of analyte concentration or content.
If there is a linear relationship, test results should be evaluated by appropriate
statistical methods, for example, by calculation of a regression line by the method
of least squares. The correlation coefficient, y-intercept, slope of the regression
line and residual sum of squares should be submitted. A plot of the data should be
included. In addition, an analysis of the deviation of the actual data points from
the regression line may also be helpful for evaluating linearity.
F) Limit of Detection (LOD):
The detection limit of an individual analytical procedure is the lowest amount of
analyte in a sample which can be detected but not necessarily quantitated as an
exact value. The detection limit is usually expressed as the concentration of the
analyte (e.g. percentage or parts per million) in the sample and it can be
calculated by using the following formula:
LOD = 3 x Sa / b
Where,
Sa = Standard deviation of the intercept
G) Limit of Quantitation (LOQ):
The quantitation limit of an individual analytical procedure is the lowest amount
of the analyte in a sample that can be determined with acceptable precision and
accuracy under the stated experimental conditions. The quantitation limit is
usually expressed as the concentration of the analyte (e.g. percentage or parts per
million) in the sample and it can be calculated by using the following formula:
LOQ = 10 x Sa / b
Where,
Sa = Standard deviation of the intercept
b = Slope of the calibration curve
H) Robustness:
The robustness of an analytical procedure is a measure of the method's capability
to remain unaffected by small, but deliberate variations in method parameters
such as flow rate, pH of the mobile phase, column temperature, percentage
organic solvent strength and buffer concentration etc. It can be partly assured by
good system suitability specifications.
If measurements are susceptible to variations in analytical conditions, the
analytical conditions should be suitably controlled or a precautionary statement
should be included in the procedure. One consequence of the evaluation of
robustness should be that a series of system suitability parameters
(e.g. Resolution test) is established to ensure that the validity of the analytical
I) Ruggedness:
Method ruggedness is defined as the reproducibility of results when the method is
performed under actual use conditions. This includes different analysts,
laboratories, columns, instruments, source of reagents, chemicals, solvents etc.
Method ruggedness may not be known when a method is first developed, but
insight is obtained during subsequent use of that method.
CHAPTER - II
DRUG PROFILE
2.1 Codeine Phosphate:13
Structure:
CAS Number : 76-57-3
Chemical Name : 7,8-Didehydro-4,5 alpha-epoxy-3-methoxy-17-
methyl morphinan-6 alpha-ol phosphate (1:1)
(Salt) hemihydrates
Molecular Formula : C18H21NO3 H3PO4 ½H2O
Molecular Weight : 406.4
Physical Properties : White crystalline powder, Odourless and
Bitter taste
Solubility : Soluble in water
pKa : 8.21
Category : Antitussive and Analgesic
Dose : 30 to 60 mg every 4 hours when necessary, to
Mechanism of Action:
Codeine phosphate is an opioid analgesic which binds with stereo specific
receptors at many sites within the CNS to alter processes affecting both the
perception of pain and the emotional response to pain. There are multiple sub
types of opioid receptors, each mediating various therapeutic and/or side effects
of drugs. Codeine has about one-sixth the analgesic activity of morphine.
Pharmacokinetics:
Codeine is readily absorbed from the gastro-intestinal tract and metabolized by
O-and N-demethylation in the liver to morphine and nor codeine which with
codeine are excreted almost entirely by the kidney, mainly as conjugates with
glucuronic acid.
Most of the excretion products appear in the urine within 6 hours and 40 to 60
percent of the codeine is excreted free or conjugated, approximately 5 to 15
percent as free and conjugated morphine and about 10 to 20 percent as free and
conjugated norcodeine.
Dose and Method of Administration:
Adults: Codeine phosphate may be given orally in doses of 15 mg-60 mg every
4-6 hours as needed. It these doses fail to relive pain, larger doses rarely succeed
and may give rise to restlessness and excitement. The maximum recommended
daily dose is 300 mg.
Paediatric: The usual paediatric dose for infants and children is 0.5 mg per kg of
body weight or 15 mg per square metre of body surface, every 4 to 6 hours as
needed. The maximum recommended dose is 240 mg in 24 hours. The duration