Benchmarking procedure and analyses with performance data from 2006
(Year 4)
Year 4, 2006
Technical Report 21, 2006 (T21/06)
Jean Underwood, Gayle Dillon
Quantitative Evaluation Team
08 June 2007 http://www.evaluation.icttestbed.org.uk page 2 of 40 © ICT Test Bed 2007
Contents
Key findings ...3
LA performance comparisons ...3
School performance comparisons...4
Findings summary ...6
Benchmarking of local authorities (LAs)...6
Benchmarking of individual schools ... 22
Rates of change in national performance scores (2002-2006)... 35
As in previous years, the 2007 findings presented here (using the 2006
national performance data) are the result of two separate methods of
benchmarking. The first analysis is based on the results from all schools and
colleges within the Test Bed local authorities (LAs) and their matched
comparator LAs. The second analysis is based on the results from Test Bed
schools and their matched comparator schools only. Data from the Key Stage
1 (KS1), Key Stage 2 (KS2), Key Stage 3 (KS3) and GCSE tests are
presented here.
Due to changes in the reporting of data of the post-16 tests only a limited
analysis has been undertaken.
Key findings
The impact of the technology dip
We previously reported a technology dip in the year that resources
were introduced into the Test Bed schools followed by a recovery in
staff ICT competence and confidence in the following year. This dip
was mirrored by a dip in pedagogy with a subsequent but slower
recovery a year later as staff began to adapt their pedagogy to
accommodate the new technology. It was argued that any evaluation of
the investment in ICT should take account of this dip and recovery
process and the data reported here support this argument. In the third
year of the project there was evidence that the performance of Test
Bed students had drawn level with those of the controls at KS2 and at
GCSE. In this, the fourth year of the project, there is now evidence of
these students outperforming controls at KS2 and GCSE.
08 June 2007 http://www.evaluation.icttestbed.org.uk page 4 of 40 © ICT Test Bed 2007
At KS2 Test Bed LAs demonstrated significantly higher rises in average
point score (APS) than schools in the comparator LAs over the period
of the project.
At KS3, across all the subtests and the APS there were no significant
differences between the performance of the Test Bed LAs and the
comparator LAs for any year of the project. That is, performance at
KS3 was not mediated by whether the LAs had been involved in the
Test Bed project or not, but by their performance in previous years.
On a range of performance measures at GCSE, while the data show
overall improvement on all measures over the period of the project for
both Test Bed and comparator LAs, in the final year of the project the
previously significant advantage for comparator LAs was no longer
apparent. The Test Bed schools were now performing at the same level
as their comparator LAs.
At GCSE there was a significant difference in performance
improvement between Test Bed and comparator difference scores
(2006-2002) for A* to C grades, with Test Bed LAs outperforming the
comparator LAs.
School performance comparisons
For the youngest children in the Test Bed project, performance on the
KS1 reading tests had increased significantly between 2003 and 2006.
Performance on all KS2 tests were found to have significantly improved
between 2002 and 2006 within Test Bed schools. A similar sustained
performance improvement was not found for the comparator schools. At KS2 2006, a significant difference was found between the Test Bed
and comparator schools for the rate of change over the lifetime of the
project between for each English, mathematics, science and for the
APS.
At KS3 there were no significant differences for rates of change scores
between the Test Bed and comparator schools for any of the measures
In 2006, at GCSE level, significantly more pupils achieved five or more
A* to C grades, including English and mathematics in Test Bed schools
than in comparator schools.
The comparator schools percentage of GCSE grades A* to C improved
in each year of the project but the pattern for the Test Bed schools was
more variable as a result of the technology dip.
While the rate of change in GCSE performance scores other than APS
was higher in comparator than Test Bed schools up until 2005, this
advantage disappeared in 2006. Again this is suggestive of a
08 June 2007 http://www.evaluation.icttestbed.org.uk page 6 of 40 © ICT Test Bed 2007
Findings summary
Benchmarking of local authorities (LAs)
Key Stage 1
As in previous years, performance data for the KS1 tests were not available to
us for all the institutions involved in the LA analyses. Therefore, no results are
reported here.
Key Stage 2
A series of regression analyses with LA status (Test Bed or comparator),
performance data from 2002, 2003, 2004 and 2005 as the predictor variables
and performance data from 2006 as the outcome variable were conducted
(see Table 1 for means and standard deviations). The key predictors of
success on these tests in 2006 were found to be past performance in 2004
and 2005. For the average point score (APS), performance in 2002 and in
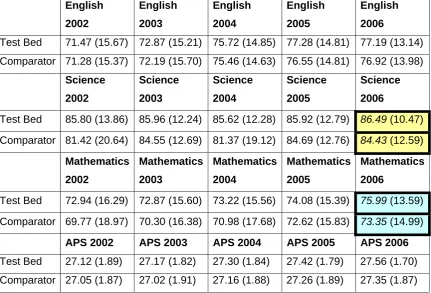
Table 1: Means and standard deviations for performance on the KS2 sub
tests and APS (percentage of pupils achieving level 4 or above)
English
2002
English
2003
English
2004
English
2005
English
2006
Test Bed 71.47 (15.67) 72.87 (15.21) 75.72 (14.85) 77.28 (14.81) 77.19 (13.14)
Comparator 71.28 (15.37) 72.19 (15.70) 75.46 (14.63) 76.55 (14.81) 76.92 (13.98)
Science
2002
Science
2003
Science
2004
Science
2005
Science
2006
Test Bed 85.80 (13.86) 85.96 (12.24) 85.62 (12.28) 85.92 (12.79) 86.49(10.47)
Comparator 81.42 (20.64) 84.55 (12.69) 81.37 (19.12) 84.69 (12.76) 84.43 (12.59)
Mathematics
2002
Mathematics
2003
Mathematics
2004
Mathematics
2005
Mathematics
2006
Test Bed 72.94 (16.29) 72.87 (15.60) 73.22 (15.56) 74.08 (15.39) 75.99 (13.59)
Comparator 69.77 (18.97) 70.30 (16.38) 70.98 (17.68) 72.62 (15.83) 73.35 (14.99)
APS 2002 APS 2003 APS 2004 APS 2005 APS 2006
Test Bed 27.12 (1.89) 27.17 (1.82) 27.30 (1.84) 27.42 (1.79) 27.56 (1.70)
Comparator 27.05 (1.87) 27.02 (1.91) 27.16 (1.88) 27.26 (1.89) 27.35 (1.87)
Highlighted cells by colour indicate significant differences across groups or
years.
A series of analyses were also completed with Test Bed or comparator status
as the coding variable and performance on each of the sub tests in 2002,
2003, 2004, 2005 and 2006 as the dependent variables. No differences were
found between the Test Bed and comparator LAs in their performance on any
test in the years prior to 2006. However, the 2006 data do show significant
differences in performance for the mathematics and science sub tests. On
08 June 2007 http://www.evaluation.icttestbed.org.uk page 8 of 40 © ICT Test Bed 2007
In summary, on a range of performance measures at KS2, while the data
show overall improvement on all measures over the period of the project for
both Test Bed and comparator LAs, in the final year of the project the
differential between the two had increased showing an advantage for Test
Graphs 1 to 4 showing mean Scores and 95 per cent confidence intervals for the percentage of pupils achieving level 4 on the KS2 sub tests
and average point score for Test Bed and comparator local authorities.
Graph 1: KS2 level 4 English 2006 Graph 2: KS2 level 4 mathematics 2006
Graph 3: KS2 level 4 science 2006 Graph 4: KS2 average point scores 2006
Comparator Test Bed
status
Comparator Test Bed
status
100.00
80.00
60.00
40.00
20.00
0.00
M
ean ks2Le
vel
4E
ngli
s
h20
0
6
Error bars: 95% CI
100.00
80.00
60.00
40.00
20.00
0.00
M
e
an ks2L
evel
4M
a
th
s200
6
Error bars: 95% CI
Key Stage Three
A series of regression analyses with LA status (Test Bed or comparator) and
performance data from 2002, 2003, and 2004 as the predictor variables and
performance data from 2005 as the outcome variable were also conducted for
the KS3 tests. The key predictors of success on the English and mathematics
tests in 2006 was found to be past performance in 2002, 2003, 2004 and
2005. For the science test, performance in 2003, 2004 and 2005 were the
significant predictors. For the APS, performance in 2006 was predicted by
previous performance in 2005.
A series of MANOVA analyses were also completed with Test Bed or
comparator status as the coding variable and performance on each of the
sub-tests in 2002, 2003, 2004, 2005 and 2006 as the dependent variables.
The analyses revealed that for all the subtests and the APS there was no
significant differences between the performance of the Test Bed LAs or the
comparator LAs for any year of the project.
A series of repeated measure ANOVA analyses revealed significant
differences within the Test Bed local authorities for scores on tests of English
between the final year of the project (2006) and the years prior to the start of
the project (2002) and the first year of the project (2003). The same was true
for the comparator authorities on their performance on English tests (see table
2 for means and standard deviations). For the APS, mathematics and science
tests, performance was found have increased significantly year on year for
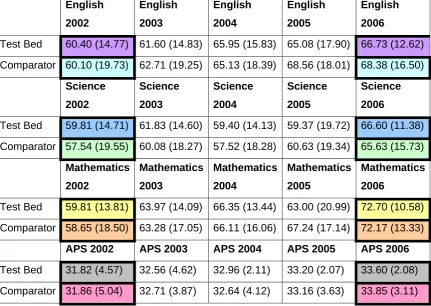
Table 2: Means and standard deviations for performance on the KS3 sub
tests and APS (percentage of pupils achieving level 5 or above)
English
2002
English
2003
English
2004
English
2005
English
2006
Test Bed 60.40 (14.77) 61.60 (14.83) 65.95 (15.83) 65.08 (17.90) 66.73 (12.62)
Comparator 60.10 (19.73) 62.71 (19.25) 65.13 (18.39) 68.56 (18.01) 68.38 (16.50)
Science
2002
Science
2003
Science
2004
Science
2005
Science
2006
Test Bed 59.81 (14.71) 61.83 (14.60) 59.40 (14.13) 59.37 (19.72) 66.60 (11.38)
Comparator 57.54 (19.55) 60.08 (18.27) 57.52 (18.28) 60.63 (19.34) 65.63 (15.73)
Mathematics
2002
Mathematics
2003
Mathematics
2004
Mathematics
2005
Mathematics
2006
Test Bed 59.81 (13.81) 63.97 (14.09) 66.35 (13.44) 63.00 (20.99) 72.70 (10.58)
Comparator 58.65 (18.50) 63.28 (17.05) 66.11 (16.06) 67.24 (17.14) 72.17 (13.33)
APS 2002 APS 2003 APS 2004 APS 2005 APS 2006
Test Bed 31.82 (4.57) 32.56 (4.62) 32.96 (2.11) 33.20 (2.07) 33.60 (2.08)
Comparator 31.86 (5.04) 32.71 (3.87) 32.64 (4.12) 33.16 (3.63) 33.85 (3.11)
Graphs 5 to 8 showing mean scores and 95 per cent confidence intervals for KS3 scores for Test Bed and comparator local
authorities.
Graph 5: Percentage of students gaining Graph 6: Percentage of students gaining
Graph 7: Percentage of students gaining Graph 8: Percentage of students gaining
Level 5 KS3 English 2006 Level 5 KS3 mathematics 2006
GCSEs
Regression analyses with LA status (Test Bed or comparator) and
performance data from 2002, 2003, 2004 and 2005 as the predictor variables
and performance data from 2006 as the outcome variable were also
conducted for tests at GCSE level. These analyses found that the number of
students attaining five or more A* to C Grades in both LA groups in 2006 was
predicted by the number of students attaining five or more A* to C grades in
2003, 2004 and 2005. This was also true for student performance in 2006 for
Grades A* to G. It was found that the students’ average point scores were
predicted by average point scores attained in 2002, 2004 and 2005.
MANOVA analyses were also completed with Test Bed or comparator status
as the coding variable and performance on each of the sub-tests in 2002,
2003, 2004, 2005 and 2006 as the dependent variables. Comparator LAs
were found to consistently and significantly outperform Test Bed schools in
2002, 2003, 2004 in the proportion of pupils achieving five or more GCSE A*
to C grades. In 2005 and 2006, however, the Test Bed LAs were no longer
found to be performing significantly less well than the comparator LAs (see
table 3 for means and standard deviations).
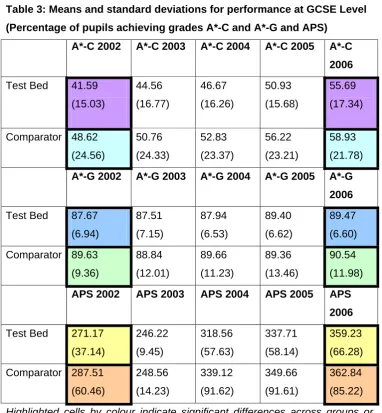
In summary, on a range of performance measures at GCSE, while the data
show overall improvement on all measures over the period of the project for
both Test Bed and comparator LAs, in the final year of the project the
previously significant advantage for comparator LAs was no longer apparent.
Indeed, the Test Bed schools were now performing at the same level as their
Table 3: Means and standard deviations for performance at GCSE Level
(Percentage of pupils achieving grades A*-C and A*-G and APS)
A*-C 2002 A*-C 2003 A*-C 2004 A*-C 2005 A*-C
2006
Test Bed 41.59
(15.03) 44.56 (16.77) 46.67 (16.26) 50.93 (15.68) 55.69 (17.34)
Comparator 48.62
(24.56) 50.76 (24.33) 52.83 (23.37) 56.22 (23.21) 58.93 (21.78)
A*-G 2002 A*-G 2003 A*-G 2004 A*-G 2005 A*-G
2006
Test Bed 87.67
(6.94) 87.51 (7.15) 87.94 (6.53) 89.40 (6.62) 89.47 (6.60)
Comparator 89.63
(9.36) 88.84 (12.01) 89.66 (11.23) 89.36 (13.46) 90.54 (11.98)
APS 2002 APS 2003 APS 2004 APS 2005 APS
2006
Test Bed 271.17
(37.14) 246.22 (9.45) 318.56 (57.63) 337.71 (58.14) 359.23 (66.28)
Comparator 287.51
(60.46) 248.56 (14.23) 339.12 (91.62) 349.66 (91.61) 362.84 (85.22)
Highlighted cells by colour indicate significant differences across groups or
years.
Although not significant, comparator LAs had also achieved a greater
proportion of A* to G grades in 2002, 2003, 2004 and 2005. However, the
2006 mean scores indicated that the gap between the two groups had
decreased over the course of the project. This is very encouraging, indicating
that the Test Bed LAs were catching up throughout the project and maintained
these gains as the project ended. For average point scores, whilst the
comparator LAs had again collectively scored higher on the tests in previous
groups, indicating that they had lessened the performance gap for this
measure.
For the within group analyses, the proportion of students achieving five or
more GCSE grades A* to C, A* to G and APS was found to have improved
significantly over the course of the project within the Test Bed and comparator
LAs. Graphs 9 to 11 show the mean scores and 95 per cent confidence
intervals for the percentage of students gaining five or more A* to C and A* to
G grades and APS in 2006.
In contrast to performance at KS2 where Test Bed LAs were outperforming
comparator LAs in the year preceding the start of the project (2002), at GCSE
the comparator LAs started the project with higher performance levels than
the Test Bed LAs. This difference in initial starting point of the LAs makes
using the 02-06 rate of change a key factor in these analyses (see following
Graphs 9 to 11 showing mean scores and 95 per cent confidence intervals for GCSE scores for Test Bed and comparator local authorities.
Graph 9: Percentage of students gaining 5 Graph 10: Percentage of students gaining 5
or more A* to C Grades at GCSE 2006 or more A* to G Grades at GCSE 2006
r Comparato
status
Graph 11: APS for GCSE 2006
Comparator Test Bed status 100.00 80.00 60.00 40.00 20.00 0.00 M e an As ta rt oC2 006
Error bars: 95% CI
Test Bed 100.00 80.00 60.00 40.00 20.00 0.00 M e a n As tartoG 200 6
Error bars: 95% CI
r Comparato status Test Bed 400.00 300.00 200.00 100.00 0.00 M e a n K S 4a v p o in tss c o re 20 06
Post 16
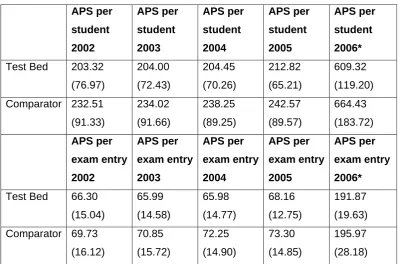
Table 4 shows the means and standard deviations for the A-level
performance data from 2002 to 2006. There are no analyses to report to date
due to changes in the way the scores were calculated in 2006.
Eyeballing the data suggest a gentle rise in performance over the period of
the project for both Test Bed and comparator LAs.
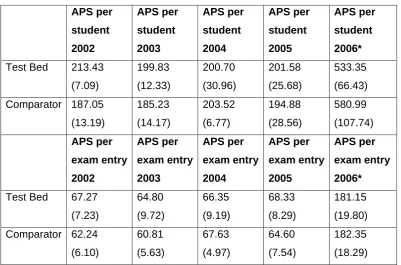
Table 4: Means and standard deviations for performance on the post-16
tests APS per student 2002 APS per student 2003 APS per student 2004 APS per student 2005 APS per student 2006*
Test Bed 203.32
(76.97) 204.00 (72.43) 204.45 (70.26) 212.82 (65.21) 609.32 (119.20) Comparator 232.51 (91.33) 234.02 (91.66) 238.25 (89.25) 242.57 (89.57) 664.43 (183.72) APS per exam entry 2002 APS per exam entry 2003 APS per exam entry 2004 APS per exam entry 2005 APS per exam entry 2006*
Test Bed 66.30
(15.04) 65.99 (14.58) 65.98 (14.77) 68.16 (12.75) 191.87 (19.63) Comparator 69.73 (16.12) 70.85 (15.72) 72.25 (14.90) 73.30 (14.85) 195.97 (28.18)
Highlighted cells by colour indicate significant differences across groups or
years.
[image:17.595.55.457.243.507.2]Rates of change in national performance scores (2002-2006)
Key Stage 1
These data are not available for local authority analyses.
Key Stage 2
At KS2 a significant difference was found for the rate of change between Test
Bed and comparator LAs for average point scores (APS) between 2002 and
2006. Mean scores indicated that schools in the Test Bed LAs demonstrated
significantly higher rises in APS than schools in the comparator LAs over the
period of the project (Test Bed mean = 0.56, comparator mean = 0.30).
Graphs 12 to 15 show the mean difference scores and 95 per cent confidence
intervals for each subtest.
Key Stage 3
At KS3 there were no significant differences for rates of change scores
between the Test Bed and comparator LAs for any of the measures.Graphs
16 to 19 show the mean difference scores and 95 per cent confidence
intervals for each subtest.
GCSE
At GCSE there was a significant difference between Test Bed and comparator
difference scores (2006-2002) for A* to C grades. Mean scores indicate that
schools in the Test Bed LAs increased between 2002 and 2006 at a
significantly faster rate than schools in the comparator LAs (Test Bed mean =
14.05, comparator mean = 10.39). Graphs 20 to 22 show mean difference
scores and 95 per cent confidence intervals for students achieving five or
more A* to C, A* to G grades and APS.
A-level
Bed and comparator local authorities.
Graph 12: English KS2 difference scores (2006-2002) Graph 13: Mathematics KS2 difference scores (2006-2002)
25.00
20.00
15.00
10.00
5.00
0.00
-5.00
25.00
20.00
15.00
10.00
5.00
0.00
-5.00
Graph 14: Science KS2 difference scores (2006-2002) Graph 15: APS KS2 difference score (2006-2002)
Comparator Test Bed
status
M
e
an E
ngli
s
h200
6
m
in
u
s
2
002
M
ean M
aths2
006m
in
us20
02
Test Bed Comparator
status
Error bars: 95% CI Error bars: 95% CI
25.00
20.00
2.50
Graphs 16 to 19 showing mean KS3 difference scores and 95 per cent confidence intervals on each subtest and average point score for Test
Bed and comparator local authorities.
Graph 16: English KS3 difference scores (2006-2002) Graph 17: Mathematics KS3 difference scores (2006-2002)
KS3 difference score (2006-2002)
Graph 18: Science KS3 difference scores (2006-2002) Graph 19: APS
006-2002) Graph 21: Five or more A*-G grades (2006-2002)
Graph 22: GCSE APS difference score (2006-2002) Graph 20: Five or more A* - C grades (2
Comparator Test Bed
status
25.00
20.00
15.00
10.00
5.00
0.00
M
ean Astarto
C
2
006m
inus200
2
Error bars: 95% CI
Comparator Test Bed
status
25.00
20.00
15.00
10.00
5.00
0.00
M
e
a
n
A
s
ta
rt
oG
20
0
6
m
inu
s
2
00
2
Error bars: 95% CI
120.00
Benchmarking of individual schools
Key Stage One results
Regression analyses using the APS from 2003, 2004, 2005 and status of the
school (Test Bed or comparator) as the predictor variables and average
performance scores achieved in 2006 as the outcome variable found that the
overall model was significant, although only performance in 2005 predicted
performance in the 2006 tests. Status of the schools (Test Bed or comparator)
was not found to be a predictor of performance. Regression analyses
conducted with performance data on the KS1 writing test found that past
performance in 2005 was a significant predictor of performance in 2006. For
the KS1 weading score, performance in 2004 and 2005 was found to be a
significant predictor of achievement in 2006, whilst the 2006 performance on
the mathematics test was predicted by scores in 2003 and 2005.
Table 5: Means and standard deviations for performance on the KS1
tests
Reading
2003
Reading 2004 Reading 2005 Reading
2006
Test Bed 13.24 (1.58) 14.38 (2.35) 14.58 (2.38) 14.50 (2.59)
Comparator 13.45 (0.85) 15.0 (1.06) 15.28 (0.87) 15.05 (1.36)
Writing 2003 Writing 2004 Writing 2005 Writing 2006
Test Bed 13.57 (2.71) 13.33 (2.90) 16.66 (2.53) 13.63 (2.76)
Comparator 13.80 (1.18) 13.86 (1.16) 14.22 (0.98) 13.95 (1.62)
Mathematics
2003
Mathematics
2004
Mathematics
2005
Mathematics
2006
Test Bed 15.23 (1.79) 15.00 (2.14) 15.00 (2.19) 15.04 (1.90)
Comparator 15.45 (1.17) 15.31 (1.00) 15.57 (0.86) 15.35 (1.25)
APS 2003 APS 2004 APS 2005 APS 2006
Test Bed 14.10 (2.04) 14.20 (2.42) 14.39 (2.35) 14.39 (2.38)
Comparator 14.33 (1.05) 14.73 (1.04) 15.06 (0.84) 14.78 (1.33)
Highlighted cells by colour indicate sign nt differences across groups or
years.
indicate that up until 2005, collective performance of
5
in
.
w The descriptive statistics
the Test Bed and comparator institutions has improved year on year, with the
exception of the mathematics sub-test, that is performance scores in 200
were higher than in 2004 and similarly performance in 2004 was higher than
in 2003 (see Table 5). In 2006, the Test Bed schools had improved on just
one test (mathematics) from the previous year, whilst the comparator schools
had seen declines in performance from their 2005 results. Performance
terms of change over time between 2003 and 2006 showed both sets of
schools had significantly increased their performance on KS1 Reading scores
This was not the case for writing, mathematics or APS. Graphs 23 to 26 sho
Graphs 23 to 26 Showing mean scores and 95 per cent confidence intervals for KS1 for Test Bed and comparator local authorities
Graph 23: KS1 reading scores 2006 Graph 24: KS1 writing scores 2006
Graph 25: KS1 mathematics 2006 Graph 26: KS1 APS 2006
target comparator targetvcomp 25.00 20.00 15.00 10.00 5.00 0.00 M ean ap sa ll pup il s readi ngy r2 006
Error bars: 95% CI
target comparator targetvcomp 25.00 20.00 15.00 10.00 5.00 0.00 M e an apsal lpupi ls w ri ti ng200 6
Error bars: 95% CI
target comparator targetvcomp 25.00 20.00 15.00 10.00 5.00 0.00 Mean a p sal lpupil s m a ths 2 0 0 6
Error bars: 95% CI
target comparator targetvcomp 25.00 20.00 15.00 10.00 5.00 0.00 M e an a p sal lpupil s a verag e point s c or e 2 0 0 6
Key Stage Two results
Regression analyses using performance in 2002, 2003, 2004 and 2005 and
school experimental status (comparator or Test Bed) as predictor variables
and performance on the KS2 English, mathematics, science and APS in 2006
as the individual outcome variables found several significant models.
Performance on the tests of English and mathematics in 2006 were predicted
by performance in 2005. Performance on the tests of science and APS in
2005 were predicted by performance in 2004. This pattern of results mirrors
the findings from previous analyses.
Table 6: Means and standard deviations for performance on the KS2
tests
English
2002
English
2003
English
2004
English
2005
English
2006
Test Bed 64.81 (18.64) 69.33 (17.64) 74.06 (16.94) 73.43 (14.42) 77.94 (13.69)
Comparator 73.68 (7.44) 71.33 (7.85) 73.89 (5.87) 76.67 (8.74) 76.03 (12.50)
Mathematics
2002
Mathematics
2003
Mathematics
2004
Mathematics
2005
Mathematics
2006
Test Bed 64.31 (22.01) 70.56 (18.15) 71.31 (18.39) 67.86 (14.31) 74.63 (19.50)
Comparator 74.02 (7.97) 70.19 (8.45) 71.98 (6.96) 73.31 (8.57) 73.49 (12.99)
Science
2002
Science
2003
ience
04
Science
2005
Science
2006 Sc
20
Test Bed 80.31 (17.55) 82.44 (10.77) 82.63 (15.27) 83.07 (13.05) 85.19 (16.50)
Comparator 87.31 (5.36) 84.51 (6.41) 84.08 (5.39) 85.09 (5.36) 83.98 (11.61)
APS 2002 APS 2003 APS 2004 APS 2005 APS 2006
Test Bed schools. This advantage for the
trend
ns).
d to have significantly improved
tween 2002 and 2006 within Test Bed schools, that is these schools had
d
mparator schools. Despite rises in performance found for the
comparator rease ance as ma the Te
Bed schoo ese results ate that i ements in mance on
in f in
h p . G n
per cent c
significantly outperforming the
comparator schools disappeared as the project progressed and there was no
significant difference found between the Test Bed and comparator schools in
subsequent years, that is the Test Bed schools have now caught up with
comparator schools and both are performing at near ceiling level. This
continued with the 2006 analyses, with no differences found between the Test
Bed and comparator schools (see table 6 for means and standard deviatio
Performance on all KS2 tests were foun
be
significantly improved over the course of the project. The same was not foun
for the co
s this inc
ls. Th
in perform
indic
was not
mprov
rked as for
perfor
st
all
tests dur g the course o the project are more frequent the Test Bed
schools t an in the com arator schools raphs 27 to 30 show means a d 95
comparator schools.
Graph 27: KS2 level 4 English 2006 Graph 28: KS2 level 4 mathematics 2006
Graph 29: KS2 level 4 science 2006 Graph 30: KS2 APS 2006
Comparator Test Bed
status
100.00
80.00
60.00
40.00
20.00
0.00
M
e
an k
s
2L
eve
l4
E
ngli
sh
2
006
Error bars: 95% CI
Comparator Test Bed
status
100.00
80.00
60.00
40.00
20.00
0.00
M
ea
n
ks2
L
eve
l4M
a
th
s2006
Error bars: 95% CI
100.00
80.00
30.00
Key Stage 3
Regression analyses with performance in 2002, 2003, 2004 and 2005 and the
experimental status of the schools as predictor variables, and performance in
2006 as the outcome variable was found to be significant for all measures
(English, mathematics, science and APS). The English test and APS, whilst
being significant models overall do not have any single predicting factor that
predicts performance in 2005. Performance on the mathematics test in 2006
was predicted by performance in 2005, whilst performance on the science test
in 2006 was predicted by performance in 2004.
A series of MANOVA analyses were also completed with Test Bed or
comparator status as the coding variable and performance on each of the
sub-tests in 2002, 2003, 2004, 2005 and 2006 as the dependent variables.
The analyses revealed that for all the subtests and the APS there was no
ficant differences between the performance of the Test Bed schools and
mparator schools for any year of the project.
peated measures ANOVA analyses found that within the Test Bed schools,
rformance on the mathematics KS3 te ad significantly improved between
02 and 2006; 2003 and 2006; 2005 a 006.
thin the comparator schools, significa provements were also found for
glish between 2002 and 2006 and al 003 and 2006. Improvements
hin the comparator schools were als nd for the KS3 science test
tween 2002 and 2006 and between 2 and 2006 and for the
mathematics test and APS between 2002 and 2006; 2003 and 2006 and also
between 2004 and 2006. signi
co
Re
pe
20
Wi
En
wit
be
st h
nd 2
nt im
so 2
o fou
and standard deviations for performance on the KS3
06 Table 7: Means
tests
English
2002
English
2003
English
2004
English
2005
English
20
Test Bed 58.20 (13.48) 58.00 (14.02) 63.40 (20.11) 60.25 (15.52) 61.75 (10.28)
Comparator 59.92 (9.10) 62.23 (6.19) 68.47 (4.91) 68.75 (4.75) 68.74 (9.96)
2005
matics
2006 Mathematics
2002
Mathematics
2003
Mathematics
2004
Mathematics Mathe
Test Bed 54.00 (13.62) 57.80 (10.01) 64.00 (9.70) 64.00 (11.25) 68.20 (9.52)
Comparator 61.30 (5.76) 66.45 (4.28) 67.63 (2.88) 69.82 (4.91) 72.32 (10.54)
ence Science
2002
Science
2003
Science
2004
Science
2005
Sci
2006
Test Bed 56.60 (16.50) 57.60 (10.55) 56 (10.23) 56.00 (15.83) 60.60 (11.55)
Comparator 59.62 (8.70) 61.69 (7.17) 58.30 (9.55) 63.13 (7.06) 64.47 (11.90)
004 APS 2005 APS 2006
APS 2002 APS 2003 APS 2
Test Bed 31.56 (2.56) 31.84 (1.83) 32.38 (2.40) 31.60 (2.50) 32.28 (1.83)
Comparator 32.18 (1.45) 32.64 (1.06) 32.93 (1.15) 33.24 (1.12) 33.53 (1.98)
Highlighted cells by colour indicate significant diffe years.
Graphs 31 to 34 showing mean KS3 scores and 95 per cent confidence in on e test and e e point s for Test Bed and comparator schools.
Graph 31: KS3 level 5 English 2006 Graph 32: e l 5 mathe ics 2006 terv
ve
als ach mat
sub av rag core KS3 l
Graph 33: KS3 level 5 science 2006 Graph 34: K
S3 APS 2006
GCSE Results
In 2005, regression analyses with the percentage of students achieving GCSE
grades A* to C in 2002, 2003 and 2004 and school status as predictors of
A*to C performance in 2005 and in 2006 were found to be significant.
Performance in the previous year (04 on 05; 05 on 06) was the only significant
tor of A* to C performance. No significant models were generated to
e distribution of A*to G grades in 2005 or 2006. This pattern of
ults was repeated from the APS gained.
tween subjects analyses highlighted differences between Test Bed and
parator schools for the proportion of students achieving five or more A* to
rades including English and mathematics (see table 8 for means and
nda eviations). Significantly more pu hieved five or more A* to C
s luding English and mathematics in Test Bed schools than in
pa r schools (mean = 38.80 Test Bed, 35.90 comparator).
fere between the Test Bed and com tor schools were also found
the ber of students achieving five or e A* to G grades, with
pa r schools scoring significantly hig n 2006 than Test Bed schools
mp r mean = 91.89, Test Bed mean .4).
e re al of findings at A* to C an A* to G es can be accounted for by
rea roportion of Test Bed pupils bein classified at GCSE. This
gests that these schools might have a greater number of pupil absences.
king at the percentage of unauthorised absences within each of the
ools no significant difference was found between the Test Bed and
pa schools. However, unauthorise sences were a negative
ear three of the project (2005) and also between year one
ls for
data.
le 8: Means and standard deviations for performance at GCSE level
year (2002) and y
(2003) and year three (2005). This finding was true for both the Test Bed
schools and the comparator schools. For comparator schools only,
performance was also found to have improved in the comparator schoo
the number of students achieving GCSE grades A* to C with performance in
each year of the project showing significant improvements. Graphs 35-38
show means and 95 per cent confidence intervals for school level GCSE
Tab A*-C 2002 A*-C 2003 A*-C 2004 A*-C 2005 A*-C 2006 A*-C 2006 (Inc English and maths)
Test Bed 44.40
(8.14) 45.60 (9.04) 43.80 (15.12) 45.20 (9.26) 52.00 (12.55) 38.80 (12.74)
Comparator 39.33
(6.72) (7.44) (4.37) (4.49)
43.45 45.62 49.88 50.16
(11.97) 35.90 (13.03) A*-G 2002 A*-G 2003 A*-G 2004 A*-G 2005 A*-G 2006 Tes
(2.05) (5.72) (6.20) (4.10)
t Bed 88.20 82.72 84.00 88.40 87.40 (5.32)
Comparator 89.25 (1.90) 91.03 (1.20) 85.30 (7.04) 92.92 (1.80) 91.89 (3.53) APS 2002 APS 2003 APS 2004 APS 2005 APS 2006
Test Bed 275.08
(17.90) 241.60 (6.65) 294.04 (49.46) 316.28 (23.14) 329.34 (42.05) Comparator 273.19 (15.93) 267.48 (16.58) 315.50 (18.81) 334.76 (19.45) 338.42 (43.72)
Highlighted cells by colour indicate significant differences across groups or
ears. y
Comment [h1]: Would you
comparator schools.
Graph 35: GCSE A* to C 2006 Gra 36: GCSE A G 20
Graph 37: GCSE APS 2006 8: GCSE to C uding maths and 2006
ph * to 06
Graph 3 A* Incl English
Comparator Test Bed
status
100.00
80.00
60.00
40.00
20.00
0.00
M
ean Astarto
C
2
006
Error bars: 95% CI
Comparator Test Bed
status
100.00
80.00
60.00
40.00
20.00
0.00
M
e
a
n
A
st
a
rt
o
G
2
006
Error bars: 95% CI
Post-16
Table 9 shows the means and standard deviations for A-level performance
data from 2002 to 2006. As reported in the local authority section, no analyses
have been conducted on these data to date due to changed in the way the
scores were calculated in 2006.
Eyeballing the data suggests that APS per student is higher for comparator
than Test Bed students but that the APS per exam entry was comparable.
Table 9: Means and standard deviations for performance on the post-16
tests APS per student 2002 APS per student 2003 per ent APS per student 2005 APS per student 2006* APS stud 2004
Test Bed 213.43
(7.09) 199.83 (12.33) 70 96) 201.58 (25.68) 533.35 (66.43) 200. (30. Comparator 187.05 (13.19) 185.23 (14.17) 52 7) 194.88 (28.56) 580.99 (107.74) 203. (6.7 APS per exam entry 2002 APS per exam entry 2003 per entry APS per exam entry 2005 APS per exam entry 2006* APS exam 2004
Te ed 67.27
(7.23) 64.80 (9.72) 5 9) 68.33 (8.29) 181.15 (19.80)
st B 66.3
(9.1
Co rator 62.24
(6.10) 60.81 (5.63) 3 7) 64.60 (7.54) 182.35 (18.29) mpa 67.6 (4.9 Hig wa
hlighted cells by colour indicate sig ant differences across groups or
years.
*Care needed when interpreting 2006 performance data due to changes in the
y the score is calculated.
[image:34.595.55.457.268.533.2]change in national performance scores (2002-2006)
s for this Key Stage.
te than the comparator schools over the period of the intervention 2002-2005.
rator schools for rates of change in mathematics, science, or APS.
r, in sign renc nd b
comparator schools for the rate of hange between 2002 and 2006 for
and for the AP ach insta the Test B o e
significant n th parator (English e re;
3.12, comparator, 2.98, maths m e; TB = 10 par
0.66, scie 8, c
ator = 0
Key Stage 3
At KS3 the o
the Test B comparator s for an e meas s 4 w
n di cores a 5 per cent c nfidence ls for e test.
There was a ant differ e betwe ompar s
period, with the comparator schools achieving greater rates of change
Rates of Key Stage 1
As in previous years, there was no significant difference in the rate of
performance change between the two groups at KS1 for 2003-2006. The 2002
data are not currently available to u
Key Stage 2
In 2005, statistically the Test Bed schools were found to be improving at a faster
ra
In 2005 there were no significant differences between the Test Bed and
compa
Howeve 2006, a
S. In e
ly more tha
ificant diffe
c
nce,
e com
e was fou
ed scho
schools
etween the Test
ls had improv
mean differ
Bed and
each test
d
nce sco
TB = 1 ean scor
omparator = -3.05 and APS mean score;
.31, com ator =
nce mean score; TB = 4.8
TB = 1.39, compar .35). See graphs 39-42.
re were no sign
ed and
ificant differe
LA
nces for rates
y of th
f change scor
ures.Graph
es between
3 to 46 sho
the mea fference s nd 9 o interva ach sub
GCSE
signific enc en the Test Bed and c ator school
on rates of change for GCSE grades A* to C and A* to G for the 2002-04 and
Graphs 39 to 42 showing mean difference scores and 95 per cent confidence intervals on each subtest and average point score for Test Bed
and comparator schools.
Graph 39: KS2 English difference score Graph 40: KS2 mathematics difference score
Graph 41: KS2 science difference score Graph 42: KS2 APS – difference scores
Comparator Test Bed status 25.00 20.00 15.00 10.00 5.00 0.00 -5.00 M e an E ngli s h200 6 m in u s 2 002
Error bars: 95% CI
Comparator Test Bed status 25.00 20.00 15.00 10.00 5.00 0.00 -5.00 M ean M aths2 006m in us20 02
Error bars: 95% CI
Comparator Test Bed status 25.00 20.00 15.00 10.00 5.00 0.00 -5.00 -10.00 M ea n S cien ce2 006m inus20 02
Error bars: 95% CI
Comparator Test Bed status 2.50 2.00 1.50 1.00 0.50 0.00 -0.50 M ea n AP S 2006m inu s 2 0 02
Graph 4
Graphs 43 to 46 showing mean difference scores and 95 per cent confidence intervals on each subtest and average point score for Test Bed
and comparator schools.
Graph 43: KS3 English difference score 4: KS3 mathematics difference score
3 APS – difference score
Graphs 47 to 49 showing mean GCSE difference scores and 95 per cent confidence intervals on each subtest and average point score for
rence score Graph 48: GCSE A*-G difference score
Graph 49: GCSE APS difference score Test Bed and comparator schools.
Graph 47: GCSE A*-C diffe
Comparator Test Bed status 25.00 20.00 15.00 10.00 5.00 0.00 -5.00 M e an As ta rt oC 2006m in us2 0 0 2
Error bars: 95% CI
Comparator Test Bed status 20.00 10.00 0.00 -10.00 M e a n A s ta rt oG 20 0 6 m inu s 2 00 2
Error bars: 95% CI
Comparator Test Bed status 400.00 300.00 200.00 100.00 0.00 M ean AP S 2 0 06mi n u s2002
Methodology
Analysis of school based data
Benchmarking for schools was completed for the first time using performance
data from the academic year 2002/2003 and was reported in the January
2004 Annual Report. The procedure for benchmarking these institutions and
their identified comparators has remained the same throughout the
evaluation.
The list of comparator schools initially established for the first year of analysis
was drawn up to consist of schools matched according to the following
measures: proximity (where feasible two within the Test Bed LA and two
within other English authorities), size (total number of pupils), location
(urban/rural), Acorn group type (1 to 15) which provides demographic
formation on the schools based on their postcodes, phase of education, type
of establishment, statutory lowest and highest ages of entry, and sex, where
ssible institutions were also matched according to their faith denomination.
mparator institutions were also subsequently matched according to the
mber of permanent exclusions made at each school in the academic year
00/2001 and also according to the percentage of half days missed due to
authorised absence in the academic year 2002/2003. The final ratio of Test
d to comparator schools was one to four for all but two schools1.
alysis of LA based data
additional series of analyses were conducted using performance data from
schools within the three Test Bed local education authorities (LAs) and
from all schools within specifically chosen comparator LAs. The comparator
s were matched according to the English indices of deprivation 2004 report in
po
Co
nu
20
un
Be
An
An
all
Rank of local concentration: Local concentration is one way of identifying a
district’s ‘hot spots’ of deprivation which involves putting into rank order the
mean score of the population weighted rank of a district’s most deprived
areas.
Rank of income scale: This scale captures the proportions of the population
experiencing income deprivation in an area and is measured as the proportion
of households living below 60 per cent of median income. The rank score is
based on a series of indicators such as the number of adults and children in
income support households and in income based job seekers allowance
households.
Rank of employment scale: This scale measures employment deprivation
conceptualised as involuntary exclusion of the working age population from
the world of work and combines indicators such as the unemployment
claimant count of women aged 18-59 and men aged 18-64 averaged over four